HAL Id: hal-00466840
https://hal-mines-paristech.archives-ouvertes.fr/hal-00466840
Submitted on 25 Mar 2010HAL is a multi-disciplinary open access archive for the deposit and dissemination of sci-entific research documents, whether they are pub-lished or not. The documents may come from teaching and research institutions in France or abroad, or from public or private research centers.
L’archive ouverte pluridisciplinaire HAL, est destinée au dépôt et à la diffusion de documents scientifiques de niveau recherche, publiés ou non, émanant des établissements d’enseignement et de recherche français ou étrangers, des laboratoires publics ou privés.
Energy-specific solar radiation data from MSG: The
Heliosat-3 project
Marion Schroedter Homscheidt, Jethro Betcke, Hanne Breitkreuz, Annette
Hammer, Detlev Heinnemann, Sybille Petrack, Thomas Holzer-Popp, Lucien
Wald
To cite this version:
Marion Schroedter Homscheidt, Jethro Betcke, Hanne Breitkreuz, Annette Hammer, Detlev Heinne-mann, et al.. Energy-specific solar radiation data from MSG: The Heliosat-3 project. 3rd MSG RAO Workshop, Jun 2006, Helsinki, Finland. pp.52-57. �hal-00466840�
SchroedterHomscheidt M., Betcke J., Breitkreuz H., Hammer A., Heinemann D., Petrack S., HolzerPopp T., Wald L., 2006. Energyspecific solar radiation data from MSG: The Heliosat3 project. In Proceedings of the 3rd MSG RAO Workshop, 15 June 2006, Helsinki, Finland, Book Series: ESA SP619, 5257.
ENERGYSPECIFIC SOLAR RADIATION DATA FROM MSG:
THE HELIOSAT3 PROJECT
Marion SchroedterHomscheidt, Jethro Betcke1, Hanne Breitkreuz, Annette Hammer1, Detlev
Heinemann1, Sibylle Petrack1, Thomas HolzerPopp, Lucien Wald2
Deutsches Zentrum für Luft und Raumfahrt e.V. (DLR) Deutsches Fernerkundungsdatenzentrum (DFD) Oberpfaffenhofen, D82234 Weßling, Germany phone: ++498153282896, fax ++498153281445 email: Marion.Schroedter[email protected] 1 Universität Oldenburg, Abteilung Energie und Halbleiterforschung 2 Armines / Ecole des Mines de Paris ABSTRACT Solar energy technologies such as photovoltaics, solar thermal power plants, passive solar heating/cooling systems and day lighting in buildings are expected to continue their very rapid growth. In this context the availability of reliable solar radiation data is of high economic value both for planning and operating these systems.
HELIOSAT3 aims the quantification of surface solar irradiance in cloud free and cloudy situations and additional energyspecific parameters as direct normal and diffuse irradiance over Europe and Africa using the enhanced capabilities of MSG. Emphasis is laid on clouds, water vapour, aerosols and ozone and their influence on surface solar irradiance.
Both the HELIOSAT3 European Commission FP5 and the ENVISOLAR (ESA Earth Observation Market Development Program) projects made profit from the data access and additional MSG product information obtained through the RAO program. The paper focuses on results obtained during the RAO project.
INTRODUCTION
The Heliosat method [1, 2] was developed for Meteosat First Generation to calculate surface solar irradiance from measurements in the visible channel. It is supposed that the sunlight reflected by clouds is inversely related to the sunlight transmitted by them. The scheme takes the variability of the cloud field and its impact on hourly global and diffuse irradiance into account. Together with a sophisticated model of clearsky irradiance [3] this method gives reliable results for Europe for most of the year.
Potential for improvement is expected in winter time especially in snow covered areas, during morning and evening hours due to threedimensional effects of clouds to be described with cloud physical parameters and in the clear sky case using more detailed input information on aerosols and water vapor. Therefore, a new scheme called Heliosat3 was developed in the MSGRAO and EU FP5 programs (Fig. 1).
Figure 1. Heliosat3 scheme [4]
SNOW COVER
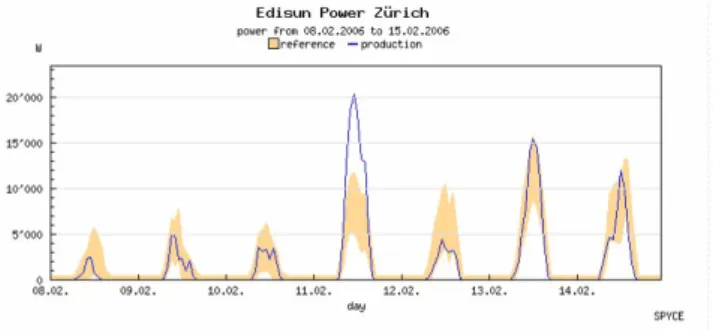
The old Heliosat method fails in wintertime, when snow is covering the surface under clear skies. Due to their high reflectances these cases are falsely classified as overcast, which leads to a remarkable error in the global irradiance values. Fig. 2 gives an example of an existing photovoltaic (PV) system showing high energy yield on 11th February 2006 while the satellitebased estimate is
Figure 2. Hourly effective energy production (solid line) and reference yields (yellow) of a PV plant (Source
Enecolo SPYCE service).
Even the opposite effect is observed as e.g. in Fig. 3. In this case the PV system delivers an energy yield close to zero due to snow cover on the modules while the satellitebased energy production estimate reaches 1500 W as usual for a sunny situation in wintertime. In case the snow cover is known, the assumption of a total hardware failure can be denied and a false alarm to the system maintenance staff can be avoided. Figure 3. Hourly effective energy production (solid line) and reference yields (yellow) of a PV plant (Source Enecolo SPYCE service). The MSG channels give the opportunity to discriminate snow from clouds and to reduce this error source. A multitemporal snow cover detection algorithm was developed [5, 6]. Snow maps are derived in 3x3 km² nadir SEVIRI pixel resolution and superimposed to cloud index maps derived from HRV reflectances (1x1 km²) by an adapted Heliosat method. Results are given in Fig. 4. While some falsely detected snow pixels lead to an overestimation of global irradiance, the remarkable underestimation of a method without snow detection vanishes. Figure 4. Hourly global irradiance with (blue) and without snow detection (red) for 20 German stations in February – March 2005 GEOMETRICAL CORRECTION USING CLOUD HEIGHT MSG has another opportunity to derive a better quality in the derived surface irradiance, namely the higher resolution in space and time compared to MFG. When making full use of this high resolution data, a three dimensional consideration is optimal. A cloud in the sky has its largest effect on the irradiance measured at the ground when it is affecting the direct beam. For a given pixel the clouds between pixel and sun must be analysed instead of the clouds between the pixel and the observer (MSG). For a geometric correction of this effect cloud top height is needed and can be provided by MSG SEVIRI. In a first approach a standard cloud of 1 km thickness and a seasonal variation of cloud top height was assumed. Fig. 5 gives validation results for global irradiances measured at the ground station Vaulxen Velin (France) for the period March – August 2004 and November 2004 – February 2005. Fig. 6 presents the same analysis but for Freiburg (Germany). A remarkable improvement in monthly root mean square errors (RMSE) can be noticed. The next step will be the use of MSG based cloud top height information. global irradiance ground measured [W/m2] g lo ba l i rr ad ia nc e sa te lli te [W /m 2]
Figure 5. Improvement in monthly RMSE of hourly global irradiance for VaulxenVelin (France) due to a geometrical correction for cloud height. Figure 6. Improvement in monthly RMSE of hourly global irradiance for VaulxenVelin (France) due to a geometrical correction for cloud height. VALIDATION OF THE HELIOSAT3 METHOD Taking the better spatial resolution of MSGHRV in comparison to the old Meteosat satellite, the new capabilities for snow detection and a basic geometrical correction into account, an overall validation has been performed for 20 DWD ground stations measuring global irradiance for the full year of 2005 (Fig. 7). The overall bias for hourly values decreases from 1.2% for METEOSAT7 to 0.4% for METEOSAT8 and the standard error decreases from 19.5% to 17.8%.
Figure 7. Improvement in monthly bias and standard error of hourly global irradiance for 20 DWD
ground stations in 2005.
A significant improvement can be noticed in the winter months due to snow detection. During the summer months a slight improvement in standard error can also
be noticed which is attributed to the increased spatial resolution of the HRV channel.
NEED FOR AEROSOL INFORMATION
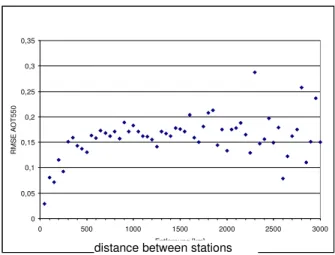
It has been stated e.g. by [7] that accurate aerosol information is crucial for irradiance calculations in the clear sky case. Climatologies or model output data sets with a typical grid size of 3 to 5° are currently available. Fig. 8 shows the RMSE in aerosol optical thickness at 550 nm to be expected for hourly values if such climatologies are used.
Figure 8. Variogram based on 30 European AERONET ground measurements of AOT at 550 nm in 2003.
This analysis was performed using AERONET ground measurements [8] for 30 European stations in 2003. Data from the year 2004 or 2005 reveal similar results. From that analysis it can not be expected that new global data sets with a spatial resolution of several degrees can improve the situation remarkably. This is in line with the findings of the solar energy community that the use of different existing aerosol climatologies or recently made available model data sets did not increase the accuracy.
On the other hand, the new ENVISAT and the upcoming METOP satellites with the SCIAMACHY and GOME2 instruments and a pixel size around 0.5° have the potential to deliver aerosol information in a spatial resolution more suitable for this user community. Yet, to account for the temporal and spatial variability of aerosols, an optimum retrieval scheme would deliver products in the same temporal and spatial resolution as MSGSEVIRI. 0 0,05 0,1 0,15 0,2 0,25 0,3 0,35 0 500 1000 1500 2000 2500 3000 Entfernung [km] R M S E A O T 55 0 distance between stations
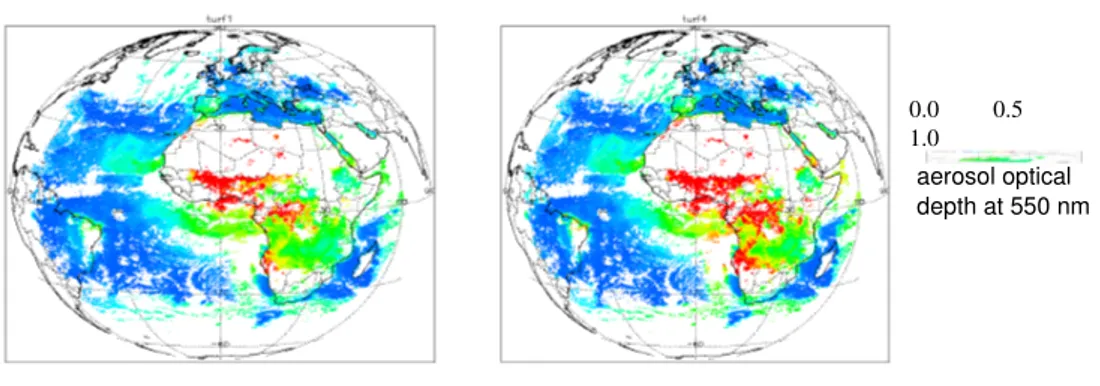
Figure 9. Aerosol optical depth at 550nm derived from MSG SEVIRI on 1st August 2004 assuming fixed aerosol types.
AEROSOL STUDY BASED ON MSG
Therefore, the SYNAER method was applied for SEVIRI. The SYNAER method (SYNergetic AErosol Retrieval, [HolzerPopp]) delivers boundary layer aerosol optical depth (AOD) and type over both land and ocean. After cloud detection, AOD is calculated over automatically selected and characterized dark pixels and surface albedo correction for a set of 40 different predefined boundary layer aerosol mixtures is performed. A least square fit of a simulated spectrum based on the corrected surface albedo to the MSG SEVIRI channels delivers the AOD value. Unfortunately, MSG SEVIRI has no blue channels, which means that the spectrum is not covered complete. Therefore, accurate aerosol retrieval cannot be expected. Nevertheless, in the HELIOSAT3 project a case study was made to quantify the dependence on aerosol type for an example case. Fig. 9 gives the SYNAER results for MSGSEVIRI on 1st August 2004 assuming fixed
aerosol types of pure sulfate and of a polluted continental aerosol. Large differences in quantitative values can be observed due to the missing aerosol type information as result of the missing spectral resolution of SEVIRI in the blue spectral region.
This test trial reveals clearly, that aerosol type information has to be provided as auxiliary data set to a SEVIRIbased aerosol retrieval scheme. It is proposed to provide such information from polar satellites as e.g. ENVISAT and in future METOP as they have opportunities to separate major aerosol types. Therefore, the next section reports on recent results in retrieving aerosol type information from ENVISAT AATSR and SCIAMACHY using SYNAER in the PROMOTE project.
AEROSOLS FROM ENVISAT
For ENVISAT, the high spatial resolution of the AATSR instrument (Advanced Along Track Scanning Radiometer) permits accurate cloud detection, dark pixel selection and surface albedo correction. After spatial integration to the larger pixels of the
spectrometer SCIAMACHY (SCanning Imaging Absorption spectroMeter for Atmospheric CartograpHY) these parameters are used to simulate SCIAMACHY spectra for the same set of different aerosol mixtures.
SYNAER has been implemented for operational processing at the German Remote Sensing Data Center within the ESA GSE PROMOTE (Protocol Monitoring for the GMES Service Element; see also
http://www.gsepromote.org) and delivers daily near real time observations (within the same day) and an evolving archive of historic data. pure sulfate aerosol polluted continental aerosol 0.0 0.5 1.0 aerosol optical depth at 550 nm
Figure 9: Seasonal variation of soot: monthly mean maps of soot aerosol optical depths for the months April, July, August, September, October 2003, and December 2005 are shown from top to bottom. As comparison the AEROCOM climatology [10] is given. The seasonal behavior visible in the SYNAER data is shown in Fig. 9 for the soot component. Here, three major features can be seen: From July to September the tropical African biomass burning moves South and East together with its plume over the Atlantic (which is slightly visible). The Amazonian biomass burning season mainly extends from August to October. Over large parts of Europe, no data are available in December (due to low sun, high cloudiness and snow cover). Highest European soot concentrations are detected, when observations are becoming available still in the heating season (April). Additionally, wildfires in August (hot summer 2003) contribute to elevated soot over the Iberian peninsula.
CONCLUSIONS
Starting from the fact that large inconsistencies in existing irradiance data bases available for solar energy engineering, the Heliosat3 RAO project aimed at using the enhanced temporal, spatial and spectral resolution of the Meteosat Second Generation SEVIRI instrument for an improved derivation of global and direct irradiance. It was shown, that cloud top height is needed to account for basic threedimensional effects of clouds in radiative transfer. In future, SEVIRI derived cloud top heights will be included in a modified cloud index scheme as part of the new Heliosat3 method. Additionally, snow detection allows avoiding errors due to misdetection of clouds as snow and vice versa. It helps to decide on a possible hardware failure in automatic failure detection routines for photovoltaic system monitoring.
A parameterization scheme (SOLIS, [3]) based on radiative transfer calculations was developed which allows to take actual information on aerosol optical depth, angstrom coefficient and water vapor concentration into account. There is an urgent need for improved aerosol optical depth information in a better spatial and temporal resolution than available nowadays from global models and climatologies. Therefore, SYNAER aerosol retrievals were analyzed both for a test trial with MSG SEVIRI and for ENVISAT. The trial for SEVIRI shows the clear need for aerosol type information as input for any aerosol optical depth retrieval scheme using SEVIRI.
ENVISAT based SYNAER results show first successful results on the discrimination of water soluble and soot results, while the large aerosol particles from mineral and sea salt sources are still a subject of further work. Followon activities will be performed in the virtual Institute of Energy Meteorology (vIEM), the ESA GSE PROMOTE and on the market development for solar energy services based on Earth observation within the ESA EOMD project ENVISOLAR.
1. Cano, D., Monget, J., Albuisson, M., Guillard, H., Regas, N., and Wald, L., A method for the determination of the global solar radiation from meteorological satellite data, Solar Energy, 37, 31–39, 1986.
2. Beyer, H., Costanzo, C., Heinemann, D., Modifications of the Heliosat procedure for irradiance estimates from satellite images, Solar Energy, 56, 207– 212, 1996.
3. Müller, R.W., K. F. Dagestad, P. Ineichen, M. SchroedterHomscheidt, S. Cros, D. Dumortier, R. Kuhlemann, J.A. Olseth, G. Piernavieja, C. Reise, L. Wald, D. Heinemann, Rethinking satellitebased solar irradiance modeling The SOLIS clearsky module,
Remote Sensing of Environment, 91, 160174, 2004.
4. Zelenka, A., Science Review ENVISOLAR project,
http://www.envisolar.com, 2004
5. Heinicke, S., <<genauer Titel, Annette????>>, Diploma Thesis University of Oldenburg, 2006
6. De Ruyter de Wildt, M., Seitz, G., Grün, A., Snow mapping using multitemporal Meteosat8 data, EARSEL eProceedings 5, 1/2005.
7. Gueymard, C. A., Direct solar transmittance and irradiance predictions with broadband models. Part I: detailed theoretical performance assessment, Solar
Energy, 74, 355379, 2003.
8. Holben, B.N., et al, AERONET: A federated instrument network and data archive for aerosol characterization, Remote Sensing of Environment, 66, 1 16, 1998.
9. HolzerPopp, T., Schroedter, M., & Gesell, G., Retrieving aerosol optical depth and type in the boundary layer over land and ocean from simultaneous GOME spectrometer and ATSR2 radiometer measurements: 1. Method description, Journal of
Geophysical Research, 107(D21), 4578, 2002.
10 Kinne << THOMAS ODER HANNE BITTE ERGÄNZEN>>
![Figure 1. Heliosat3 scheme [4]](https://thumb-eu.123doks.com/thumbv2/123doknet/12498464.340066/2.892.477.833.653.859/figure-heliosat-scheme.webp)
![Figure 9: Seasonal variation of soot: monthly mean maps of soot aerosol optical depths for the months April, July, August, September, October 2003, and December 2005 are shown from top to bottom. As comparison the AEROCOM climatology [10] is given](https://thumb-eu.123doks.com/thumbv2/123doknet/12498464.340066/6.892.83.433.101.1095/seasonal-variation-september-october-december-comparison-aerocom-climatology.webp)
