HAL Id: hal-01407494
https://hal-mines-paristech.archives-ouvertes.fr/hal-01407494
Submitted on 14 Dec 2016HAL is a multi-disciplinary open access archive for the deposit and dissemination of sci-entific research documents, whether they are pub-lished or not. The documents may come from teaching and research institutions in France or abroad, or from public or private research centers.
L’archive ouverte pluridisciplinaire HAL, est destinée au dépôt et à la diffusion de documents scientifiques de niveau recherche, publiés ou non, émanant des établissements d’enseignement et de recherche français ou étrangers, des laboratoires publics ou privés.
ENVI-PV: an interactive Web Client for multi-criteria
life cycle assessment of photovoltaic systems worldwide
Paula Perez-Lopez, Benoît Gschwind, Philippe Blanc, Rolf Frischknecht,
Philippe Stolz, Yvonnick Durand, Garvin Heath, Lionel Ménard, Isabelle
Blanc
To cite this version:
Paula Perez-Lopez, Benoît Gschwind, Philippe Blanc, Rolf Frischknecht, Philippe Stolz, et al.. ENVI-PV: an interactive Web Client for multi-criteria life cycle assessment of photovoltaic systems world-wide. Progress in Photovoltaics, Wiley, 2017, Key Papers from EU PVSEC 2016, 25 (7), pp.484-498. �10.1002/pip.2841�. �hal-01407494�
1
ENVI-PV: An interactive Web Client for multi-criteria life
cycle assessment of photovoltaic systems worldwide
Paula Pérez-López1*, Benoît Gschwind1, Philippe Blanc1, Rolf Frischknecht2, Philippe Stolz2, Yvonnick Durand3, Garvin Heath4, Lionel Ménard1, Isabelle Blanc1
1 MINES ParisTech, PSL Research University, Centre Observation, Impacts, Energie (O.I.E.), 1 rue Claude Daunesse CS 10207, 06904 Sophia Antipolis Cedex, France 2 treeze Ltd., Kanzleistrasse 4, CH-8610 Uster, Switzerland
3 ADEME, 500 route des Lucioles, 06560 Valbonne, France
4 Technology Systems and Sustainability Analysis Group, Strategic Energy Analysis Center, National Renewable Energy Laboratory, Golden, CO 80401, USA
* Corresponding author: Tel.: +33 4 97 15 70 55; E-mail address: paula.perez_lopez@mines-paristech.fr
Abstract
Solar photovoltaics (PV) is the second largest source of new capacity among renewable energies. The worldwide capacity encompassed 135 GW in 2013 and is estimated to increase to 1721 GW in 2030 and 4674 GW in 2050, according to a prospective high-renewables scenario. To achieve this production level while minimizing environmental impacts, decision makers must have access to environmental performance data that reflect their high spatial variability accurately. We propose ENVI-PV (http://viewer.webservice-energy.org/project_iea), a new interactive tool that provides maps and screening level data, based on weighted average supply chains, for the environmental performance of common PV technologies. Environmental impacts of PV
2 systems are evaluated according to a Life Cycle Assessment approach. ENVI-PV was developed using a state-of-the-art interoperable and open standard Web Service framework from the Open Geospatial Consortium (OGC). It combines the latest life cycle inventories, published in 2015 by the International Energy Agency (IEA) under the Photovoltaic Power Systems Program (PVPS) Task 12, and some inventories previously published from Ecoinvent v2.2 database with solar irradiation estimates computed from the worldwide NASA SSE database. ENVI-PV is the first tool to propose a worldwide coverage of environmental performance of PV systems using a multi-criteria assessment. The user can compare the PV environmental performance to the environmental footprint of country electricity mixes. ENVI-PV is designed as an environmental interactive tool to generate PV technological options and evaluate their performance in different spatial and techno-economic contexts. Its potential applications are illustrated in this paper with several examples.
Keywords PV Web Service, interactive tool, PV environmental performance, solar
irradiation data, IEA PVPS Task 12, OGC standard, interoperability.
1. Introduction
Electricity from photovoltaic (PV) systems is the second largest source of new capacity among renewable energies. It constitutes approximately one-third of the current renewable energy generation [1]. The worldwide installed capacity is expected to increase from 135 GW in 2013 to 1721 GW in 2030 and 4674 GW in 2050 [2], according to the high-renewables scenario (hi-Ren) described by the IEA [3]. PV systems are fed by an extensive renewable source, namely the sunlight, and cause very low emissions during the use phase [4]. However, upstream and downstream processes
3 corresponding to materials extraction, components manufacturing and transport and end-of-life management need to be taken into account to quantify the total environmental impacts [4-6]. Most of the available studies are based on Life Cycle Assessment (LCA) methodology and focus on greenhouse gas emissions and primary energy use as environmental indicators [5, 7, 8]. Additional impact categories should also be taken into account to evaluate other environmental and human health concerns of the existing PV technologies according to a multi-criteria approach [5, 9].
Technological, economic and planning aspects need to be taken into account to achieve the estimated future production level while minimizing environmental impacts [10, 11]. Spatially-dependent factors that affect PV performance should also be considered [10-12]. The development of PV systems requires the access to detailed data that support the decision-making process, such as local information on climate and soil characteristics (solar irradiance, number of sun hours per day, ground slope…) and technological data [11, 13, 14]. PV systems belong to an emerging sector with continuous technological changes [4, 15]. Thus, the environmental analyses should rely on updated databases that reflect the most recent designs. These data contribute to identify potential benefits and orient strategies at early stages of product development and implementation [5, 15]. PV systems should also be explored to position this technology within the current energy transition debate, in order to anticipate the changing technologies and possible progress [16].
For these reasons, we propose ENVI-PV (http://viewer.webservice-energy.org/project_iea), a new interactive Web Client that provides data and maps of the environmental performance of a set of common PV systems including current and future techno-economic contexts. The calculation procedures are based on LCA, a standardized tool for the environmental assessment of products and processes applicable to renewable
4 energies [7]. The environmental results are provided at screening level, which means that life cycle impacts are calculated for worldwide average production rather than for the specific supply chain in each manufacturing country. The tool is based on the life cycle inventory updates published in 2015 by IEA PVPS Task 12 [17, 18], as well as on PV scenarios from Ecoinvent database v2.2 previously published [19]. ENVI-PV has a worldwide coverage with a multi-criteria scope, both in terms of alternative modeled systems and available environmental indicators [17-24]. The user can compare the PV environmental performance to the environmental footprint of the corresponding country electricity mix [25]. ENVI-PV results may allow analyzing the interest of integrating PV within national electricity mix across all available environmental indicators. Examples of its potential uses are proposed to illustrate the various applications.
2. Web Client architecture
ENVI-PV provides the environmental performances of PV systems in the form of a Web Client invoking a Web Service [11]. A Web Service is a software application built with an open standards-based interface that supports direct machine-to-machine interactions over the Web [26, 27]. A Web Client is the software that provides the human-to-machine interface to access one or several Web Services through a Web Browser [28]. In our case, two Web Services, namely Web Maps Service (WMS) and Web Processing Service (WPS), combine algorithms for the calculation of PV life cycle environmental impacts and annual solar irradiation.
The interactive tool was developed using a state-of-the-art interoperable and open standard Web Service framework from the Open Geospatial Consortium (OGC), which includes WMS and WPS. ENVI-PV is available through internet via a new Web Client derived from a previous tool developed by our team in 2010 and provides a combination
5 of tailored scenarios. It is integrated within the collection of Web Services and applications offered by the Spatial Data Infrastructure (SDI) www.webservice-energy.org. This SDI aims at providing the users with a unique point of access for renewable energy and environment resources from a geospatial data catalogue and a set of online interactive tools. It is operated by the Center for Observation, Impacts, Energy (O.I.E, MINES ParisTech) since 2008 [11].
The SDI is currently recognized as a Global Earth Observation System of Systems (GEOSS) community portal that connects users to thousands of Web Services. It integrates tools based either on standards, formats and protocols from the World Wide Web Consortium (W3C) and from the Open Geospatial Consortium (OGC). These include Web Service Description Language (WSDL), Simple Object Access Protocol (SOAP), Web Feature Services (WFS), WMS, WPS and Sensor Observation Services (SOS).
The interoperability of the described architecture and its standard approach enables the access to our results of environmental performance maps obtained via the two Web Services. This interoperable architecture gives external entities, such as stakeholders or developers, the opportunity to develop new applications reusing these results.
The architecture based on Web Services facilitates the update of ENVI-PV and other future applications because they automatically use internal updates of the Web Services.
3. Environmental assessment and solar irradiation databases
The algorithms for the calculation implemented in ENVI-PV Web Services couple the application of LCA method for the quantification of environmental burdens with solar irradiation data computed from the worldwide NASA SSE database [29].
6 3.1. Life cycle assessment approach
Renewable technologies and particularly PV systems exhibit remarkably lower emissions and better environmental performances than fossil sources during their utilization phase [4, 30]. However, their impact during manufacturing and installation as well as end-of-life management phases should also be quantified to assess their environmental sustainability [5, 6, 31]. Life cycle assessment (LCA) is one of the most widespread tools recommended for the environmental evaluation of emerging technologies such as PV systems [4-6, 8, 12, 16, 32]. LCA is a standardized method that aims at assessing the environmental impacts of products and processes over their whole life cycle, from the extraction and processing of raw materials to the use and end-of-life stages [33, 34]. The main advantage of LCA approach is that it allows quantifying the environmental impacts with no underestimations associated with the exclusion of any of the stages of the life cycle. Thus, it prevents individual stakeholders from shifting the environmental burdens from one stage to another instead of considering the reduction of the impact over the whole life cycle [35]. The environmental impacts are quantified by classifying the emitted substances and extracted raw materials into specific impact categories and converting their values into reference units (e.g., kg CO2-eq to measure climate change impacts) through sets of characterization factors [34].
In the case of ENVI-PV, the modeled processes are based on the life cycle inventories for 3 kWp slanted-roof laminates and panels and 570 kWp open ground PV systems developed within the IEA PVPS Program Task 12 [17,18], as well as on previous processes from Ecoinvent v2.2 database [19]. The inventoried technologies include mono- and multi-crystalline silicon cells (mono-Si and multi-Si), ribbon-silicon cells (ribbon-Si), amorphous-silicon cells (a-Si), micro-silicon cells (micro-Si), cadmium telluride cells (CdTe) and copper indium gallium selenide cells (CIS). As
above-7 mentioned, ENVI-PV outcomes consist in screening level LCA results calculated for worldwide average supply chains. The manufacturing countries and regions for each technology are listed in Table 1. The relative contributions of Asian & Pacific, Chinese, European and North American supply chains are weighted according to world market shares specific of each panel component. The inventories correspond to PV systems installed within Europe. Variations in transport distances between the production and installation locations for the different sites evaluated in section 4 are excluded from the LCA results. The latter two assumptions are justified by the fact that PV installation and transport have already been identified as marginal contributors to the total environmental impact of PV systems (with contributions well below 5%) in previous LCA studies [8, 12, 36]. Thus, different approaches to compute their effect are expected to have a low influence on the total LCA results.
Table 1. Regions of PV panel manufacturers per technology according to IEA PVPS Task 12 [17]
Technology Region / Country
Mono- and multi-crystalline Si (Silicon)
China Europe United States
Asia and Pacific (mainly South Korea and Japan)
CdTe (Cadmium Telluride)
Asia and Pacific (Malaysia) United States
CIS (Copper, indium, gallium
8 Figure 1. Available production scenarios provided by the Web Client. Each scenario is defined by 3
components: power output and mounting, techno-economic context and technology. The links between components in this figure represent currently implemented scenarios
Figure 1 summarizes the 27 scenarios available in ENVI-PV (a complete list of scenarios is provided in Table S1 of the Supporting Information). Each scenario is selected by the user by choosing among 3 different “power output and mountings”, 4 “techno-economic contexts” and 7 “technologies”. The techno-economic context is taken into account by selecting either “current” or “prospective” (future) scenarios. Future scenarios are provided for mono-Si and CdTe technologies, according to life cycle inventories from IEA PVPS Program Task 12 [17]. Mono-Si PV laminates were selected as a widespread technology, since they currently cover approximately 40% of annual global production of PV power plants and CdTe was selected as an emerging and relatively inexpensive technology with approximately 6% global production [17, 37]. Additionally, the Web Client allows calculating the environmental footprint of the
9 corresponding current country electricity mix according to the inventories developed by treeze Ltd. [25], in full coherence with background data developed for the PV inventories from the IEA PVPS Task 12 [17, 18].
The selection of available environmental indicators (i.e. impact categories) for the implementation in ENVI-PV was based on the description provided by the IEA report [20]. The environmental assessment method proposed in the report relies on the midpoint indicators of the European Product Environmental Footprint (PEF) recommendation [38]. It is here referred to as ILCD 2011 Midpoint+. ENVI-PV also includes multi-criteria and single-issue environmental assessment methods reported in previous literature, such as IMPACT 2002+, USETox, Cumulative Energy Demand or IPCC 2013 [21-24].
The geo-localized environmental performances for energy systems are expressed as the ratio of their environmental impacts issued from LCA, over the generated energy along the whole production period, according to equation 1.
nvironmental performance otal impact over life cycle
enerated electricity ( )
The performance is therefore expressed as the target impact in the reference unit (specific of each impact category and method) per kWh of electricity generated over the expected production period.
3.2. NASA SSE database for solar irradiation
The quantification of multi-annual mean of surface solar global irradiations enables estimating the total energy production of PV systems at a specific location over a given lifetime. The total electricity production is obtained from equation (2):
enerated electricity peak rradiation
10 where Ppeak = nominal rated maximum power in kWp of the system based on 1 kW/m2 radiation at standard test conditions (STC).
Irradiation = annual irradiation for the location and the specified orientation and inclination angles in kWh/m2/yr.
HSTC = irradiance at STC equals 1 kW/m2.
PR = the performance ratio, which is an indicator of the efficiency of a PV system that measures the overall effect of losses on the overall performance [39]. ENVI-PV uses 80% as the default value, but a more accurate value ranging between 50% and 90% can be provided by the user [20, 39, 40]. The PR takes into account the effect of temperature on the specific PV technology, the incomplete utilization of irradiation and component inefficiencies and failures. In general, new systems tend to have higher PR than older installations. Thus, values between 50-75% are common in PV systems installed in the late 1980s, 70-80% for systems of the 1990s and ratios above 80% for systems installed nowadays. More details on the estimation of PR can be found in [39] and [40].
Systlife = PV system lifetime in years, also selected by the user. Possible values accepted by the tool range between 20 and 40 years. A default average lifetime of 30 years is recommended for current scenarios, while values from 30 to 40 years may be selected for future scenarios depending on the techno-economic context [17, 18].
Loss ratio = a coefficient that accounts for the total efficiency lost during the panel life, estimated as 0.7% per year, according to the IEA recommendation [20]. The coefficient corresponds to the average loss ratio over the period, which is determined by applying equation (3): oss ratio ∑ (i ) systlife i 7 (syslife ) ( )
11 The expected yearly electricity production of the PV systems has been computed by applying solar irradiation data from the freely available NASA SSE database (https://eosweb.larc.nasa.gov/sse). More precisely, the 1°x1° worldwide maps of multi-annual average of monthly global and diffuse irradiations over a total period of 22 years have been used to compute the expected yearly global irradiations on the tilted plane corresponding to the PV systems. The algorithm for the calculation is the same as the one applied for the NASA SSE database itself, which corresponds to the RETScreen method [29]. The multi-annual monthly global irradiations are estimated with a 3% uncertainty.
4. Results and discussion
ENVI-PV has been developed as an interactive user interface matching the foreseen needs of the users. These needs were identified by the consensus of a panel of experts from the main organizations in the field of renewable energies, including IRENA (International Renewable Energy Agency) and ADEME (French Environment and Energy Management Agency). After the selection of (1) the PV technology (CIS, CdTe, mono- i…), (2) the type of system (power output and mounting), (3) the techno-economic context (current or prospective), (4) the performance ratio, (5) the orientation and inclination, (6) the PV lifetime and (7) the environmental impact assessment method and impact category, ENVI-PV users can obtain:
1. Worldwide maps of environmental performance for the selected impact category, consisting in screening level LCA results based on worldwide average life cycle inventories from existing supply chains.
2. For each point on the map: the environmental impact, the latitude and the longitude, the mean annual solar irradiation and the environmental performance (impact / kWh).
12 3. And the comparison of the PV environmental performance to the total environmental footprint of the corresponding country electricity mix, provided as net benefit (in %) for all the country supply mixes inventoried by [25]. The complete list of country mixes available in ENVI-PV is provided in Table S2 of the Supporting Material.
The interactive Web Client allows the user to investigate different PV configurations for representative 3kWp or 570kWp systems combined with different options of installation, orientation and inclination. The techno-economic context defined by selecting either “current” or “prospective” scenarios. Regarding future scenarios [17], three different approaches are provided to estimate the possible situation of the market by 2050:
1. Business-as-usual (BAU): pessimistic context based on the continuation with currently established policies and no additional energy goals set. 2. Realistic improvements (REAL): realistic context based on an intense
empowering of renewable energy sources and energy efficient technologies, in a context of high priority given to energy politics.
3. Optimistic improvements (OPT): very optimistic context associated with highly ambitious energy policies and high support of efficient technologies.
The main differences in the parameters considered to model current and prospective scenarios are shown in Table 2. Electricity mixes were adjusted for the reference year 2050 according to the three prospective techno-economic contexts (BAU, REAL and OPT) following the data from NEEDS project [17, 41]. Detailed unit process data per region are provided in the Supporting Information for current and prospective techno-economic contexts.
13 Table 2. Key parameters for mono-Si and CdTe technologies in current and future scenarios
according to IEA PVPS Task 12 [17] (BAU=Business-as-usual; REAL= realistic improvements; OPT= Optimistic improvement)
Mono-Si CdTe
Parameter Current BAU REAL OPT Current BAU REAL OPT
Cell efficiency 16.5% 25.0% 27.0% 29.0% 15.6% 22.8% 24.4% 26.0% Derate cell to module efficiency 8.5% 8.5% 6.8% 5.0% 13.9% 10.0% 7.5% 5.0% Module efficiency 15.1% 22.9% 25.2% 27.6% 13.4% 20.5% 22.6% 24.7% Wafer thickness/layer thickness 190 μm 150 μm 120 μm 100 μm 4.0 μm 2.0 μm 1.0 μm 0.1 μm Electricity demand in CdTe laminate manufacture
N/A N/A N/A N/A 100% 86% 81% 74%
Kerf loss 190 μm 150 μm 120 μm 100 μm N/A N/A N/A N/A
Silver per cell 9.6 g/m2 9.6 g/m2 5.0 g/m2 2.0 g/m2 N/A N/A N/A N/A
Fluidized-bed reactor (FBR) share of poly Si production
0% 20% 40% 100% N/A N/A N/A N/A
Glass thickness 4.0 mm 4.0 mm 3.0 mm 2.0 mm 3.5 mm 3.5 mm 3.0 mm 2.0 mm
Operational
lifetime 30 years 30 years 35 years 40 years 30 years 30 years 35 years 40 years
To illustrate what ENVI-PV can provide to users, we propose the following applications:
1. Comparative environmental performance of a given PV system depending on the location
2. Comparative environmental performance of PV electricity production according to “current” and “prospective” techno-economic contexts with country electricity mixes
3. Comparative multi-criteria LCA of “current” and “prospective” techno-economic contexts
14 4.1. Comparative environmental performance of a given PV system depending on the location
The data visualization obtained with ENVI-PV ( http://viewer.webservice-energy.org/project_iea/) is presented in Figure 2 for the environmental performance of a current 3 kWp mono-Si PV laminate integrated in a slanted roof. A 30-year lifetime was assumed for the current scenario, following the recommendations of IEA PVPS Task 12 for mature technologies [20]. South orientation and 45° inclination were considered, since they are suitable conditions for PV energy production in the latitude of all the evaluated sites (north hemisphere locations). The 80% default value for the PR was used, according to average values reported by [39] and [40]. The LCA results are provided for the environmental impact category of climate change (analogous to the carbon footprint) based on the ILCD 2011 Midpoint + method. ILCD 2011 Midpoint + characterization method was selected as a representative method following the specific LCA methodological guidelines for the PV sector from IEA PVPS Task 12 and the European PEF recommendation [20, 38]. As shown in Figure 2, ENVI-PV allows the user to obtain direct comparisons between different installation sites that can be useful for the development of a PV project. Thus, the tool provides an intuitive representation of the environmental performance of a given PV system depending on the location. The locations with best environmental performances are indicated with green tone; the locations with higher environmental impacts correspond to the reddish area. Analogous maps can be obtained for 27 PV scenarios (including current and future techno-economic contexts) and 18 impact categories from 9 impact assessment methods, which result in 52 different environmental indicators available.
15 Figure 2. Worldwide map showing the evaluated sites and the climate change impacts for a 3 kWp
mono-Si laminate integrated in a slanted roof with a 30 years lifetime, oriented to the south, with a 45º inclination in the “current” techno-economic context
ENVI-PV also gives the numerical values for a given location by clicking on the map. The provided data can be directly copied or visualized in a new window by clicking on “export”. They include the geographical coordinates of the selected location (latitude and longitude), the yearly irradiation for the specified orientation and inclination angles, as well as the environmental impact of the laminate over the whole lifetime, the environmental performance (per kWh generated) of the PV system and of the corresponding country electricity mix.
16 4.2. Comparative environmental performance of PV electricity production according to “current” and “prospective” techno-economic contexts with country electricity mixes The net benefit of the PV system compared to the electricity mix is also provided by ENVI-PV as the ratio obtained according to equation 3 and expressed as a percentage.
et benefit of system relative to country electricity mix
nviron perf country mix nviron perf system nviron perf country mix (4) It should be noted that all the comparisons obtained by applying equation 4 are implemented in ENVI-PV according to the current country mixes. Although prospective electricity scenarios in 2050 were estimated for the main PV manufacturing countries to obtain the inventories of the prospective PV systems [17], there are no equivalent scenarios available for all the countries listed in Table S2 of Supporting Information. A comparison of all systems to current electricity mixes was preferred when developing ENVI-PV, in order to estimate the net benefit for as many countries as possible. Thus, the comparison shall be interpreted as the highest potential improvement of future PV systems with respect to current situation, instead of comparing future country mixes to future PV systems.
Figure 3 shows the graphs built upon results obtained from ENVI-PV for the electricity production by 3 kWp mono-Si laminates integrated in a slanted roof. The results allow the comparison of electricity production according to “current” and “prospective” techno-economic contexts with respect to current country electricity mixes for five countries. Two locations were selected for each country, so as to have a low PV electricity production site (as a result of a low yearly irradiation) and a high PV electricity production site (as a result of a high yearly irradiation). The locations are indicated in Figure 2 and Table 3. Six indicators of the ILCD 2011 Midpoint + method according to the guidelines from IEA PVPS Task 12 [20] were evaluated: climate
17 change, cumulative energy demand (CED, non-renewable), human toxicity (cancer effects), freshwater ecotoxicity, land use and particulate matter (respiratory effects).
Figure 3. nvironmental performances (impact/kWh of electricity generated) of “current” and
“prospective” mono-Si systems (lifetimes according to Table 2) for a 3 kWp mono-Si laminate integrated in a slanted roof; oriented to the south, with a 45° inclination compared to the current country electricity mix. Environmental indicators according to ILCD 2011 Midpoint + method [20]:
Climate change, Cumulative Energy Demand (CED, non-renewable), Human toxicity (cancer effects), Freshwater ecotoxicity, Land use and Particulate matter (respiratory effects)
18 Table 3. Geographical coordinates and irradiation data obtained by ENVI-PV for PV systems with
south orientation and 45° inclination placed in the selected locations
The trend of the comparative results depends significantly on the evaluated impact category. For environmental indicators such as CED (non-renewable), the environmental impact of the national electricity mix is remarkably higher than that of PV production by mono-Si systems, regardless of the analyzed country and techno-economic context. Thus, the net benefit of PV mono-Si systems, calculated according to equation 4, is above 80% for all the evaluated scenarios. For categories such as climate change, human toxicity and land use, the net benefit of PV systems depends on the site and techno-economic context. For example, the environmental impact on climate change and human toxicity (cancer effects) for electricity production by a current mono-Si laminate installed in site 1 of France (location in the north with low yearly irradiation) is only 3% lower than that of the country electricity mix, whereas it is 35% lower in site 2 (location in the south with solar irradiation 49% higher than that of site 1). In the case of land use, no net benefit is expected from current mono-Si laminates in site 1, where the PV system results in 1% higher impacts than the current country mix. The same technology has 32% lower land use than the country mix when considering
Country Location Latitude Longitude
Annual solar irradiation
(kWh/m2)
Difference of irradiation values of site 1 and 2 within each country (%)
France Site 1 48.49 -2.53 1223 40% Site 2 43.39 6.31 1829 Germany Site 1 54.16 13.06 1132 11% Site 2 48.47 10.47 1263 Japan Site 1 40.41 140.7 1326 10% Site 2 32.84 131 1463 Spain Site 1 43.53 -7.17 1412 29% Site 2 37.04 -2.87 1899 USA Site 1 47.64 -123.5 1334 41% Site 2 32.95 -104.3 2023
19 site 2. For locations in the US, the electricity from the national mix has a climate change impact about 90% higher than the electricity from the current PV system. The contributions to human toxicity and land use are between 70% and 80% higher for the country electricity mix than for the PV system. The results for the French case are related to the specific characteristics of the French country mix. This country mix has a high percentage of nuclear energy (75% of total supply) and low production from fossil fuels (9% of total supply), which results in low emissions of greenhouse gases and heavy metals. In the second case, the US mix strongly relies on fossil sources. They constitute approximately 56% of the total supply. In particular, coal and lignite involve 73% of total supply from fossil sources. This energy profile explains the high climate change, human toxicity and land use impact compared to PV systems. Additional data on the electricity supply mixes for the analyzed countries can be found in the Supporting Information.
For other categories such as freshwater ecotoxicity or particulate matter (respiratory effects), PV scenarios result in higher environmental impacts than the national electricity mix for several countries and scenarios. In particular, electricity from current mono-Si laminates has an environmental impact between 1.2 and 3 times higher than the country mix in France, Germany and site 1 in Spain. BAU scenario has higher impact on freshwater ecotoxicity than the country mix for the same sites, whereas REAL scenario exceeds the contribution of the country electricity mix for France and Germany. The main subsystem responsible for the high impacts of PV electricity on freshwater ecotoxicity is the disposal phase at the end-of-life of the installation, associated with high emissions of heavy metals. Regarding the category of particulate matter, most of the future techno-economic contexts result in net benefits with respect to the country electricity mixes, except for BAU production scenario in the case of
20 France. The main contribution of PV systems to this impact category is related to the raw materials for the wafer manufacturing.
Concerning the geographical dependence of the environmental performance of a given PV system within a single country, it can be analyzed by comparing the two sites that were selected as limit production conditions. The environmental performances obtained for the two representative sites of each country differ within the country in a range from 9% (for the two sites in Japan) up to 34% (for the two sites in US). France and the US are the countries with the highest differences between site 1 and site 2. This is due to the high variability of the annual solar irradiation, shown in Table 3, depending on the site for these two countries. The yearly irradiation determines the total energy production over the expected production period. When comparing all the sites, French site 1 and German site 2 present the lowest deviation between each other (3% difference for the two environmental performances). The small difference in the environmental performance of the two sites is due to the similarity of their irradiation conditions. Regarding the greatest difference between locations, site 1 in Germany is the location with the highest impact per kWh produced, whereas site 2 in the US is the location with the lowest impact. These maximum and minimum values present a 44% difference. 4.3. Comparative multi-criteria LCA for “current” and “prospective” techno-economic contexts
As mentioned above, the effect of the techno-economic context on the environmental results can also be evaluated with ENVI-PV, as depicted in Figure 3. Figure 4 reports the environmental performance of the mono-Si current and prospective scenarios but with a multi-criteria representation: climate change, non-renewable CED, human toxicity (cancer effects), freshwater ecotoxicity, land use and particulate matter (respiratory effects). In a radar chart, the relative performance of a scenario B is
21 calculated with respect to a scenario A (which is set as the scenario with a relative environmental performance of 100%) according to the following equation:
elative environ performance of
( )
is a constant ratio that does not depend on the site. The ratio of the energy production for the two scenarios can be expressed, by considering equation 2, as:
peak
ystlife oss ratio
peak
ystlife oss ratio
( )
Since the same assumptions regarding the orientation and inclination were considered for all scenarios, the yearly irradiation for each site does not depend on the technology and thus rradiation
rradiation . Hence, under the assumptions that were considered in this study,
equation 5 results in the same relative environmental performance for a given prospective scenario with respect to the current mono-Si scenario, regardless of the installation site.
According to Figure 4, the results show similar trends compared to the environmental performance reported by IEA [17]. Thus, the BAU context may lead to impact reductions of 46% for climate change, 43% for the cumulative energy demand, 29% for human toxicity, 4% for freshwater ecotoxicity, 34% for land use and 48% for particulate matter. The REAL scenario (which considers a lifetime of 35 years instead of 30 years for the laminates) would result in improvements between 25% (for freshwater ecotoxicity) and 84% (for particulate matter), whereas the OPT scenario (40 years lifetime for the laminates) would involve impact reductions between 38% and 93%.
22 Figure 4. Radar chart for the comparative evaluation of the environmental performance of 3 kWp
mono-Si laminates depending on the techno-economic context (results obtained for south orientation and 45° inclination) according to 6 environmental indicators from ILCD Midpoint + method [20]
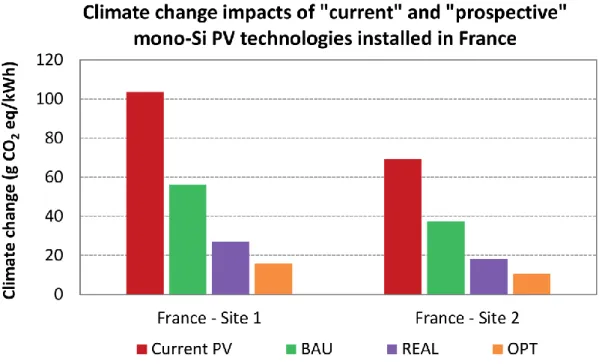
Although the impact reduction associated with prospective scenarios is the same for all sites in relative terms, the absolute environmental effects vary significantly from one site to another. Figure 5 illustrates the difference with an example that shows the environmental performances with respect to climate change for all 3 kWp mono-Si systems installed in site 1 or site 2 in France. In this example, site 2 has a yearly irradiation nearly 50% higher than that of site 1. As a result, nearly 50% more electricity can be generated in French site 2, which reduces the greenhouse gases emitted per kWh generated. Regardless of the site, the current scenario has between 1.5 and 2 times higher emissions than the prospective scenarios installed in the same location. For the case of France, each PV system has 33% lower emissions when installed in site 2 than
23 when installed in site 1. Due to the different electricity generation from one site to another, a PV system characterized by a high total impact can have an environmental performance comparable or at least closer to that of another PV system with lower total impact if it is installed in a different site. Thus, current 3 kWp mono-Si laminates installed in site 1 in France have 85% more emissions contributing to climate change than BAU scenario in the same site, whereas the current laminate installed in site 2 has only 24% higher emissions than BAU laminate in site 1. Similar trends are observed for REAL and OPT scenarios. Consequently, the development of future mono-Si systems may allow reductions from approximately 100 g CO2 eq/kWh to less than 20 g CO2 eq/kWh for the OPT scenario in site 1, given a total reduction of 80 g CO2 eq/kWh. The range of reduction in site 2 is limited to approximately 60 g CO2 eq/kWh, which is the difference between 70 g CO2 eq/kWh for the current scenario and 10 g CO2 eq/kWh for the OPT scenario.
Figure 5. Comparative evaluation of the environmental performance in absolute terms of “current”
and “prospective” kWp mono-Si laminates (results obtained for south orientation and 45° inclinations in the two sites in France) for the impact category Climate change of ILCD Midpoint +
24 4.4. Comparative multi-criteria LCA of “current” available technologies
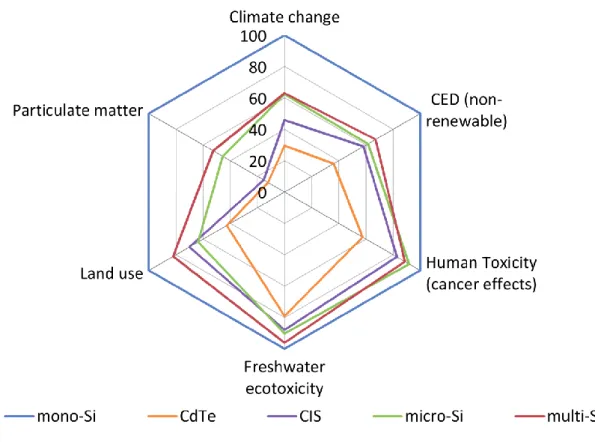
Since ENVI-PV includes several common PV technologies, the tool also offers the possibility to compare their environmental performance in the current context. Figure 6 illustrates this potential use for 3 kWp laminates, for which five different technologies are available: CdTe, CIS, micro-Si, mono-Si or multi-Si. As in the case of current and future techno-economic contexts, relative environmental performances for the different technologies compared in Figure 6 are independent of the location. The demonstration is analogous, since equations 5 and 6 are also applied to obtain the comparison. Since the same assumptions for the orientation and inclination were considered in this study for all the current technologies, the ratio of irradiation for technologies A and B is again equal to 1. According to the values obtained with ENVI-PV, CdTe laminates would be the most efficient from an environmental perspective, with an impact between 30% and 70% lower than other technologies. The CIS system may also have significant environmental benefits compared to silicon technologies such as micro-Si and multi-Si, whereas mono-Si laminates exhibit the highest environmental impacts among the evaluated options. The differences between the results depend not only on the PV technology but also on the considered impact category. Among the categories presented in Figure 7, particulate matter has the highest difference between the technologies with the lowest and the highest environmental impacts, whereas freshwater ecotoxicity shows the smallest variation. The main reason for the different spread in the results depending on the impact category is the share of the common components (inverter, electric installation, mounting structure) of each PV system in the total environmental impacts. For example, the freshwater ecotoxicity impacts are mainly influenced by copper production, which is predominantly used in the inverter and the electric installation. Since they are common elements, the five PV technologies do not differ
25 significantly according to this indicator. On the contrary, the particulate matter emissions of the mono-Si PV system are mainly caused by electricity generation in coal power plants in China. The electricity is used in the supply chain of the mono-Si PV module. In contrast, the major part of the particulate matter emissions of the CdTe PV system is caused by the production of copper (inverter, electric installation), aluminum (mounting structure) and flat glass (PV module). These components are used in every PV system, whereas the production of the PV module itself only adds a minor contribution to the total emissions for the category.
Figure 6. Radar chart for the comparative evaluation of the environmental performance of 3 kWp
laminates of different technologies available in ENVI-PV: CdTe, CIS, micro-Si, mono-Si and multi-Si (results obtained for south orientation and 45° inclination) according to 6 environmental
26 Figure 7. Comparative evaluation of the environmental performance in absolute terms of 3 kWp
mono-Si laminates of CdTe, CIS, micro-Si, mono-Si and multi-Si technologies (results obtained for south orientation and 45° inclinations in the two sites in France) for the impact category Climate
change of ILCD Midpoint + method [20]
The environmental effect in absolute terms of substituting a PV technology with high impact by a lower impact technology can be observed in Figure 7 for the example of climate change. Again, as in the case of different techno-economic contexts, the potential environmental benefits of lower impact technologies may be more or less significant in absolute terms depending on the installation site. Thus, micro- and multi-Si laminates allow reducing the greenhouse gas emissions from more than 100 g CO2 eq/kWh to nearly 60 g CO2 eq/kWh in site 1. CdTe and CIS systems installed in the same site result in environmental performances of 31 and 48 g CO2 eq/kWh, respectively. Mono-Si laminates installed in site 2 have an environmental performance of 69 g CO2 eq/kWh, which is close to the performance of micro- and multi-Si in site 1. The environmental performance of mono-Si laminates in site 2 can only be improved to
27 40 g CO2 eq/kWh approximately for micro- and multi-Si systems, 32 g CO2 eq/kWh for CIS system and 20 g CO2 eq/kWh. According to these results, it may be more interesting from a combined economic and environmental point of view to invest in non-silicon-based technologies in sites with low irradiations, since their potential improvement is higher in absolute terms. For sites with high irradiation, the high electricity generation potential seems to compensate higher total impacts, so silicon-based technologies may be suitable.
5. Limitations of ENVI-PV current version
It should be noted that the comparison between the different PV scenarios has to be carefully interpreted. ENVI-PV results rely on the STC condition. The PV efficiency gaps due to inherent deviations from STC are only taken into account within the PR. The PR is not defined with respect to the chosen PV technology and the local conditions, but is a free parameter. Thus, the user can increase or decrease the PR value for a given PV system and local condition according to their own knowledge and the available literature [39, 40].
Providing screening level results based on average production instead of site-specific supply chains increases the uncertainty level, which is not analyzed in this tool. The main purpose of ENVI-PV is offering the user the PV environmental performance within different countries based on average inventories rather than precise values for specific manufacturing sites. Hence, the uncertainty of ENVI-PV results is not included in the current version of the tool yet. Future improvements will focus on the addition of uncertainty of the obtained LCA results linked to the choices and assumptions for the life cycle inventories. The comparison between PV environmental performances and country electricity mixes will benefit from this uncertainty assessment, helping the user to decide whether the differences between both sources are relevant or not. Moreover,
28 the implementation of modular inventories will increase the accuracy of the LCA results by separately modeling each life cycle subsystem. This improvement will also allow analyzing the environmental effect of different manufacturing locations. Such modular inventories based on country specific markets may come either from future progress within IEA PVPS Task 12 or from other existing databases, such as Ecoinvent v3 [42].
5. Conclusions and perspectives
The interactive tool ENVI-PV, developed using an interoperable and open standard Web Service framework from the OGC, is the first tool to propose a worldwide coverage of environmental performance of PV systems. It combines the latest life cycle inventories, published in 2015 by the IEA Task 12, and the solar irradiation database computed from the worldwide NASA SSE database for 18 inclinations and 3 orientations. Although the number of evaluated impact categories is restricted to six for simplicity in the provided examples, the impact categories implemented in ENVI-PV cover 18 environmental issues. This multi-criteria approach is in line with current environmental policies, including the European PEF recommendation [38], and may contribute to the optimization of PV systems based on environmental criteria.
The Web Client can be used as a tool to generate a representative number of 27 alternative PV scenarios and evaluate PV performance in different spatial and temporal contexts. Providing comparisons of the PV performance to the performance of the corresponding national electricity mix enhances the understanding to position PV relying on a multi-criteria assessment.
This first version of ENVI-PV provides results at screening level. The aim is offering the user a general overview of average PV technologies installed in locations worldwide rather than accurate environmental performances for each specific case study. Improvements on this tool should focus on the implementation of modular inventories.
29 Modeling the different sub-systems separately would allow evaluating the individual contribution of each phase of the life cycle as well as the environmental effect of the spatial localization for specific manufacturing sites. Another key issue to be included in future versions is the uncertainty level of ENVI-PV results, linked to the implemented life cycle inventories.
Open access to this key information is essential to feed the debate on energy transition. Being interoperable and compliant with open standards enables ENVI-PV to be included in future developments and exploit this first initiative within LCA for energy pathways. Moreover, the same principles and architecture can be applied to other renewable energy systems. As an example, a similar tool was developed for offshore wind farms within the EU project EnerGEO [43], and analogous Web Services may be created in the future to evaluate other systems such as on-shore wind or marine energy sources.
Acknowledgements This research has been undertaken within the framework and
financial support of the International Energy Agency in the framework of Task 12 of the Photovoltaic Power Systems Program (PVPS), as well as with the financial support provided by ADEME (France) under contract No. 1505C008 and by the Swiss Federal Office of Energy (SFOE) under contract No. SI/500738.
References
[1] International Energy Agency (IEA). Renewable Energy: Medium-term market report 2015. OECD/IEA. Paris (France), 2015.
[2] International Energy Agency (IEA). Technology roadmap: Solar photovoltaic energy. Technical Report, 2014a.
30 [3] IEA. Energy Technology Perspectives 2014. OECD/IEA. Paris (France), 2014b. [4] Raugei M, Frankl P. Life cycle impacts and costs of photovoltaic systems: Current
state of the art and future outlooks. Energy 2009; 34(3): 392-399.
[5] Beylot A, Payet J, Puech C, Adra N, Jacquin P, Blanc I, Beloin-Saint-Pierre D. Environmental impacts of large-scale grid-connected ground-mounted PV installations. Renewable Energy 2014; 61: 2-6.
[6] Jungbluth N. Life cycle assessment of crystalline photovoltaics in the Swiss ecoinvent database. Progress in Photovoltaics: Research and Applications 2005;
13: 429-446.
[7] Nugent D, Sovacool BK. Assessing the lifecycle greenhouse gas emissions from solar PV and wind energy: A critical meta-survey. Energy Policy 2014; 65: 229-244.
[8] Wild-Scholten MJ de. Energy payback time and carbon footprint of commercial photovoltaic systems. Solar Energy Materials & Solar Cells 2013; 119: 296-305. [9] Tsang MP, Sonnemann GW, Bassani DM. A comparative human health,
ecotoxicity, and product environmental assessment on the production of organic and silicon solar cells. Progress in Photovoltaics: Research and Applications 2016;
24(5): 645-655.
[10] Fthenakis V, Mason JE, Zweibel K. The technical, geographical, and economic feasibility for solar energy to supply the energy needs of the US. Energy Policy 2009; 37(2): 387-399.
[11] Ménard L, Blanc I, Beloin-Saint-Pierre D, Gschwind B, Wald L, Blanc P, Ranchin T, Hischier R, Grianfranceschi S, Smolders S, Gilles M, Grassin C. Benefit of GEOSS interoperability in assessment of environmental impacts illustrated by the
31 case of photovoltaic systems. IEEE Journal of Selected Topics in Applied Earth Observations and Remote Sensing 2012; 5: 1722-1728.
[12] Ito M, Lespinats S, Merten J, Malbranche P, Kurokawa K. Life cycle assessment and cost analaysis of very large-scale PV systems and suitable locations in the world. Progress in Photovoltaics: Research and Applications 2016; 24(2): 159-174. [13] Demirkan H, Delen D. Leveraging the capabilities of service-oriented decision support systems: Putting analytics and big data in cloud. Decision Support Systems 2013; 55(1): 412-421.
[14] Arán Carrión J, Espín Estrella A, Aznar Dols F, Zamorano Toro M, Rodríguez M, Ramos Ridao A. Environmental decision-support systems for evaluating the carrying capacity of land areas: Optimal site selection for grid-connected photovoltaic power plants. Renewable and Sustainable Energy Reviews 2008;
12(9):2358-2380.
[15] Wender BA, Foley RW, Prado-Lopez V, Ravikumar D, Eisenberg DA, Hottle TA, Sadowski J, Flanagan WP, Fisher A, Lauring L, Bates ME, Linkov L, Seager TP, Fraser MP, Guston DH. Illustrating anticipatory Life Cycle Assessment for emerging photovoltaic technologies. Environmental Science & Technology 2014;
48: 10531-10538.
[16] Marini, C., Blanc, I., Sinha, P., Wade, A., 2014. A prospective mapping of environmental impacts of large scale photovoltaic ground mounted systems based on the CdTe technology at 2050 time horizon. 29th European Photovoltaic Solar Energy Conference and Exhibition, Sep. 2014, Amsterdam (The Netherlands), pp. 3349-3398. ISBN: 3-936338-34-5.
[17] Frischknecht R, Itten R, Wyss F, Blanc I, Heath G, Raugei M, Sinha P, Wade A. Life cycle assessment of future photovoltaic electricity production from
residential-32 scale systems operated in Europe. International Energy Agency (IEA), 2014. PVPS Task 12, Report T12-05-2015.
[18] Frischknecht R, Itten R, Sinha P, de Wild-Scholten M, Zhang J, Fthenakis V, Kim HC, Raugei M, Stucki M. Life cycle inventories and life cycle assessment of photovoltaic systems. International Energy Agency (IEA), 2015. PVPS Task 12, Report T12-04:2015.
[19] Jungbluth N, Tuchschmid M. Photovoltaics. In Dones, R. (Ed.) et al., Sachbilanzen von Energiesystemen: Grundlagen für den ökologischen Vergleich von Energiesystemen und den Einbezug von Energiesystemen in Ökobilanzen für die Schweiz. Ecoinvent report No. 6-XII, Swiss Center for Life Cycle Inventories, Dübendorf (Switzerland), 2007.
[20] Frischknecht R, Heath G, Raugei M, Sinha P, de Wild-Scholten M, Fthenakis V, Kim HC, Alsema E, Held M. Methodology guidelines on Life Cycle Assessment of photovoltaic electricity, 3rd edition, IEA PVPS Task 12, International Energy Agency Photovoltaic Power systems Programme, 2016. Report IEA-PVPS T12-06:2016.
[21] Frischknecht R, Jungbluth N, Althaus HJ, Bauer C, Doka G, Dones R, Hischier R, Hellweg S, Humbert S, Köllner T, Loerincik Y, Margni M, Nemecek T. Implementation of life cycle impact assessment methods. Ecoinvent report No. 3, v2.0. Swiss Centre for Life Cycle Inventories, Dübendorf (Switzerland), 2007. [22] IPCC. Climate Change 2013: The physical science basis. Contribution of working
group I to the fifth assessment report of the Intergovernmental Panel on Climate Change. Stocker TF, Qin D, Plattner GK, Tignor M, Allen SK, Boschung J, Nauels A, Xia Y, Bex V, Midgley PM. (eds.). Cambridge University Press, Cambridge (United Kingdom) and New York (NY, USA), pp. 1535, 2013.
33 [23] Jolliet O, Margni M, Charles R, Humbert S, Payet J, Rebitzer G, Rosenbaum R. IMPACT 2002+: A new life cycle impact assessment methodology. The International Journal of Life Cycle Assessment 2003; 8(6): 324-330.
[24] USEtox, 2010. USEtox version 1.01. Available: http://www.usetox.org/ (accessed: 26 September 2016).
[25] Itten R, Frischknecht R, Stuck M. Life cycle inventories of electricity mixes and grid. Version 1.3. Treeze Ltd., Uster (Switzerland), 2014.
[26] Alonso G, Casati F, Kuno H, Machiraju V. Web Servicies. In: Web services: Concepts, architectures and applications. Data-Centric Systems and Applications Series. Carey MJ, Ceri S (eds.). Springer Verlag Berlin Heidelberg, pp. 123-149, 2004.
[27] W3C. Web Services Glossary. W3C Working Group Note. Available: https://www.w3.org/TR/ws-gloss/ (accessed 27 September 2016).
[28] Lewine DA. Method for performing transactions on the world-wide web computer network. US 6230202 B1, 2001.
[29] Stackhouse PW, Whitlock CH. (eds.). Surface meteorology and Solar Energy (SSE) Release 6.0 Methodology, version 3.1.2, NASA, pp. 62, 2014. Available: https://eosweb.larc.nasa.gov/sse/documents/SSE6Methodology.pdf (accessed: 28 September 2016).
[30] European Commission, Directorate-General for Research. External costs. research results on socio-environmental damages due to electricity and transport, 2003. Available: http://ec.europa.eu/research/energy/pdf/externe_en.pdf (accessed 27 September 2016).
[31] Troldborg M, Heslop S, Hough RL. Assessing the sustainability of renewable energy technologies using multi-criteria analysis: Suitability of approach for
34 national-scale assessments and associated uncertainties. Renewable and Sustainable Energy Reviews 2014; 39: 1173-1184.
[32] Fthenakis VM, Kim HC. Photovoltaics: Life-cycle analyses. Solar Energy 2011;
85(8): 1609-1628.
[33] ISO 14040:2006. Environmental management – Life cycle assessment – Principles and framework, 2006.
[34] ISO 14044:2006. Environmental management – Life cycle assessment – Requirements and guidelines, 2006.
[35] European Commission. Communication from the Commission to the Council and the European Parliament. Integrated Product Policy - Building on Environmental Life-Cycle Thinking. Brussels, 18.6.2003, COM(2003) 302 final, 2003. Available: http://eur-lex.europa.eu/ homepage.html (accessed: 28 September 2016).
[36] Beloin-Saint-Pierre D, Blanc I, Payet J, Jacquin P, Adra N, Mayer D. Environmental impact of PV systems: Effects of energy sources used in production of solar panels. In: Proceedings of the 24rd European Photovoltaic Solar Energy Conference, 21-25 September 2009, Hamburg, Germany. ISBN 3-936338-25-6, pp. 4517-4520.
[37] FHI-ISE. Photovoltaics report 2013. Fraunhofer Institute (FHI) for Solar Energy Systems (ISE), Freiburg, Germany, 2013.
[38] European Commission. Commission Recommendation of 9 April 2013 on the use of common methods to measure and communicate the life cycle environmental performance of products and organisations. Official Journal of the European Union L 124, 4.5.2013, pp. 1/210.
35 [39] Van Sark WGJHM, Reich NH, Müller B, Armbruster A, Kiefer K, Reise C. Review of performance ratio development. World Renewable Energy Forum Proceedings, 13-17 May 2012, Denver, Colorado. ISBN 978-1-938547-04-1. [40] Leloux J, Narvarte L, Trebosc D. Review of the performance of residential PV
systems in France. Renewable and Sustainable Energy Reviews 2012; 16: 1369-1376.
[41] Frischknecht R, Faist Emmenegger M, Steiner R, Tuchschmid M, Gärtner S. LCA of background processes. In: NEEDS Project, deliverable 15.1. ESU-services and ifeu, Uster and Heidelberg, 2008. Available: http://www.needs-project.org/. (accessed: 27 September 2016).
[42] Ecoinvent Database, 2016. Available online: http://www.ecoinvent.org/ (accessed on 28 Septembre 2016).
[43] Guermont C, Ménard L, Gschwind B, Blanc I, Ranchin T. Environmental impact for offshore wind farms: Geolocalized Life Cycle Assessment (LCA) approach. Conference on Ocean & Coastal Observation: Sensors and observing systems, numerical models & information Systems – OCOSS 2013, 28-31 October 2013, Nice, France, pp. 137-142.
![Table 1. Regions of PV panel manufacturers per technology according to IEA PVPS Task 12 [17]](https://thumb-eu.123doks.com/thumbv2/123doknet/12574266.346158/8.892.199.693.633.983/table-regions-panel-manufacturers-technology-according-pvps-task.webp)