DETERMINATION OF DRY SLUDGE HOLD-UP IN A
CONTINUOUS PADDLE DRYER
M. Milhé, M. Sauceau, P. Arlabosse*
Université de Toulouse; Mines Albi; CNRS ; Centre RAPSODEE
Campus Jarlard, F-81013 Albi, France
*Corresponding author:
patricia.arlabosse@mines-albi.fr
Abstract
In previous works, solids hold-up proved to be the most influential parameter of a stochastic flow model of a continuous paddle dryer: we thus aimed at correlating it with operating parameters. A fractional factorial Design of Experiments (DoE) was implemented, in which dryer slope, stirrer speed, overflow level and sludge flow rate were initially selected as factors. The DoE was then completed after reducing the number of influent parameters and their interactions, using surface response methodology (RSM), to get a predictive relationship for solids hold-up determination.
Keywords: Paddle dryer; Design of experiments; Solids hold-up; Empirical correlation; Stochastic flow.
INTRODUCTION
Sewage sludge (SS) management is a matter of growing importance as its production keeps increasing with population growth and legislation restrictions. Storage and hygiene issues, as well as agricultural landfilling limitation, contribute to make drying a necessary step in sewage sludge treatment and valorization [1]. However, SS is a product quite difficult to handle, as it undergoes a transition to a pasty state during its drying [2]: this is potentially damageable for industrial dryers where moving equipment is involved. For this reason, paddle dryers are recognized as well adapted tool for SS drying: thanks to the wedge-shaped paddles, continuous mixing of the product is realized and in situ clogging is avoided. Moreover, this kind of indirect dryer offers the advantages of compactness and low exhaust volumes. In spite of the important number of installations functioning at an industrial scale, design and operation of paddle dryers mostly rely on manufacturers’ know-how [3]. Few studies focused on the description of sludge drying in paddle dryers in continuous operation: while Arlabosse et al. described drying kinetics along an industrial scale installation with a simple empirical model assuming plug flow of sludge [3], Tazaki et al. highlighted the importance of back-mixing in such installations via a Residence Time Distribution (RTD) study [4].
More recently, Charlou et al. developed a methodology for measuring experimental RTD with a good repeatability in a pilot-scale installation [5]. This lead us to two major conclusions: this RTD can be described by a Markov chain, where each paddle separates continuous perfectly stirred tank reactors [6]; dry sludge (referred to as “solids” in the following) is the most influential parameter of such a model. By fitting the model to experimental data, it appeared that the experimentally measured solids hold-up was close to the one obtained through model optimization. In this framework, it is thus interesting to relate the solids hold-up to operating conditions, so that it would become a predicted parameter and not one to be determined through optimization of experimental data. We thus oriented our work towards a Design of Experiments (DoE), which allows determining the influence of chosen parameters on a specific measured variable with a minimum of well-chosen experiments. The first part of this study consists in a fractional
factorial design, an efficient tool for testing the most influential parameters. Then, a composite centered design focused on these parameters allows establishing the wanted correlation with a good accuracy on the experimental domain studied.
MATERIAL AND METHODS
Sludge characteristics
The sludge used in this study comes from the Albi city WWTP. Wastewater from 60000 population equivalent is treated via a prolonged aeration step including nitrates and phosphates abatement; biological sludge is then dewatered thanks to the addition of a cationic flocculating polymer before being sent to an anaerobic digestion process for three weeks. The resulting sludge is again flocculated and mechanically dewatered in centrifuges, which allow reaching dry contents around 20 to 22%. The results presented in this study were obtained with sludge sampled over a period of three months during which no change in the operating conditions of the WWTP was reported. Sludge was stored in air-tight containers in a cold room at +4°C for at least two days before each experiment in order to stabilize it, and was not kept for more than two weeks.
Paddle dryer description
Experiments were conducted on a continuous pilot-scale paddle dryer (Figure 1): it is composed of a 1 meter long U-shaped jacketed trough housing a shaft equipped with 18 regularly spaced wedge-shaped paddles; scrapers are situated between the paddles in order to increase mixing and avoid crust formation on their surface. Both the jacket and the shaft are electrically heated in three separate zones, with regulation thermocouples placed near the stainless steel surface. Three traps situated on top of the trough allow sampling of drying sludge during or after the experiments; these traps as well as the trough are insulated with 5-cm thick rock wool to avoid heat losses. Sludge and sweeping gas are injected from one end of the trough, above the paddles; sweeping gas can be either nitrogen or superheated steam, which was used in this study. Exhaust gases are entrained from the other end of the pilot through an activated carbon filter before being released outside.
Sludge is fed from a 40l hopper by means of a progressive cavity pump which flow rate Q can be accurately controlled. Dried sludge is discharged above an overflow which height H can be varied from the shaft to the top of the paddles. The whole installation slope θ can be varied between 0 and +5° and rotational speed of the shaft N can also be varied.
Superheated steaam Raw sludge Slope Overflow Dried sludge Superheated steam Zone 1 Zone 2 Zone 3
Experimental procedure
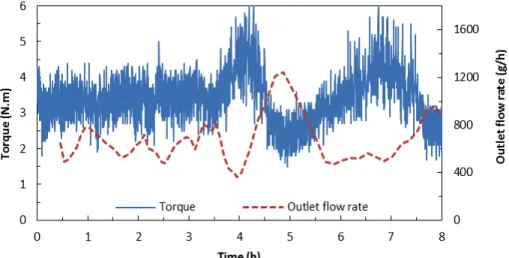
The installation is equipped with different sensors allowing recording temperatures and electrical power along the dryer, torque applied by the motor as well as mass of dried sludge at the outlet. This monitoring can help knowing whether a steady state operation has been reached. Indeed, reaching a steady state during SS drying experiments is not straightforward: one cannot only rely on sludge outlet flow, since its water content can vary during transitory periods. Moreover, water content measurement requires several hours at least (24h at 105°C according to the norm NF EN 15934). We could overcome this issue by monitoring continuously the torque applied by the stirrer along with the mass at the outlet. Figure 2 illustrates the relationship between torque and sludge flow rate at the outlet of the dryer (averaged on 30 min periods): after a period of stability, an increase in torque value is accompanied by a decrease in average flow rate and conversely. This indicates that an accumulation of sludge occurred, followed by a partial purge of the material in the reactor. Such behavior is uneasy to anticipate and to explain, but is probably linked to the stickiness of the sludge during drying [2]. In order to ensure that the remaining sludge in the dryer corresponds to that of a steady-state operation, we waited for the torque and outlet flow rate to be stable for at least 2 h. Once a steady-state operation was achieved, sludge feed was stopped and the outlet was closed in order to isolate the solids in the dryer.
Figure 2: Evolution of outlet flow rate and torque during drying experiments
Design of Experiments
The experimental procedure described previously is very time-consuming, because of long periods for heat up and cooling down of the installation, and because of slow evolutions towards a steady-state operation. For this reason, we chose to work according to DoE, which allows optimizing the number of experiments to realize for a given number of parameters. The first part consists in a fractional design that, with reasonable hypotheses, allows studying the influences of 4 parameters and their interactions with only 8 experiments; this avoids the possibility of a bias linked to changes in sludge properties at the WWTP, since we worked with a single batch of SS for the 8 experiments.
This factorial design only gives access to a first degree multi-linear relation between the response and the parameters; in order to improve the precision of the correlation, the DoE can be extended to a composite centered one, in which the experimental domain is enlarged. This new DoE, also called response surface methodology, is often used for optimization purposes, since the response is expressed in function of squared expressions of the parameters.
RESULTS AND DISCUSSION
Initial design: fractional factorial design with 4 parameters
We chose four independent parameters for this preliminary study: apart from H and θ which influence on solids hold-up is easily suspected, our objective was to verify whether N and Q or their interaction was influencing the solids hold-up. Drying temperature and sweeping gas flow rate or temperature were not thought to be influent. The origin and initial water content of the sludge are not in the frame of this study. Parameters values for the DoE are listed in Table 1, in absolute and coded values, along with the corresponding measured solids hold-up. In this table, each experiment can be considered as an equation: solving this set of equations gives access to 8 coefficients corresponding to 8 variables (the parameters or their interactions) describing the response (the hold-up).
Table 1: Overview of operating conditions and measured responses for the fractional factorial design
Experiment Overflow H (mm) Slope θ (°) Stirring speed N (rpm) Sludge flow
rate Q (g/h) Coded values Hold-up (g)
1 20 2 21 2000 -1 -1 -1 -1 1225.1 2 20 2 42 4000 -1 -1 +1 +1 1492.6 3 20 4 42 2000 -1 +1 +1 -1 828.2 4 20 4 21 4000 -1 +1 -1 +1 789.6 5 46 2 42 2000 +1 -1 +1 -1 3018.6 6 46 2 21 4000 +1 -1 -1 +1 3170.1 7 46 4 21 2000 +1 +1 -1 -1 1330.2 8 46 4 42 4000 +1 +1 +1 +1 1244.3
In this preliminary design, 4 parameters are considered: if we want to study the effect of all parameters and their interactions, we would need 16 experiments. The hypothesis that 2nd and 3rd order interactions can be neglected is generally made, which reduces the number of unknowns to 11 in our case. We then build a matrix of experiments in which all the 1st order interactions are aliased, i.e. their influence on the response are confounded. Depending on the DoE results, some interactions can further be neglected and the corresponding coefficient can be considered that of a single interaction. In our case, the DoE gives access to the following correlation, where Hu is the dry solids hold-up in the dryer:
3 3 2 2 3 1 1 2 1 4 3 2 1 0 bH b b N b Q b A b A b A b Hu= + + θ+ + + − + − + − (1)
In equation 1, A1, A2 and A3 represent the aliased 1st order interaction terms. In our case, A1 stands for the
confounded effect of H*θ and N*Q, A2 for H*N and θ*Q, and A3 for H*Q and θ*N. The constant term and
main parameters are actually aliased with 3rd and 2nd order interaction terms respectively, but these are most of the time neglected. General rules for management of aliases in DoE can be found in [7].
Several DoE software give access to statistical treatment of these results, in this study we worked with
Nemrodw©. Figure 3 illustrates the values of the coefficients in equation 1, excepted for the constant term
b0 which value is 1637.3. We can see that H and θ have the greatest coefficients, i.e. their influence is
strongest on the response; moreover, this influence is statistically significant at a 95% confidence level, as expressed by the vertical dash-dotted lines; this is easily related to physical effects, as an increase in overflow level results in an increase in the volume available for sludge in the dryer, while an increase in dryer slope will decrease this volume. N and Q influences prove to be largely non-significant on the contrary.
Figure 3: Main factors and interactions effect
Concerning interactions terms, a general rule is that a non-influent parameter will not yield significant interactions with other parameters. In our case, the only significant interaction possible is thus H*θ, so we can consider that the coefficient b1-2 is actually the coefficient for this particular interaction (and not for
the alias). This interaction between H and θ is illustrated in Figure 4, where we can see that the variation of hold-up with H is not the same depending on θ value, and conversely.
Figure 4: Graphical representation of the interaction between H and θ
Based on these results, we can simplify the problem by considering only two parameters, H and θ, and their interaction: the hold-up can thus be described by equation 2.
θ θ b H b H b b Hu= 0 + 1 + 2 + 1−2 (2)
The coefficients and their statistical significance are listed in Table 2. These values were obtained by considering the previous DoE as full factorial design with each experiment repeated once: the standard error on the estimated hold-up is 113.7 g and the adjusted regression coefficient R²a is 0.985.
Table 2: Coefficients for the first order correlation (equation 2)
b0 b1 b2 b1-2
Coefficient 1637.3 553.5 -589.3 -314.3
Student t 40.74 13.77 -14.66 -7.82
This correlation appears satisfactory from the statistics point of view; moreover, the obtained coefficients describe well the behavior of the dryer. However, the experimental domain defined in Table 1 is relatively narrow, and it is probable that the influence of θ is not linear. These two issues can be addressed by completing the current DoE, turning it into a circumscribed central composite (CCC) design.
Circumscribed central composite design with 2 parameters
This type of DoE is generally employed for optimization of operating conditions or maximization of response problems. It allows describing the response by a 2nd order correlation on the parameters, as in
equation 3 for our situation.
2 2 2 2 2 1 2 1 2 1 0 bH b θ b Hθ b H b θ b Hu= + + + − + + (3)
The CCC DoE is summed up in Table 3: for the 4 first experiments, we considered that the hold-up was the mean of the two experiments corresponding in the first DoE; two central points were realized (experiments 9 and 10).
Table 3: Overview of operating conditions and measured responses for the CCC design
Experiment Overflow H (mm) Slope θ (°) Coded values Hold-up (g)
1 100 2 -1 -1 1358.9 2 100 4 -1 +1 808.9 3 126 2 +1 -1 3094.4 4 126 4 +1 +1 1287.3 5 95 3 -1.414 0 920.2 6 131 3 +1.414 0 1891.4 7 113 1.6 0 -1.414 2082.3 8 113 4.4 0 +1.414 841.5 9 113 3 0 0 902.7 10 113 3 0 0 883.3
The coefficients corresponding to equation 3 estimated for this DoE are summed up in Table 4. The standard error on the estimated hold-up is 13.7 g, and the adjusted regression coefficient R²a is 0.902. This
correlation offers an overall good description of solids hold-up, even though the significance of coefficients is a bit lower than the previous one, with p-values comprised between 0.6 and 1.4 % at the 95 % confidence level.
Table 4: List of the coefficients for the second order correlation (equation 3)
b0 b1 b2 b1-2 b12 b2²
Coefficient 893 448.4 -514.0 -314.3 307.3 335.3
Student t 92.06 92.46 -105.98 -45.82 47.89 52.27
p-value 0.69 % 0.69 % 0.60 % 1.39 % 1.33 % 1.22 %
The distribution of the error realized by using the correlation of equation 3 on all the experiments realized for this study is illustrated in Figure 5: the error is regularly distributed around 0, but it often reaches more than 10 %.
Figure 5: Overall error on estimation on solids hold-up by equation 3
Final water content vs. geometric residence time
As already stated, the solids hold-up is a determining parameter for performance of paddle dryers. Indeed, the residence time of the sludge seems to be of paramount importance when considering the dry solids content at the outlet of the installation. Geometric residence time of dry solids τD in the dryer can be
calculated according to equation 4, where Hu is the dry solids hold-up and QDS the dry solids flow rate in
the dryer.
DS D =HuQ
τ (4)
The relation between τD and sludge dry solids content at the outlet of the dryer is illustrated in Figure 6:
we can see that this relation is almost linear up to 95% dry solids content, highlighting the importance of the solids hold-up in paddle dryers.
Figure 6: Evolution of dry solids content with dry solids residence time in the paddle dryer
An empirical correlation relating sludge dry solids hold-up to paddle dryer operating parameters was determined thanks to a design of experiments. In a first step, a fractional factorial design was implemented, allowing studying the influence of 4 parameters with 8 experiments: sludge flow rate and stirring speed showed no influence on the hold-up, while installation slope, overflow height and their interaction were the most influential parameters. This design was then completed to a circumscribed central composite design, giving access to a quadratic relationship between parameters and hold-up, over a larger range of operating conditions. The error on hold-up estimation by using this correlation is less than 15%, and the standard error on calculated hold-up is 13.7 g. The determining role of hold-up is evidenced by the almost linear relationship between final dry solid content in sludge and its geometric residence time. These results will be implemented in a model describing heat and mass transfer during drying via the penetration theory along with sludge flow via a markovian approach.
NOMENCLATURE
b parameter coefficient (-)
Hu Dry solids hold-up in the paddle dryer (g)
H Overflow height (mm)
N Stirring speed (rpm)
Q Raw sludge flow rate (g/h)
QDS Dry solids flow rate (g/h) R²a Adjusted regression coefficient (-)
θ Dryer slope (°)
τD Dry solids geometric residence time (h)
REFERENCES
[1] D. Fytili et A. Zabaniotou, « Utilization of sewage sludge in EU application of old and new methods--A review », Renewable and Sustainable Energy Reviews, vol. 12, no 1, p. 116‑140, 2008.
[2] T. Kudra, « Sticky Region in Drying: Definition and Identification », Drying Technology, vol. 21, no 8, p. 1457‑1469, 2003.
[3] P. Arlabosse, S. Chavez, et D. Lecomte, « Method for Thermal Design of Paddle Dryers: Application to Municipal Sewage Sludge », Drying Technology, vol. 22, no 10, p. 2375‑2393, 2004.
[4] M. Tazaki, H. Tsuno, M. Takaoka, et K. Shimizu, « Modeling of Sludge Behavior in a Steam Dryer »,
Drying Technology, vol. 29, no 14, p. 1748‑1757, 2011.
[5] C. Charlou, M. Sauceau, et P. Arlabosse, « Characterisation of Residence Time Distribution in a Continuous Paddle Dryer », J. Residuals Sci. Technol., vol. 10, no 3, p. 117‑125, juill. 2013.
[6] C. Charlou, M. Sauceau, M. Milhé, et P. Arlabosse, « Application of Markov chains to the modeling of sludge flow in an agitated indirect continuous paddle dryer », présenté à Eurodrying 2013, Paris, 2013.
[7] G. E. P. Box, J. S. Hunter, et W. G. Hunter, Statistics for experimenters: design, innovation, and