HAL Id: hal-01208895
https://hal.archives-ouvertes.fr/hal-01208895
Submitted on 6 Jun 2020HAL is a multi-disciplinary open access archive for the deposit and dissemination of sci-entific research documents, whether they are pub-lished or not. The documents may come from teaching and research institutions in France or abroad, or from public or private research centers.
L’archive ouverte pluridisciplinaire HAL, est destinée au dépôt et à la diffusion de documents scientifiques de niveau recherche, publiés ou non, émanant des établissements d’enseignement et de recherche français ou étrangers, des laboratoires publics ou privés.
Drivers inducing and preventing conversion to organic
farming for dairy and vegetable farmers: findings of a
large-scale survey in the French regions of Brittany and
Pays de la Loire
Laure Latruffe, Céline Nauges, Yann Desjeux
To cite this version:
Laure Latruffe, Céline Nauges, Yann Desjeux. Drivers inducing and preventing conversion to organic farming for dairy and vegetable farmers: findings of a large-scale survey in the French regions of Brittany and Pays de la Loire. [Contract] Institut National de la Recherche Agronomique. 2013, 86 p. �hal-01208895�
Drivers inducing and preventing conversion to organic farming for dairy and vegetable farmers: findings of a large-scale survey in the French regions of Brittany and Pays de
la Loire
Laure Latruffe
INRA, UMR SMART, F-35000 Rennes, France Céline Nauges
University of Queensland, Australia Yann Desjeux
INRA, UMR SMART, F-35000 Rennes, France
Deliverable 2 – Research Project ‘PEPP’ (AgriBio3 funded) “Role of Farm and Sector Economic Performance and Public Policies in the
Development of Organic Farming in France”
25 January 2013
Contact: Laure Latruffe Laure.Latruffe@rennes.inra.fr
INRA, UMR SMART (Structures et Marchés Agricoles, Ressources, Territoires) 4 Allée Bobierre, CS 61103, 35011 Rennes cedex, France
Tél.: +33.2.23.48.53.82 Fax: +33.2.23.48.53.80 http://www6.rennes.inra.fr/smart_eng/
1. Introduction
The decision to adopt organic technology on a farm is a complicated one that takes into consideration the attributes of the farm itself and such factors as the farmer’s characteristics, sector and market features, public policy and regulations (health and environmental) (see the review by Géniaux et al., 2010).
This study takes a large-scale survey to analyse the determinants of the organic conversion decision among dairy farmers in the French regions of Brittany and Pays de la Loire and among vegetable producers in Brittany1. The main purpose of the exercise is to identify factors internal and external to the farm that influence the farmer’s decision to convert to organic farming or stay with conventional farming. The advantage of a large-scale survey is that it enables the use of suitable statistical methods to quantify the impact of each of these factors on the farmer’s decision. Statistical methods can also be used to statistically validate the linkages between the different factors and the decision to convert or keep farming conventionally.
This survey and the following analyses set out to understand how conventional farmers differ from organic farmers, and why some decide to go organic while others prefer to stick to conventional agriculture. To our knowledge, this is the first statistical analysis of its kind on a large sample of French farms. Policymakers will find the identification of organic conversion determinants useful to their policymaking.
The survey was restricted to two regions to guarantee a certain consistency of farming conditions and organic produce market access conditions. The survey work on Brittany and Pays de la Loire was assisted by local partners, whose expertise and knowledge were key to this project’s success.
2. Survey description
The survey covered both organic and conventional farmers in order to identify the determinants of the decision as to whether or not a farm goes organic.
The accountancy company Cogedis-Fideor supplied the contact details of the conventional farmers and some of the organic farmers. The other organic farmers’ details were provided by the regional organic agriculture federations: Fédération Régionale des Agrobiologistes de Bretagne (FRAB) in the Brittany region and Coordination AgroBiologique des Pays de la Loire (CAB) in the Pays de la Loire region.
Organic farmers were selected for the survey based on two criteria: 1) partial or total conversion to organic farming in progress or completed; 2) start of conversion in 2005 or
1
Based on the European Union’s Nomenclature of Territorial Units for Statistics (NUTS) (see http://epp.eurostat.ec.europa.eu/portal/page/portal/nuts_nomenclature/introduction), the regions referred to in this document are NUTS2 regions and the sub-regions are NUTS3 regions.
later. With respect to the first criterion, the survey did not cover farmers who directly set up as organic farms, since the purpose was to identify the determinants of conversion from conventional agriculture to organic production. Organic farmers were selected for the survey if they were converting or had completed conversion of part or all of their farm. With respect to the second criterion, 2005 was chosen as the earliest conversion start date acceptable to produce a sample of fairly homogeneous farmers in terms of their regulatory and economic environment. The conventional farmers were selected based on the availability of their bookkeeping data for the year of the survey and the few years prior to the survey.
All the farmers who satisfied the abovementioned criteria were pre-selected and sent a letter in late August 2011 to explain the study and ask them to take part in the survey. The letter assured farmers that the information collected and analysed would be kept confidential and anonymous. The letter also informed organic farmers who were not members of Cogedis-Fideor that the survey would collect bookkeeping data covering a number of years. In early September 2011, the farmers to whom the letter was sent were contacted by telephone to ask them if they would agree to be respondents. The farmers who gave their consent by telephone were then contacted by student interviewers to make an appointment. A second letter was sent to the organic farmers who agreed to take part in the survey in September 2011 to let them know precisely which bookkeeping data were required, in case they wished to prepare for the interview with the students.
The survey took the form of face-to-face interviews with farm heads on their farms conducted by agricultural students from LEGTA in Le Rheu (in Brittany’s sub-region of Ille-et-Vilaine) for the dairy sector in Brittany, from ESA in Angers (in Pays de la Loire’s sub-region of Maine-et-Loire) for the dairy sector in Pays de la Loire, and from IREO in Lesneven (in Brittany’s sub-region Finistère) for the vegetable sector in Brittany. The interviews were held from September 2011 to January 2012. They lasted one hour on average (up to two hours for organic farmers providing bookkeeping data).
The questionnaire was designed by the INRA in liaison with the project partners (Inter Bio Bretagne, FRAB, CAB and Cogedis-Fideor). It contained a number of sections and differed depending on whether the farmer was: a) conventional, b) organic, but a member of Cogedis-Fideor, or c) organic, but not a member of Cogedis-Fideor.
- First of all, the farmers were reminded that their answers would remain anonymous. - The first section of the questionnaire was presented to all three types of farmers. It
concerned the farm head and his/her household: household composition (ages, levels of education, organic training, etc.), membership of a farmers’ union, membership of an environmental association, any off-farm paid work, percentage of household income from agricultural activities, agricultural press readership and Internet use. - The second section, also presented to all three types of farmers, contained questions on
the farm head’s opinions about society and environmental issues, environmental regulations, and the health risk to farmers exposed to pesticides. An additional
question was presented to the conventional farmers regarding what they thought of organic farming.
- The third, relatively long section concentrated first of all on the study focus: conversion to organic agriculture. The questions presented to all three types of farmers concerned the different farm units’ production methods, the factors inducing and preventing conversion, any assessment made of conversion to organic farming, availability of extension services on organic farming, and respondents’ opinions on a possible link between the decision as to whether or not to convert to organic farming and the financial returns from conventional farming. The conventional farmers were also asked whether they had tested organic agriculture on their farms, whether they were considering going organic in the next five years, and what minimum annual sum of subsidies could encourage them to convert their farm. The questionnaire asked the organic farmers what really triggered their conversion and what problems they encountered following the switch. This third section also asked for a description of the farm and its environment (quality label production, contract farming, agri-environment schemes, soil type, rainfall, farm successor, distance to suppliers and production buyers, distance to a local open-air market, availability of a shared machinery cooperative or contract work company for organic production, and the number of conventional and organic farms in the municipality). The organic farmers were also asked to answer certain questions with respect to two dates: at the time of the survey (as with the conventional farmers) and before their farm’s conversion to organic agriculture.
- The fourth and last section detailed structural and bookkeeping data over a number of years. For the conventional farmers, it covered 2010, 2009, 2008, 2007 and 2006. For the organic farmers, it concerned 2010, the first year of conversion (t), and the three years preceding the year of conversion (t-1, t-2 and t-3). The data collected for the three types of farmers (conventional, organic member of Cogedis-Fideor, and organic non-member of Cogedis-Fideor) concerned on-farm activities aside from production, the type of selling method (direct or indirect), dairy cattle grazing areas, the number of plots, nitrate pressure, subsidies received, and the yield from the main type of farming. The organic farmers who were not members of Cogedis-Fideor were also asked for “classic” accounts information (which this accounting company provided for member farmers): the different types of area, labour, animals, costs, income, capital and debts, and information on milk production and yield.
- At the end of the questionnaire, the farmers were asked if they had any comments to make about the survey, the questionnaire, their situation, etc. The students then thanked them for their time.
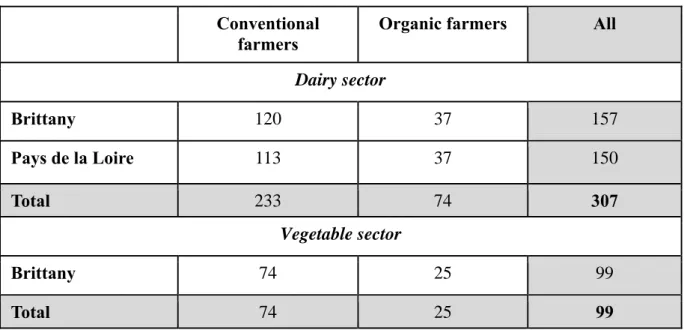
Table 1 shows that a total of 307 dairy farmers were interviewed: 233 conventional farmers (120 in Brittany and 113 in Pays de la Loire) and 74 organic farmers (37 in each region). In Brittany, survey coverage was denser in the sub-region of Ille-et-Vilaine than in the other
three Breton sub-regions. In Pays de la Loire, coverage was less dense in the Vendée and Sarthe sub-regions than in the other sub-regions. In the vegetable sector, 74 conventional farmers and 25 organic farmers were interviewed, with nearly all of them located in the Finistère and Côtes d’Armor sub-regions. However, the study’s analyses on this sector concern just 72 conventional farmers and 11 organic farmers due to the poor quality of the data collected on the other farmers.
Table 1: Number of farmers interviewed Conventional
farmers
Organic farmers All Dairy sector Brittany 120 37 157 Pays de la Loire 113 37 150 Total 233 74 307 Vegetable sector Brittany 74 25 99 Total 74 25 99
3. Respondent farmers’ profiles
The interviewed farmers’ profiles are based on their answers to the survey questions (end of 2011-beginning of 2012) and structural information for the most recent accounting year common to all the farmers, i.e. 2010 (with the exception of the organic farmers who started their conversion in 2011, since they are excluded from the statistics for 2010 as they were still conventional at this time).
3.1. Dairy farmers
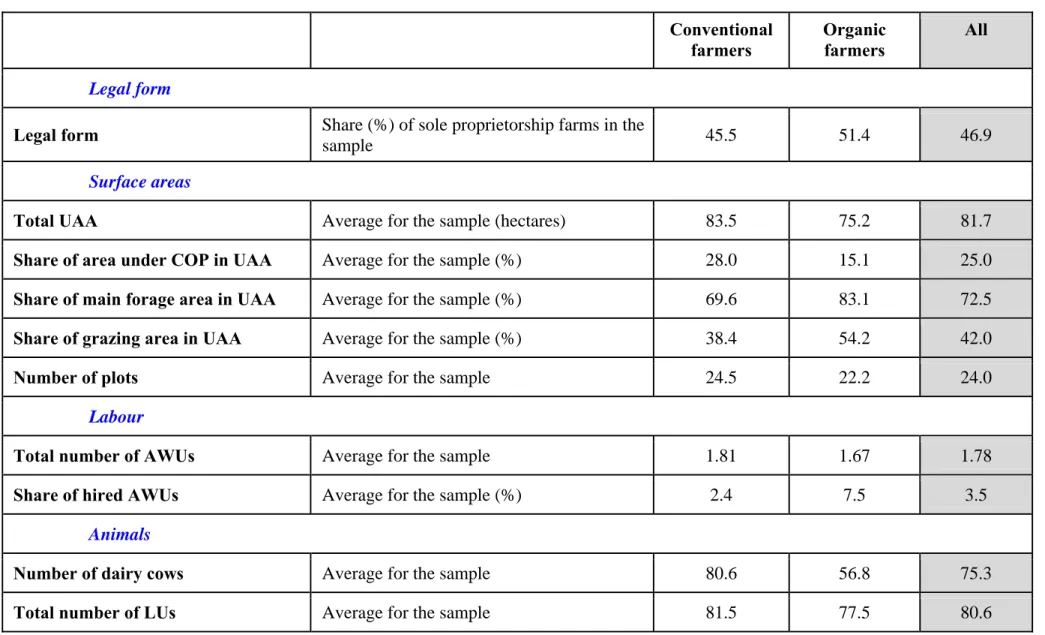
Table 2 presents the average characteristics of the conventional farmers and organic farmers interviewed in the dairy sector. The comments below are presented in the order in which the characteristics appear in the table.
Approximately 45% of the conventional farm sample were sole proprietorship farms, which is a slightly lower percentage than for the organic farmers (approximately 51%). In 2010, the respondent conventional farmers had an average utilised agricultural area (UAA) of 83.5
conventional farmers’ area under cereals, oilseeds and protein crops (COP) accounted for an average 28.0% of the UAA, the main forage area for an average 69.6% of the UAA, and the grazing area for an average 38.4% of the UAA. These figures were 15.1%, 83.1% and 54.2% respectively for the organic farmers. The average number of plots was 24.5 for the conventional farmers as opposed to 22.2 for the organic farmers. The conventional farms used an average 1.81 annual work units (AWU) compared with 1.67 for the organic farms. An average 2.4% and 7.5% of these AWUs were hired labour on the conventional and organic farms respectively.
The average number of dairy cows and livestock units (LU) was higher on the conventional farms (80.6 and 81.5 respectively) than the organic farms (56.8 and 77.5 respectively). Stocking density per hectare was lower on the organic farms than on the conventional farms in terms of hectare of UAA, main forage area and grazing area. Average nitrate pressure was 137.1 kg of nitrogen per hectare on the conventional farms as opposed to 97.1 kg on the organic farms. A total of 47.3% of the respondent organic farmers had adopted one or more agri-environment schemes (AESs), excluding the organic conversion measure. This compares with 20.2% of the conventional farmers.
In 2010, total farm costs to UAA were lower on average on the organic farms (€1,866.7 per hectare) than on the conventional farms (€2,309.4 per hectare). The conventional farmers had slightly higher average machinery, seed and seedling, and irrigation costs per hectare of UAA than the organic farmers. However, their fertiliser, pesticide, animal feed and veterinary costs per hectare of UAA were much higher on average than they were for the organic farmers. The opposite is true of shared machinery cooperative and contract work company costs per hectare of UAA (with the organic farmers’ costs being higher on average), whereas both groups of farmers reported similar insurance costs per hectare of UAA.
Both groups of farmers also had a similar indebtedness ratio (53.2% for the conventional farmers and 55.5% for the organic farmers). With respect to earnings per hectare of UAA, the organic farmers had a lower operating surplus on average (at €848.3 as opposed to €932.8 per hectare), although they presented a higher farm profit2 (€316.8 versus €208.4 per hectare) than the conventional farms. In 2010, the respondent farmers received an average €352.5 in total subsidies (excluding investment subsidies) per hectare of UAA. Most of these were in the form of single farm payments (SFPs) (at €320.0 per hectare for the conventional farmers and €289.9 for the organic farmers). The organic farmers received more agri-environment payments (including organic conversion subsidies) than the conventional farmers (€94.3 compared with €9.0 per hectare on average). This placed them ahead of the conventional farmers in terms of total subsidies (€392.3 as opposed to €341.3 per hectare), despite having a lower average SFP per hectare. None of the farms in the sample received Less Favoured Area (LFA) payments in 2010.
2
The operating surplus is given by farm revenue (farm sales, subsidies and insurance compensations) from which variable costs specific to crop and livestock production, as well as land, labour and insurance costs are subtracted. The farm profit is obtained by subtracting depreciation and interest from the operating surplus.
The conventional farms were larger on average in terms of their milk quotas and they had a higher milk yield per cow than the organic farms (6,960 litres as opposed to 5,502 litres per cow). The organic farms had a higher average milk price at €365.3 per 1,000 litres as opposed to €330.4 for the conventional farms.
Approximately 93% of the conventional farmers and 76% of the organic farmers had signed the French Charter for Good Agricultural Practices. Few farms were found to be producing under other quality labels, with the exception of 11% of the conventional farmers who had adopted sustainable farming. Over half (some 57%) of the respondent organic farmers contract farmed. Most (94.4%) of these agreements were written contracts. Only around 38% of the conventional farmers practised contract farming, with just 66.7% of these having written contracts. The majority of the contract farming organic farmers (86.1%) and conventional farmers (76.1%) had long-term contracts running for more than one year. The exclusivity criterion applied to approximately three-quarters of both types of farm.
Although 12% (respectively 14%) of the respondent conventional farms (respectively organic farms) reported that they practised direct selling on the farm, the turnover generated by this activity was low (less than 2% of turnover on average from direct retail: on-farm sales, cooperative farm shops, open-air markets, institutional catering operations and canteens). On both types of farm, sales were mainly indirect via cooperatives and processors. The share of turnover from sales through cooperatives was slightly higher in the sample of conventional farmers (52.6% as opposed to 43.8% in the sample of organic farmers on average). Lastly, 7.1% of the organic farms had agritourism operations, as opposed to 2.6% in the group of conventional farms.
The respondent farms received 757 mm of annual rainfall on average, without any marked difference between conventional and organic farms. However, the share of UAA found on wetlands was higher on average on the organic farms (22.0%) than on the conventional farms (7.7%). Soil textures were also comparable in both samples, with a predominance of medium soils (loam, clay loam and clayey sand) and heavy soils (clay, silty clay and sandy clay). An average 81.4% of the UAA of both types of farm was on non hydromorphic soil.
Approximately 18% of the farms, conventional and organic, had already chosen a successor for the farm. A larger share of organic farmers (31%) than conventional farmers (10.3%) were undecided about a successor.
The municipalities where the respondent conventional and organic farms were established had an average of 28 commercial farms. The proportion of commercial farms producing organically (certified or in transition) was slightly higher on average in the municipalities where the respondent organic farms were established (14.1% as opposed to 6.7% in the municipalities where the conventional farms were interviewed).
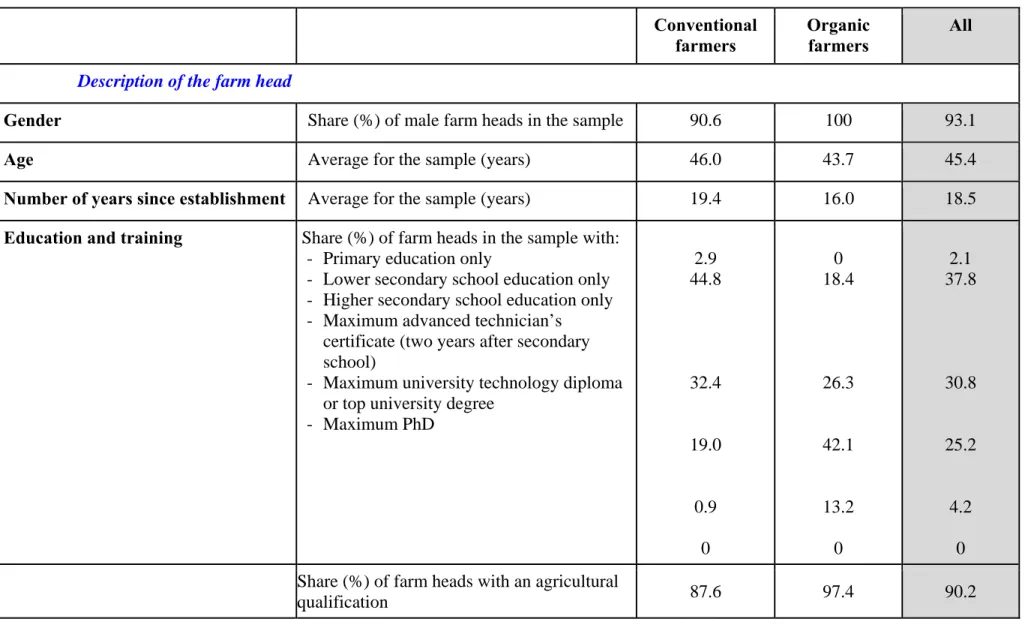
Table 3 presents the profiles of the farm heads and their households. The farm heads who took part in the survey were virtually exclusively male (100% of the organic farmer sample and 90.6% of the conventional farmer sample). The farm heads were 44 years old on average in
the sample of organic farms as opposed to 46 years old on average in the sample of conventional farms. The conventional farmers had been established for an average of 19 years as opposed to 16 years for the organic farmers. The two samples present different levels of education and training characteristics. Some 20% of the conventional farmers had two years of higher education (advanced technician’s certificate or university technology diploma) or more as opposed to 55% of the group of organic farmers. The vast majority of the farm heads interviewed had an agricultural qualification (87.6% in the group of conventional farmers and 97.4% in the group of organic farmers). Not surprisingly, the majority of the organic farmers (57.9%) had taken one or more dedicated organic training courses, compared with just 6.6% in the sample of conventional farmers.
Approximately three-quarters of the respondent organic farmers (76.4%) were members of a farmers’ union or an agricultural development association, as opposed to just 41% for the group of conventional farmers. This difference may be due in part to a sampling bias, since most of the organic farmers interviewed were drawn from regional organic farmer unions’ membership lists. Around 15% of the organic farmers were members of an environmental or nature conservation association, compared with some 6% of the conventional group. Few respondent farmers (less than 7%) had off-farm paid work. Of those who did, most of the conventional farmers worked as employees (non-agricultural), with the minority being business heads, while the organic farmers with off-farm paid work did so either as business heads or self-employed.
Nearly all of the respondent farmers read the agricultural press, generally for more than an hour per week (two to three hours for the farmers in both groups). The organic farmers were more frequent Internet users (just 8.1% did not use it as opposed to 18.8% of the conventional farmers). A full 85.1% of the organic farmers who used the Internet consulted the weather forecast (versus 68.7% for the conventional group) and 63.5% used it to look up commodity prices or for advice (as opposed to 59.7% in the conventional group). Lastly, 25.7% of the organic farmers used the Internet to sell or promote their products, compared with 15% in the conventional group.
Household composition was similar on average in both samples, with just short of two people under 18, slightly more than two people aged 18 to 64 years old, and no one aged 65 or over. The respondent organic farms appear to be more diversified than the conventional farms. In 64.8% of the respondent conventional farms, over 90% of gross income was generated by farming activities whereas this was the case with just 49.3% of the organic farms interviewed. A small share of gross income came from the farm head’s off-farm paid work (14.7% and 10.2% on average for the conventional and organic farms respectively). The rest of the gross income came from off-farm paid work by other household members or on-farm non-agricultural activities.
The respondent farmers were then asked whether they agreed with a certain number of statements (Table 4). They were asked to rank each statement on a scale of one to four based on the following options: 1 (fully agree), 2 (agree), 3 (disagree), 4 (strongly disagree). Table 4
shows the average score given by the two types of farmers for each statement and the share of don’t knows. The following presents the statements that drew significantly different opinions from the conventional and organic farmers. More organic farmers felt that most farmers did not make any real effort today to protect the environment and that some production methods were environmentally damaging: the average score for statement (a) was 2.7 for the organic farmers, whereas it was 1.6 for the conventional farmers. The organic farmers found the environmental regulations less restrictive than the conventional farmers (average score for statement (c) of 3.0 as opposed to 1.8). More organic farmers felt that environmental regulations are a good thing, whether for the agricultural sector (average score for statement (d) of 1.6 versus 1.9) or for society as a whole (average score for statement (e) of 1.6 as opposed to 2.0).
The farmers were subsequently asked to rank the following five society issues in order of importance (from 1: the most important; to 5: the least important): international tensions, economic problems in France, environmental problems in France, health crises in France, and social problems in France. Table 5 shows the average rankings for each issue. The group of conventional farmers felt, on average, that economic issues were the most important (average score of 1.8) and saw health crises as the least important problem (average score of 4.0). The group of organic farmers considered social issues to be most important (average score of 2.1) and also placed health crises at the bottom of the list (average score of 4.5). On average, the organic farmers attached more importance to environmental issues than the conventional farmers (average score of 2.8 as opposed to 3.4).
The survey then sought to find out how concerned respondent farmers were about the following environmental issues: water scarcity, air pollution, green algae, water pollution, GMOs, threat to biodiversity, soil degradation, and the disappearance of farming land (Table 6). Farmers were asked to state their level of concern for each of these issues on a scale of 1 to 5, where 1 was not at all concerned and 5 was very concerned. Table 6 presents the average scores across both types of farmer for each issue along with the share of don’t knows. The organic farmers said they were more concerned, on average, than the conventional farmers about each of these issues, with a higher average score than the conventional farmers.
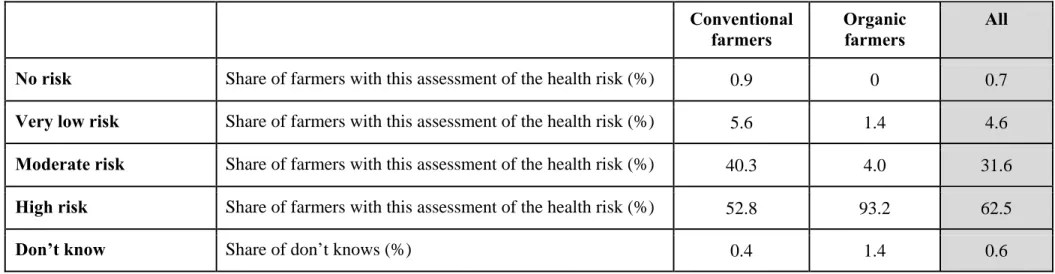
Following this, the farmers were asked to assess the risk associated with their exposure to pesticides (Table 7). Approximately 47% of the conventional farmers felt there was no, a very low or a moderate risk (40.3% deemed it moderate), as opposed to around 5% of the organic farmers (4.0% felt the risk was moderate). A full 93.2% of the organic farmers responded that the risk was high, as opposed to just 52.8% in the group of conventional farmers.
Lastly, the interviewers asked the conventional farmers what they thought about organic farming (Table 8). The majority of the conventional farmers had a fairly negative opinion of organic farming, seeing it as unproductive (59.2% of them), risky (53.6%), technically complicated (72%), restrictive (69%) and a fad (72.1% of them). However, a majority of these farmers (53.4%) also viewed organic farming as being environmentally friendly.
To sum up, the characteristics that differentiate the conventional farms from the organic farms (on average) in the sample of dairy farms are:
- Farm size (larger among the conventional farmers),
- Forage and grazing areas (larger among the organic farmers),
- Dairy cow stocking density (higher among the conventional farmers), - Nitrate pressure (higher among the conventional farmers),
- Participation in AESs (more widespread among the organic farmers),
- Shared machinery cooperative and contract work company costs (higher among the organic farmers),
- Fertiliser, pesticide, animal feed and veterinary costs (higher among the conventional farmers)
- Earnings (higher or lower among the conventional farmers depending on the indicator used),
- Presence of commercial organic farms in the municipality (higher among the organic farmers),
- Level of education (higher among the organic farmers),
- Concern about environmental issues (greater among the organic farmers), and
- Assessment of the health risks associated with the use of pesticides (considered greater on average by the organic farmers).
These differences in characteristics between conventional and organic farmers are consistent in general with the findings of other samples. Of note, however, is the large difference with respect to level of education, which is much higher among the organic farmers than the conventional farmers. A higher level of education is probably conducive to conversion, since the farmer can get more of a perspective on the farming system and the practices put in place. Table 9 summarises some of the organic farming characteristics of the 74 organic dairy farmers interviewed. At the time of the survey, 43 farms were fully certified, 25 farms were fully transitional, and six farms were mixed (in transition and certified). Most of the respondent organic farmers started to convert their farm in 2008, 2009 and 2010. Despite the care taken over farmer selection, two respondents converted their farms before 2005, which we had set as the respondent selection cut-off point (they started their conversions in 1999 and 2004 respectively). One or two farmers reported that they had started up or shut down a production unit for vegetables, COP, other major crops, pigs or poultry when they converted their farm to organic production, and 14 farmers said they had shut down their meat unit.
The respondent organic farmers were asked to put a figure to the retail price differential between their organic label production and similar conventional production. The 72 farmers who answered this question (of the 74 interviewed) all felt that the differential was positive for their dairy production and that, on average, their organic produce was 26.4% more expensive (the differential ranging from 7% to 45% across respondents).
Table 2: Respondent dairy farmers’ farm profiles
Conventional farmers Organic farmers All Legal form
Legal form Share (%) of sole proprietorship farms in the
sample 45.5 51.4 46.9
Surface areas
Total UAA Average for the sample (hectares) 83.5 75.2 81.7
Share of area under COP in UAA Average for the sample (%) 28.0 15.1 25.0
Share of main forage area in UAA Average for the sample (%) 69.6 83.1 72.5
Share of grazing area in UAA Average for the sample (%) 38.4 54.2 42.0
Number of plots Average for the sample 24.5 22.2 24.0
Labour
Total number of AWUs Average for the sample 1.81 1.67 1.78
Share of hired AWUs Average for the sample (%) 2.4 7.5 3.5
Animals
Number of dairy cows Average for the sample 80.6 56.8 75.3
Number of dairy cows per hectare of
UAA Average for the sample (number/hectare) 1.0 0.8 1.0
Number of dairy cows per hectare of
main forage area Average for the sample (number/hectare) 1.5 0.9 1.4
Number of dairy cows per hectare of
grazing area Average for the sample (number/hectare) 3.8 2.9 3.6
Environment
Average nitrate pressure on the farm Average for the sample (kg nitrogen/ hectare) 137.1 97.1 127.8 AESs
Share (%) of farms in the sample involved in one or more AESs excluding the conversion to organic farming scheme
20.2 47.3 26.7
Costs
Total costs per hectare of UAA Average for the sample (€/hectare) 2,309 1,867 2,221 Machinery costs per hectare of UAA Average for the sample (€/hectare) 498 431 459 Shared machinery cooperative and
contract work company costs per hectare of UAA
Average for the sample (€/hectare) 57 107 68
Fertiliser costs per hectare of UAA Average for the sample (€/hectare) 92 24 76 Seed and seedling costs per hectare
of UAA Average for the sample (€/hectare) 68 61 67
Irrigation costs per hectare of UAA Average for the sample (€/hectare) 2.0 1.7 1.9 Animal feed costs per hectare of
UAA Average for the sample (€/hectare) 341 239 317.0
Veterinary costs and fees per hectare
of UAA Average for the sample (€/hectare) 53 38 50
Cost of insurance per hectare of
UAA Average for the sample (€/hectare) 43 48 44
Debt
Indebtedness ratio Average for the sample (%) 53.2 55.5 53.7
Earnings
Operating surplus per hectare of
UAA Average for the sample (€/hectare) 933 848 913
Farm profit per hectare of UAA Average for the sample (€/hectare) 208 317 233 Subsidies
Total subsidies (excluding
investment subsidies) per hectare of UAA
Average for the sample (€/hectare) 341 392 352
SFP per hectare of UAA Average for the sample (€/hectare) 320 290 313
Agri-environmental payments per
hectare of UAA Average for the sample (€/hectare) 9 94 30
Milk production
Quota Average for the sample (litres) 361,951 300,629 348,975
Yield Average for the sample (litres/dairy cow) 6,960 5,502 6,659
Milk price Average for the sample (€/1,000 litres) 330 365 338
On-farm production and other activities
Quality label production
Share (%) of farms in the sample with the following quality label:
- Controlled Designation of Origin, Protected Geographical Indication
- Label Rouge
- Sustainable farming - “Farm-produced”
- Charter for Good Agricultural Practices - Certificate of Product Compliance - Other 1.3 4.3 11.2 1.3 92.7 6.0 0 0 2.7 2.7 1.3 75.7 8.1 2.7 1.0 3.9 9.1 1.3 88.6 7.5 1.0 Contract farming
Share (%) of contract farming farms in the sample
Average share of turnover from contract farming for the sample (%)
Share (%) of farms in the sample with a written contract
Share (%) of farms in the sample with a contract for more than one year
Share (%) of farms in the sample with an exclusive contract 37.8 88.9 66.7 76.1 72.4 56.8 92.7 94.4 86.1 75.0 42.3 90.0 74.8 79.0 73.2
Direct and indirect sales
Average sample share of turnover from direct sales (%)
- On the farm
- In cooperative farm shops - By box scheme
- In open-air markets
- To institutional catering operations/ canteens Average sample share of turnover from
indirect sales (%) - In cooperatives - To processors
- To shops and supermarkets - By other indirect selling methods
0.9 0 0.1 0.1 0 52.6 38.1 0.2 5.9 0.9 0.1 0.4 0.3 0 43.8 41.0 0 13.9 0.9 0 0.1 0.2 0 50.5 38.8 0.1 7.9
Other farm activities
Share (%) of farms practising - Direct on-farm sales
- Processing - Craft trades - Agritourism - Contract work
- Other types of activities
12.0 1.7 0 2.6 5.1 1.3 14.3 0 0 7.1 1.4 2.9 12.5 1.3 0 3.6 4.3 1.6 Soil and climate
Average annual rainfall on the farm Average for the sample (millimetres per year) 764 741 757
Share of UAA on wetlands Average for the sample (%) 7.7 22.0 11.2
Main soil textures on the farm
Sample average share of UAA (%) of - Heavy soil (clay, silty clay, sandy clay) - Medium soil (loam, clay loam, clayey sand) - Light soil (sand or loamy sand)
34.0 47.3 18.7 33.2 45.3 21.5 33.8 46.8 19.4
Sample average share of UAA (%) of - Hydromorphic soil
- Non hydromorphic soil
18.6 81.4 18.6 81.4 18.6 81.4 Successor
Successor identified for the farm
Share (%) of farms in the sample - With a successor - Without a successor - Undecided 18.0 71.7 10.3 17.6 51.4 31.0 17.9 66.8 15.3 Other farms in the municipality
Number of commercial farms in the
municipality Average for the sample 27.6 27.7 27.6
Number of commercial farms
producing organically (certified or in transition) in the municipality
Average for the sample 1.8 3.3 2.2
Share of commercial farms
producing organically (certified or in transition) in the municipality
Table 3: Profiles of respondent dairy farm heads and their households
Conventional farmers Organic farmers All Description of the farm head
Gender Share (%) of male farm heads in the sample 90.6 100 93.1
Age Average for the sample (years) 46.0 43.7 45.4
Number of years since establishment Average for the sample (years) 19.4 16.0 18.5 Education and training Share (%) of farm heads in the sample with:
- Primary education only
- Lower secondary school education only - Higher secondary school education only - Maximum advanced technician’s
certificate (two years after secondary school)
- Maximum university technology diploma or top university degree
- Maximum PhD 2.9 44.8 32.4 19.0 0.9 0 0 18.4 26.3 42.1 13.2 0 2.1 37.8 30.8 25.2 4.2 0 Share (%) of farm heads with an agricultural
Share (%) of farm heads who have taken one
or more dedicated organic training courses 6.6 57.9 20.1
Membership of a farmers’ union or agricultural development
association
Share (%) of member farm heads in the
sample 41.0 76.4 49.5
Membership of an environmental or nature conservation association (local, national or international)
Share (%) of member farm heads in the
sample 5.6 14.9 7.9
Off-farm paid work (excluding elected office or representative of a professional organisation)
Share (%) of farm heads with such work in the sample
Of these, average percentage of working time spent on this work (%)
Of these, share (%) of farm heads who are: - Head of a business/organisation/
association other than a farm - Employee of a non-farm
business/organisation/association (public or private sector)
- Employee on one or more other farms - Self-employed 5.7 16.9 23.1 46.2 0 0 6.8 10.0 20.0 0 0 20.0 6.0 15.0 22.2 33.3 0 5.6 Agricultural press readership Share (%) of farm heads in the sample who
never read the agricultural press
Share (%) of farm heads in the sample who read the agricultural press
- Less than one hour per week - More than one hour per week
2.1 27.5 70.4 0 24.3 75.7 1.6 26.7 71.7 Internet use Share (%) of farm heads in the sample who
do not use the Internet
Share (%) of farm heads in the sample who use the Internet for
- The weather forecast
- Information, advice, commodity prices - Purchasing inputs, animals or equipment - Selling, promoting or advertising
agricultural products - Other agricultural activities
- Personal non-agricultural activities
68.7 59.7 43.3 15.0 52.8 63.9 85.1 63.5 43.2 25.7 74.3 79.7 72.6 60.6 43.3 17.6 58.0 67.8 Description of the farm head’s household
Household composition Average for the sample of the number of people aged
- Under 18 years old - 18 to 64 years old - 65 and over 1.3 2.4 0.04 1.9 2.4 0 1.5 2.4 0.03 Household share of gross income
from agricultural activities
Share (%) of farms where the percentage is - Less than 10% - From 10% to 29% - From 30% to 49% - From 50% to 69% - From 70% to 89% - 90% and over 1.3 2.2 10.7 13.3 7.7 64.8 1.4 1.4 9.6 28.7 9.6 49.3 1.3 2.0 10.4 17.0 8.2 61.1 Household share of gross income
from farm head’s off-farm paid work
Table 4: Respondent dairy farmers’ opinions of the statements about agriculture and the environment
Conventional
farmers Organic farmers All (a) Most farmers today make a real effort to
protect the environment
Share of don’t knows (%) Average score* 0.4 1.6 0 2.7 0.3 1.8 (b) Some of today’s agricultural production
methods are environmentally damaging
Share of don’t knows (%) Average score* 4.3 2.5 0 1.5 3.3 2.2 (c) The environmental regulations for
agriculture are too restrictive
Share of don’t knows (%) Average score* 1.7 1.8 2.7 3.0 1.9 2.1 (d) Environmental regulations for
agriculture are a good thing for the future of farming
Share of don’t knows (%) Average score* 6.9 1.9 2.7 1.6 5.9 1.9 (e) Environmental regulations for agriculture
are a good thing for the future of society
Share of don’t knows (%) Average score* 5.1 2.0 5.4 1.6 5.2 1.9 * Scores on a scale of 1 to 4, where 1 – fully agree; 2 – agree; 3 – disagree; 4 – strongly disagree
Table 5: Respondent dairy farmers’ opinions about society issues
Conventional
farmers Organic farmers All International tensions (terrorist threat,
international conflicts, etc.) Average ranking* 3.5 3.2 3.4
Economic problems in France
(unemployment, inflation, etc.) Average ranking* 1.8 2.5 2.0
Environmental problems in France (waste,
air pollution, water pollution, etc.) Average ranking* 3.4 2.8 3.3
Health crises in France (E. Coli, mad cow,
dioxins, etc.) Average ranking* 4.0 4.5 4.1
Social problems in France (poverty,
housing, discrimination, violence, etc.) Average ranking* 2.3 2.1 2.2
Table 6: Respondent dairy farmers who feel concerned about general environmental problems
Conventional
farmers Organic farmers All
Water scarcity Share of don’t knows (%)
Average score* 0.4 3.4 1.3 3.7 0.6 3.5
Air pollution Share of don’t knows (%)
Average score* 2.1 2.6 0 3.4 1.6 2.8
Green algae Share of don’t knows (%)
Average score* 3.4 2.1 1.3 3.3 2.9 2.4
Water pollution Share of don’t knows (%)
Average score* 0 3.2 0 4.2 0 3.4 Genetically modified organisms (GMOs) Share of don’t knows (%)
Average score* 6.4 2.5 1.3 3.9 5.2 2.8 Threat to habitats and biodiversity Share of don’t knows (%)
Average score* 4.3 2.7 1.3 3.8 3.6 3.0 Soil degradation (erosion, salinisation, etc.) Share of don’t knows (%)
Average score* 0.9 2.9 0 3.9 0.6 3.1 Disappearance of farming land (artificial
land cover, urbanisation, etc.)
Share of don’t knows (%) Average score* 0.9 4.2 0 4.5 0.6 4.3 * Scores on a scale of 1 to 5, where 1 – not at all concerned and 5 – very concerned
Table 7: Respondent dairy farmers’ opinions of the health risk to farmers exposed to plant protection products used in agriculture
Conventional
farmers Organic farmers All
No risk Share of farmers with this assessment of the health risk (%) 0.9 0 0.7
Very low risk Share of farmers with this assessment of the health risk (%) 5.6 1.4 4.6 Moderate risk Share of farmers with this assessment of the health risk (%) 40.3 4.0 31.6 High risk Share of farmers with this assessment of the health risk (%) 52.8 93.2 62.5
Don’t know Share of don’t knows (%) 0.4 1.4 0.6
Table 8: Respondent conventional dairy farmers’ opinions of organic farming
Share of respondent conventional farmers who agree with the statement (%) Conventional farmers
(a) A farming method like any other 43.8
(b) An environmentally friendly farming method 53.4
(c) A farming method that produces quality food 33.5
(e) A farming method that earns a good living 23.2
(f) A farming method that creates jobs 30.9
(g) A marginal farming method 33.5
(h) An unproductive farming method 59.2
(i) An unprofitable farming method 22.3
(j) A farming method with a high risk of production loss 53.6
(k) A technically complicated farming method 72.1
(l) A restrictive farming method 68.7
(m) A farming method that is hard to operate in the current economic climate 48.5
(n) A farming method unable to meet the world’s food needs 71.2
(o) A farming method that meets a real consumer demand 51.5
Table 9: Characteristics of the respondent organic dairy farmers’ organic activity
Organic
farmers Type of organic farming
Fully certified organic farm Number of farmers 43
Fully transitional farm Number of farmers 25
Mixed farm (in transition and certified) Number of farmers 6
Conversion date 1999 2004 2005 2006 2007 2008 2009 2010 2011
Number of farmers who started the conversion of their farm on this date
1 1 2 2 3 10 25 25 5
3.2. Vegetable farmers
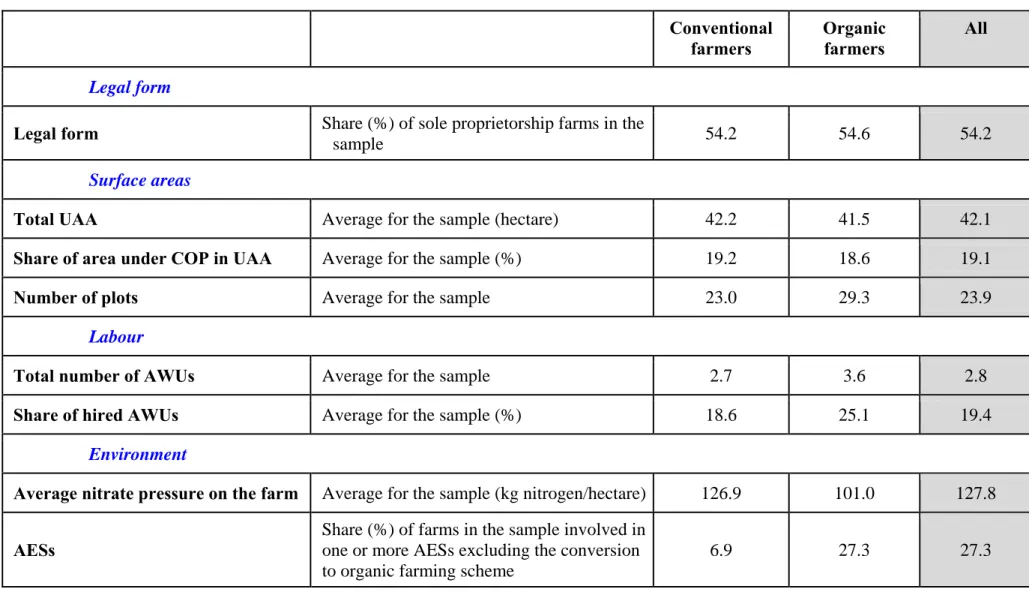
Table 10 presents the average characteristics of the conventional farmers and organic farmers interviewed in the vegetable sector. The comments below are presented in the order in which the characteristics appear in the table.
Approximately 54% of the conventional farm sample were sole proprietorship farms, which is virtually the same percentage as for the organic farmers. In 2010, the conventional farmers interviewed had an average UAA of approximately 42 hectares, here again a very similar figure to the organic farmers interviewed (41.5 hectares). The area under COP for both types of farmers accounted for an average 19.0% of the UAA. One difference concerned labour, since the conventional farms used an average 2.7 AWU compared with 3.6 for the organic farms. An average 18.6% and 25.1% of these AWUs were hired labour respectively on the conventional and organic farms.
Average nitrate pressure was 126.9 kg of nitrogen per hectare on the conventional farms as opposed to 101.0 kg on the organic farms. A total of 27.3% of the organic farmers interviewed had adopted one or more AESs, excluding the organic conversion scheme. This compares with 6.9% of the conventional farmers.
In 2010, total farm costs to UAA were similar on both types of farm (approximately €4,900 per hectare). The conventional farmers had lower average machinery, seed and seedling, and insurance costs per hectare of UAA than the organic farmers. However, their fertiliser, pesticide and irrigation costs per hectare of UAA were much higher on average than the organic farmers.
The conventional farmers had a much higher indebtedness ratio than the organic farmers (40.8% and 22.5% respectively). With respect to earnings per hectare of UAA, the organic farmers had a slightly higher operating surplus on average (at €2,390 as opposed to €2,146 per hectare) as well as a higher profit (€1,117 versus €753 per hectare) than the conventional farms. In 2010, the respondent farmers received an average €163 in total subsidies (excluding investment subsidies) per hectare of UAA. Most of these were in the form of SFPs for the conventional farmers, but agri-environment payments (including organic conversion subsidies) for the organic farmers.
Approximately 53% of the conventional farmers and 73% of the organic farmers produced under a Certificate of Product Compliance. Nearly half (some 45%) of the respondent organic farmers contract farmed. Most (80%) of these agreements were written long-term contracts running for more than one year. Only around one-quarter of the conventional farmers practised contract farming, but most of these had written contracts. However, just 16% of these had long-term contracts running for more than one year. The exclusivity criterion applied to approximately 63% and 40% of each type of farm respectively.
Some farms (27% of the organic farms and 15% of the conventional farms) reported that they practised direct selling on the farm. Nevertheless, the turnover generated by this activity was
shops, open-air markets, institutional catering operations and canteens). On both types of farm, sales were mainly indirect via cooperatives and processors. The share of turnover from sales through cooperatives was similar in both samples at approximately 84%.
The respondent farms received 792 mm of annual rainfall on average, with the conventional farms reporting slightly higher rainfall than the organic farms. However, the share of UAA found on wetlands was similar (6%-7%) on both organic and conventional farms. Soil textures were also comparable in both samples, with a predominance of medium soils (loam, clay loam and clayey sand) and heavy soils (clay, silty clay and sandy clay). Most of the UAA of both types of farm was on non hydromorphic soil.
Approximately 9% of the farms, conventional and organic, had already chosen a successor for the farm. A smaller share of organic farmers (9%) than conventional farmers (17%) were undecided about a successor.
The municipalities where the respondent conventional and organic farms were established had an average of 38 commercial farms. The proportion of commercial farms producing organically (certified or in transition) was slightly higher on average in the municipalities where the respondent organic farms were established (10.9% as opposed to 8.9% in the municipalities where the conventional farms were interviewed).
Table 11 presents the profiles of the farm heads and their households. The farm heads who took part in the survey were virtually exclusively male (100% of the organic farmer sample and 92.3% of the conventional farmer sample). The farm heads were 48 years old on average in both samples. The conventional farmers had been established for an average of 23 years as opposed to 25 years for the organic farmers. The two samples present different levels of education and training characteristics. Some 36% of the conventional farmers had completed secondary school or obtained a higher qualification as opposed to 17% of the group of organic farmers. The vast majority of the farm heads interviewed had an agricultural qualification (84.6% in the group of conventional farmers and 100% in the group of organic farmers). A mere 16.7% of the organic farmers and 2.6% of the conventional farmers had taken one or more dedicated organic training courses.
Over half of the respondent farmers (54% of the conventional farmers) were members of a farmers’ union or an agricultural development association. Around 9% of the organic farmers were members of an environmental or nature conservation association, compared with just 1% of the conventional group. A higher percentage of respondent farmers had off-farm paid work in the organic sample (18%) than in the conventional sample (14%).
Nearly all of the respondent farmers read the agricultural press, generally for more than an hour per week. The organic farmers were more frequent Internet users (just 9.1% did not use it as opposed to 26.4% of the conventional farmers). A full 81.8% of the organic farmers who used the Internet consulted the weather forecast (versus 52.8% for the conventional group) and 81.8% used it to look up commodity prices or for advice (as opposed to 52.8% in the
conventional group). Lastly, 18.2% of the organic farmers used the Internet to sell or promote their products, compared with 22.2% in the conventional group.
Household composition was similar on average in both samples, with approximately one person under 18 and slightly more than two people over 18 years old.
The respondent organic farms appear to be more diversified than the conventional farms. In 62.5% of the respondent conventional farms, over 90% of gross income was generated by farming activities whereas this was the case with just 54.53% of the organic farms interviewed. A not-inconsiderable share of gross income came from the farm head’s off-farm paid work (36.2% and 27.5% on average for the conventional and organic farms respectively). The rest of the gross income came from off-farm paid work by other household members or on-farm non-agricultural activities.
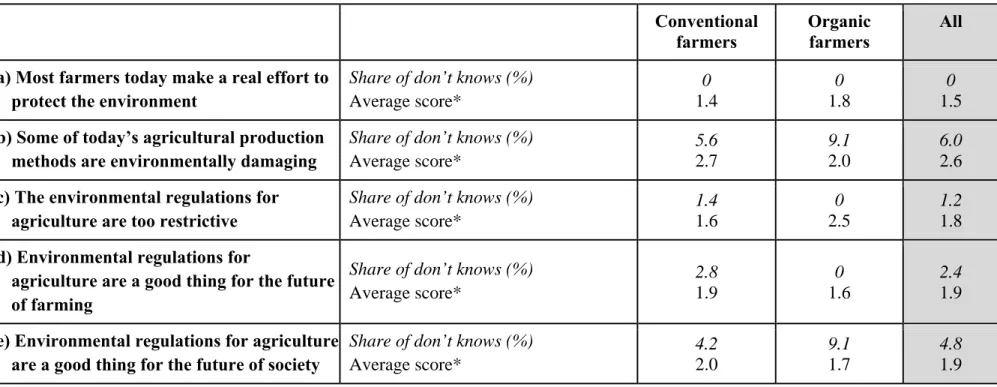
The respondent farmers were then asked whether they agreed with a certain number of statements (Table 12). They were asked to rank each statement on a scale of one to four based on the following options: 1 (fully agree), 2 (agree), 3 (disagree), 4 (strongly disagree). Table 12 shows the average score given by the two types of farmers for each statement and the share of don’t knows. Slightly more organic farmers felt that most farmers did not make any real effort today to protect the environment and that some production methods were environmentally damaging: the average score for statement (a) was 1.8 for the organic farmers, whereas it was 1.4 for the conventional farmers. The organic farmers found the environmental regulations less restrictive than the conventional farmers (average score for statement (c) of 2.5 as opposed to 1.6). More organic farmers felt that environmental regulations are a good thing, whether for the agricultural sector (average score for statement (d) of 1.6 versus 1.9) or for society as a whole (average score for statement (e) of 1.7 as opposed to 2.0).
The farmers were subsequently asked to rank the following five society issues in order of importance (from 1: the most important; to 5: the least important): international tensions, economic problems in France, environmental problems in France, health crises in France, and social problems in France. Table 13 shows the average rankings for each issue. The group of conventional farmers felt, on average, that social issues were the most important (average score of 2.6), whereas the most important issue for the organic farmers was international tensions (closely followed by social issues) with an average score of 2.5. On average, both types of farmers saw environmental issues as having little importance (average scores of 3.2 and 3.3).
The survey then sought to find out how concerned respondent farmers were about the following environmental issues: water scarcity, air pollution, green algae, water pollution, GMOs, threat to biodiversity, soil degradation, and the disappearance of farming land. Farmers were asked to state their level of concern for each of these issues on a scale of 1 to 5, where 1 was not at all concerned and 5 was very concerned. Table 14 presents the average scores across both types of farmer for each issue along with the share of don’t knows. Aside
average, than the conventional farmers about each of these issues, with a higher average score than the conventional farmers.
Following this, the farmers were asked to assess the risk associated with their exposure to pesticides (Table 15). A total of 63.6% of the organic farmers responded that the risk was high, as opposed to 48.6% in the group of conventional farmers.
Lastly, the interviewers asked the conventional farmers what they thought about organic farming (Table 16). The majority of conventional farmers saw organic farming as risky (58.3% of them), restrictive (66.7% of them), unable to meet the world’s food needs (77.8%), restrictive (69%) and a fad (80.6% of them). However, a large proportion of farmers also viewed organic farming as being environmentally friendly (43.1% of them) and very few saw it as unprofitable (13.9%).
To sum up, the characteristics that differentiate the conventional farms from the organic farms (on average) in the sample of vegetable producers are:
- Nitrate pressure (higher among the conventional farmers),
- Participation in AESs (more widespread among the organic farmers),
- Shared machinery cooperative and contract work company costs (higher among the organic farmers),
- Fertiliser, and pesticide costs (higher among the conventional farmers), - Indebtedness ratio (higher among the conventional farmers),
- Earnings (higher among the organic farmers),
- Contract farming (more widespread among the organic farmers), - Direct on-farm sales (more widespread among the organic farmers), - Level of education (lower among the organic farmers),
- Concern about environmental issues (greater among the organic farmers), and
- Assessment of the health risks associated with the use of pesticides (considered greater on average by the organic farmers).
Although some differences are to be expected (e.g. less nitrate pressure for the organic sample), others are more surprising such as the lower level of education and higher earnings. Table 17 summarises some of the organic farming characteristics of the 11 organic vegetable farmers interviewed. At the time of the survey, five farms were fully certified organic, one had part of the farm certified and another part in transition, and one was fully transitional. Despite the care taken over farmer selection, two respondents converted their farms before
2005, which we had set as the respondent selection cut-off point (they started their conversions in 1998 and 1999 respectively).
The respondent organic farmers were asked to put a figure to the retail price differential between their organic label production and similar conventional production. A total of 7 of the 11 organic farmers felt that the differential was positive for their main output and that, on average, their organic products were 30% more expensive (the differential ranging from 10% to 50% across respondents). Three farmers answered that the price for their main organic produce was about the same as the price for similar conventional produce. One respondent stated that conventional produce had a higher price tag (by 50%) than his organic produce.
Table 10: Respondent vegetable farmers’ farm profiles
Conventional farmers Organic farmers All Legal form
Legal form Share (%) of sole proprietorship farms in the
sample 54.2 54.6 54.2
Surface areas
Total UAA Average for the sample (hectare) 42.2 41.5 42.1
Share of area under COP in UAA Average for the sample (%) 19.2 18.6 19.1
Number of plots Average for the sample 23.0 29.3 23.9
Labour
Total number of AWUs Average for the sample 2.7 3.6 2.8
Share of hired AWUs Average for the sample (%) 18.6 25.1 19.4
Environment
Average nitrate pressure on the farm Average for the sample (kg nitrogen/hectare) 126.9 101.0 127.8 AESs
Share (%) of farms in the sample involved in one or more AESs excluding the conversion to organic farming scheme
Costs
Total costs per hectare of UAA Average for the sample (€/hectare) 4,953 4,918 4,950 Machinery costs per hectare of UAA Average for the sample (€/hectare) 1,131 1,312 1,154 Shared machinery company and
contract work company costs per hectare of UAA
Average for the sample (€/hectare) 79 101 82
Fertiliser costs per hectare of UAA Average for the sample (€/hectare) 273 117 253 Seed and seedling costs per hectare
of UAA Average for the sample (€/hectare) 465 646 486
Pesticide costs per hectare of UAA Average for the sample (€/hectare) 230 76 212 Irrigation costs per hectare of UAA Average for the sample (€/hectare) 1.4 0.5 1.3 Cost of insurance per hectare of
UAA Average for the sample (€/hectare) 71 85 73
Debt
Indebtedness ratio Average for the sample (%) 40.8 22.5 58.6
Earnings
Operating surplus per hectare of
UAA Average for the sample (€/hectare) 2,146 2,390 2,174
Subsidies
Total subsidies (excluding
investment subsidies) per hectare of UAA
Average for the sample (€/hectare) 133 387 163
SFP per hectare of UAA Average for the sample (€/hectare) 121 91 117
Agri-environmental payments per
hectare of UAA Average for the sample (€/hectare) 1 175 23
On-farm production and other activities
Quality label production
Share (%) of farms in the sample with the following quality label:
- Controlled Designation of Origin, Protected Geographical Indication - Sustainable farming - Other 5.6 11.2 52.8 9.1 0 72.7 6.0 13.3 55.4 Contract farming
Share (%) of contract farming farms in the sample
Average share of turnover from contract farming for the sample (%)
Share (%) of farms in the sample with a written contract
Share (%) of farms in the sample with a contract for more than one year
Share (%) of farms in the sample with an exclusive contract 26.4 44.4 94.7 15.8 63.2 45.4 62.6 80.0 80.0 40.0 28.9 60.6 91.7 29.2 58.3
Direct and indirect sales Average sample share of turnover from direct sales (%)
- On the farm
- In cooperative farm shops - By box scheme
- In open-air markets
- To institutional catering operations/canteens Average sample share of turnover from
indirect sales (%) - In cooperatives - To processors
- To shops and supermarkets - By other indirect selling methods
1.7 2.4 0 0 0.1 83.4 1.0 1.6 9.0 2.7 0 0.4 0 6 84.5 0 0 12.3 1.8 2.1 0.01 0 0.1 83.6 0.8 1.4 9.4
Other farm activities
Share (%) of farms practising - Direct on-farm sales
- Processing - Craft trades - Agritourism - Contract work
- Other types of activities
15.38 2.8 0 5.6 4.2 2.8 27.3 0 0 0 0 0 16.9 2.4 0 4.8 3.6 2.4 Soil and climate
Average annual rainfall on the farm Average for the sample (millimetres per year) 798 750 792
Share of UAA on wetlands Average for the sample (%) 7.0 6.2 6.9
Main soil textures on the farm
Sample average share of UAA (%) of - Heavy soil (clay, silty clay, sandy clay) - Medium soil (loam, clay loam, clayey sand) - Light soil (sand or loamy sand)
Sample average share of UAA (%) of - Hydromorphic soil 28.4 52.0 19.5 6.2 25.4 48.2 26.4 4.0 28.0 51.5 20.4 5.9
- Non hydromorphic soil 93.8 96.0 94.1 Successor
Successor identified for the farm
Share (%) of farms in the sample - With a successor - Without a successor - Undecided 9.7 73.6 16.7 9.1 81.8 9.1 9.6 74.7 15.7 Other farms in the municipality
Number of commercial farms in the
municipality Average for the sample 39.6 24.0 37.7
Number of commercial farms
producing organically (certified or in transition) in the municipality
Average for the sample 2.9 1.9 2.7
Share of commercial farms
producing organically (certified or in transition) in the municipality
Table 11: Profiles of respondent vegetable farm heads and their households
Conventional farmers Organic farmers All Description of the farm head
Gender Share (%) of male farm heads in the sample 92.3 100 93.3
Age Average for the sample (years) 47.8 47.8 47.8
Number of years since establishment Average for the sample (years) 22.9 25.5 23.2 Education and training Share (%) of farm heads in the sample with:
- Primary education only
- Lower secondary school education only - Higher secondary school education only - Maximum advanced technician’s
certificate (two years after secondary school)
- Maximum university technology diploma or top university degree
- Maximum PhD 0 51.3 35.9 12.8 0 0 0 66.7 16.7 16.7 0 0 0 53.3 33.3 13.3 0 0 Share (%) of farm heads with an agricultural
Share (%) of farm heads who have taken one
or more dedicated organic training courses 2.6 16.7 4.4
Membership of a farmers’ union or agricultural development
association
Share (%) of member farm heads in the
sample 58.3 54.5 57.8
Membership of an environmental or nature conservation association (local, national or international)
Share (%) of member farm heads in the
sample 1.4 9.1 2.4
Off-farm paid work (excluding elected office or representative of a professional organisation)
Share (%) of farm heads with such work in the sample
Of these, average percentage of working time spent on this work (%)
Of these, share (%) of farm heads who are: - Head of a business/organisation/
association other than a farm - Employee of a non-farm
business/organisation/association (public or private sector)
- Employee on one or more other farms - Self-employed 13.9 28.2 30.0 20.0 0 10.0 18.2 5.0 0 0 0 0 14.5 24.3 25.0 16.7 0 8.3 Agricultural press readership Share (%) of farm heads in the sample who
never read the agricultural press
Share (%) of farm heads in the sample who read the agricultural press
- Less than one hour per week - More than one hour per week
1.4 31.9 66.7 0 54.5 45.4 1.2 34.9 63.9 Internet use Share (%) of farm heads in the sample who
do not use the Internet
Share (%) of farm heads in the sample who use the Internet for
- The weather forecast
- Information, advice, commodity prices - Purchasing inputs, animals or equipment - Selling, promoting or advertising
agricultural products - Other agricultural activities
- Personal non-agricultural activities
52.8 52.8 30.6 22.2 37.5 55.6 81.8 81.8 45.4 18.2 27.3 81.8 56.6 56.6 32.5 21.7 36.1 59.0 Description of the farm head’s household
Household composition Average for the sample of the number of people aged
- Under 18 years old - 18 to 64 years old - 65 and over 1.1 2.4 0.03 1.1 2.2 0 1.1 2.3 0.02 Household share of gross income
from agricultural activities
Share (%) of farms where the percentage is - Less than 10% - From 10% to 29% - From 30% to 49% - From 50% to 69% - From 70% to 89% - 90% and over 4.1 2.8 4.2 15.3 11.1 62.5 0 0 9.1 27.3 9.1 54.5 3.6 2.4 4.8 16.9 10.8 61.5 Household share of gross income
from farm head’s off-farm paid work
Table 12: Respondent vegetable farmers’ opinions of the statements about agriculture and the environment
Conventional
farmers Organic farmers All (a) Most farmers today make a real effort to
protect the environment
Share of don’t knows (%) Average score* 0 1.4 0 1.8 0 1.5 (b) Some of today’s agricultural production
methods are environmentally damaging
Share of don’t knows (%) Average score* 5.6 2.7 9.1 2.0 6.0 2.6 (c) The environmental regulations for
agriculture are too restrictive
Share of don’t knows (%) Average score* 1.4 1.6 0 2.5 1.2 1.8 (d) Environmental regulations for
agriculture are a good thing for the future of farming
Share of don’t knows (%) Average score* 2.8 1.9 0 1.6 2.4 1.9 (e) Environmental regulations for agriculture
are a good thing for the future of society
Share of don’t knows (%) Average score* 4.2 2.0 9.1 1.7 4.8 1.9 * Scores on a scale of 1 to 4, where 1 – fully agree; 2 – agree; 3 – disagree; 4 – strongly disagree
Table 13: Respondent vegetable farmers’ opinions about society issues
Conventional
farmers Organic farmers All International tensions (terrorist threat,
international conflicts, etc.) Average ranking* 3.0 2.5 2.9
Economic problems in France
(unemployment, inflation, etc.) Average ranking* 3.1 3.4 3.1
Environmental problems in France (waste,
air pollution, water pollution, etc.) Average ranking* 3.2 3.3 3.2
Health crises in France (E. Coli, mad cow,
dioxins, etc.) Average ranking* 3.1 3.1 3.1
Social problems in France (poverty,
housing, discrimination, violence, etc.) Average ranking* 2.6 2.7 2.6
Table 14: Respondent vegetable farmers who feel concerned about general environmental problems
Conventional
farmers Organic farmers All
Water scarcity Share of don’t knows (%)
Average score* 0 2.9 0 3.3 0 3.0
Air pollution Share of don’t knows (%)
Average score* 0 2.6 0 3.1 0 2.7
Green algae Share of don’t knows (%)
Average score* 4.2 2.9 0 2.5 3.6 2.8
Water pollution Share of don’t knows (%)
Average score* 0 3.3 0 3.4 0 3.3 Genetically modified organisms (GMOs) Share of don’t knows (%)
Average score* 4.2 2.1 9.1 3.1 4.8 2.2 Threat to habitats and biodiversity Share of don’t knows (%)
Average score* 1.4 2.8 0 3.5 1.2 2.9 Soil degradation (erosion, salinisation, etc.) Share of don’t knows (%)
Average score* 0 2.9 0 3.4 0 3.0 Disappearance of farming land (artificial
land cover, urbanisation, etc.)
Share of don’t knows (%) Average score* 0 3.6 0 4.4 0 3.7 * Scores on a scale of 1 to 5, where 1 – not at all concerned and 5 – very concerned
Table 15: Respondent vegetable farmers’ opinions of the health risk to farmers exposed to plant protection products used in agriculture
Conventional
farmers Organic farmers All
No risk Share of farmers with this assessment of the health risk (%) 0 0 0
Very low risk Share of farmers with this assessment of the health risk (%) 9.7 0 8.4 Moderate risk Share of farmers with this assessment of the health risk (%) 41.7 36.4 41.0 High risk Share of farmers with this assessment of the health risk (%) 48.6 63.6 50.6
Don’t know Share of don’t knows (%) 0 0 0
Table 16: Respondent conventional vegetable farmers’ opinions of organic farming
Share of respondent conventional farmers who agree with the statement (%) Conventional farmers
(a) A farming method like any other 45.8
(b) An environmentally friendly farming method 43.1
(c) A way of producing quality food 19.4