Pressure Support Mechanical Ventilation Modes
Katherine T. Moorhead*, Lise Piquilloud**, Bernard Lambermont*, Jean Roeseler***, J. Geoffrey Chase****, Laurence Vignaux*****, Emilie Bialais***, Didier Tassaux*****, Philippe Jolliet**, Thomas Desaive*
*Cardiovascular Research Centre, University of Liege, Liege 4000, Belgium (Tel: +32 4 366 37 33; e-mail: [email protected])
**Intensive Care and Burn Unit, University Hospital, Lausanne , Switzerland *** Intensive Care Unit, Cliniques Universitaire St-Luc, Brussels, Belgium
****Department of Mechanical Engineering, University of Canterbury, Christchurch, New Zealand *****Intensive Care Unit, University Hospital, Geneva, Switzerland
Abstract: Neurally Adjusted Ventilatory Assist (NAVA) is a new ventilatory mode in which ventilator settings are adjusted based on the electrical activity detected in the diaphragm (Eadi). This mode offers significant advantages in mechanical ventilation over standard pressure support (PS) modes, since ventilator input is determined directly from patient ventilatory demand. A comparative study of 22 patients undergoing mechanical ventilation in both PS and NAVA modes was conducted, and it was concluded that for a given variability in Eadi, there is greater variability in tidal volume and correlation between the tidal volume and the diaphragmatic electrical activity with NAVA compared to PS. These results are consistent with the improved patient-ventilator synchrony reported in the literature.
Keywords: Mechanical Ventilation, NAVA, Patient-Ventilator Interaction, Tidal Volume Variability.
1. INTRODUCTION
One of the most important factors determining the success of mechanical ventilation is patient tolerance to the technique, which is intimately linked to the interaction between the patient and the ventilator. During pressure support (PS), which is the most widely used mode of mechanical ventilation, the optimal combination of the patient's spontaneous breathing activity and the ventilator's set parameters can prove very difficult to achieve, (Vignaux et al., 2009). This issue is very important because if the patient and the ventilator engage in a tug-of-war between conflicting goals, rather than sharing the respiratory workload, the work of breathing will paradoxically increase, leading to the prolonged need for mechanical ventilation, (Tobin et al., 2001; Kondili et al., 2003), or in the case of non-invasive ventilation (NIV), to the failure of NIV in avoiding intubation (Carlucci et al., 2001). In NIV, PS is further complicated by leaks at the patient-ventilator interface which interfere with the flow and pressure signals used to set the ventilator. The respiratory centre of the brain controls the characteristics of each breath by the propagation of action potentials along the phrenic nerve to excite diaphragm muscle cells. This signal results in contraction of the muscles in the diaphragm, descent of the diaphragm dome, and a decrease in airway pressure, causing an inflow of air into the lungs.
Neurally Adjusted Ventilator Assist (NAVA) is a relatively new mode of mechanical ventilation, which relies on the detection of the electrical activity in the diaphragm (Eadi) to determine ventilator pressure settings, (Sinderby et al., 1999).
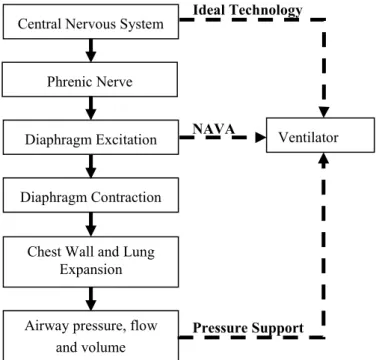
NAVA is an improvement over existing PS systems, because respiratory activity is measured from a much more proximal site relative to the actual nervous system command (diaphragm excitation rather than airway flow signal), as seen in Fig. 1.
Fig. 1. Transduction chain from the brain to the airway opening (adapted from Sinderby et al., 1999)
Central Nervous System
Airway pressure, flow and volume Diaphragm Contraction
Chest Wall and Lung Expansion Phrenic Nerve
Diaphragm Excitation Ventilator Unit NAVA
Pressure Support Ideal Technology
Because NAVA uses a direct expression of respiratory center activity to control the ventilator, it should theoretically allow near-perfect synchronization between the patient and the ventilator, and a more natural and variable form of breathing. Therefore, it is hypothesized that tidal volume (Vt) under NAVA would show better correlation with Eadi compared with PS. In addition, tidal volume is expected to exhibit greater variability due to the variability in the Eadi input to the ventilator. This has a potential clinical outcome as a greater variability has been linked to a better oxygenation (Mutch et al., 2000b). This research aims to confirm these hypotheses by characterizing respiratory variability with different techniques such as coefficient of variation, Poincaré plots and cumulative distribution functions (CDF).
2. METHODOLOGY
2.1 Clinical Method
A comparative study of patient-ventilator interaction was performed for 22 patients during standard PS with clinician determined ventilator settings; and NAVA, with NAVA gain set to ensure the same peak airway pressure as the total pressure obtained in PS. A 20 minute continuous recording was performed in each ventilator mode (equating to approximately 300-400 breaths from each patient in each mode), and Eadi and flow traces were recorded at a frequency of 100Hz. The raw traces were transformed using FFT to remove frequencies greater than 1Hz, to reduce noise. A section of a typical filtered trace is shown in Fig. 2.
0 5 10 15 20 25 30 -600 -400 -200 0 200 400 600 800 F lo w ( m L/ se c) 0 5 10 15 20 25 30-30 -20 -10 0 10 20 30 40 Time (seconds) E ad i ( V )
Fig. 2. Typical Flow (solid line) and Eadi (dashed line) traces.
The patient’s inspiratory effort is determined from the integral of the Eadi signal of each breath. To the authors’ knowledge, it has not previously been investigated if the maximum Eadi value of each breath also correlates directly with the patient’s inspiratory effort. This possible correlation is explored in this study.
2.2 Signal Pre-processing
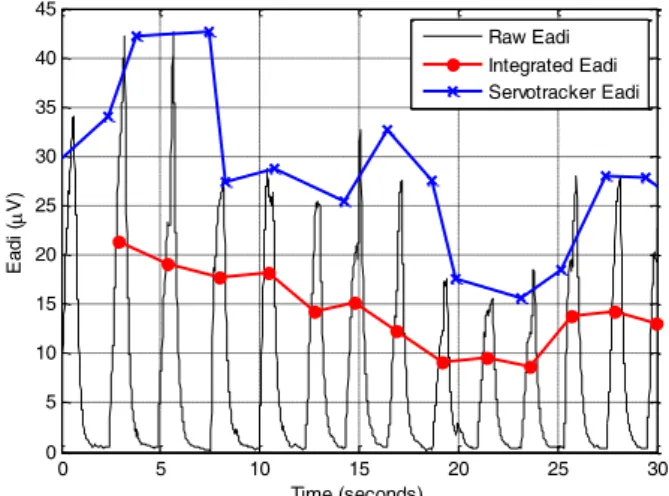
The servo-tracker from the ventilator reports the tidal volumes and maximum Eadi values for each breath. Fig. 3 shows a section of a typical patient’s Eadi trace, with the raw signal shown (solid) along with the integrated Eadi signal (dots) and servo-tracker Eadi (crosses). However it is observed that although the magnitudes are largely accurate, the timing of each breath does not match. In addition, it is the integral of Eadi which gives the power/energy of the signal, and corresponds to the magnitude of the patient’s inspiratory effort, and not the maximum Eadi value. Since breath-to-breath comparisons and variability are required, complete datasets were used, and the Eadi and Vt values were extracted by integrating the respective signals over each breath identified. The approach allows not only the correct timing for each breath, but also provides the integral of the Eadi signal as opposed to the maximum value. If good correlation is observed between the maximum and integrated Eadi signals, this would allow maximum Eadi values to be used in future investigations, which would simplify the analyses.
0 5 10 15 20 25 30 0 5 10 15 20 25 30 35 40 45 Time (seconds) E ad i ( V ) Raw Eadi Integrated Eadi Servotracker Eadi
Fig. 3. Servotracker Eadi and integrated Eadi Signal.
A breath is determined by the flow signal, and is defined to commence when the flow signal becomes positive, and terminate when the flow signal becomes negative. The flow signal is integrated to obtain the tidal volume, and tidal volumes less than 50mL are discarded as artifacts. The Eadi signal is integrated between the same two time points to obtain the corresponding Eadi value.
Correlations are reported between the integrated flow (Vt) and integrated Eadi signals; and between the maximum Eadi value and the integrated Eadi value. Power spectrums also illustrate the synchrony between Vt and Eadi.
Variability is shown in 3 ways:
1. Coefficient of Variation (CV = standard deviation/mean) in tidal volume over all breaths for each patient in each ventilator mode;
2. Poincaré plots of tidal volume show breath-to-breath variability. The tidal volume of the ith breath is
3. Cumulative distribution plots showing percent of Vt and Eadi signals within a pre-determined “variability band” for each patient. Areas are calculated between Eadi and Vt for the 5th-95th
percentiles illustrate degree of synchrony between
Eadi and Vt.
The CV gives a normalized measure of variation, appropriate when it cannot be assumed that different groups have the same mean. However, it is more relevant to a normal distribution, and can be skewed by outliers. In addition, this measure considers Vt independently, and disregards the influence of variability in Eadi. The poincaré plots again investigate Vt independently, but illustrate variability from one breath to the next, as opposed to variability over the 20 minute recording. Cumulative distribution plots are effective in quantifying the spread of data, and are useful in eliminating the effect of outliers. In addition, such plots allow comparison between the variability in Vt and Eadi.
3. RESULTS
3.1 Synchronization
The integral of the Eadi signal is used for determining the electrical activity for each breath, and is in direct relationship with the patient’s inspiratory effort. It has not previously been investigated if the maximum Eadi value of each breath also correlates directly with the patient’s inspiratory effort. In this study, the maximum Eadi value was correlated with the integrated Eadi value for each patient across all breaths. Population statistics for the correlation coefficient across all patients are shown in Table 1.
Table 1. Correlation between maximum and integrated
Eadi (LQ = Lower Quartile; MED = Median; UQ = Upper Quartile)
LQ MED UQ
PS 0.96 0.97 0.98
NAVA 0.93 0.97 0.99
Under PS, the correlation coefficient was 0.96±0.03, and under NAVA, 0.95±0.04 over all 22 patients (mean±standard deviation), showing excellent correlation between maximum and integrated Eadi values, and supporting the premise that the maximum Eadi value at each breath could be used to represent Eadi in future work.
Correlations between the integrated Eadi and flow signals are shown in Table 2 for both NAVA and PS. Under PS, the correlation coefficient was 0.31±0.40, and under NAVA, 0.73±0.23 over all 22 patients (mean±standard deviation). A two-sample Kolmogorov-Smirnov goodness-of-fit hypothesis test shows that the NAVA and PS correlation datasets are significantly different with a p-value of 2.75x10⁻⁵.
Table 2. Correlation between integrated Eadi and flow signals (LQ = Lower Quartile; MED = Median; UQ =
Upper Quartile)
LQ MED UQ
PS 0.18 0.41 0.60
NAVA 0.73 0.79 0.89
As expected, the correlation is much greater for NAVA than PS, indicating that the patient and ventilator are much better synchronized under NAVA than PS.
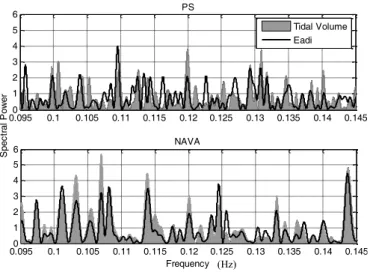
Power spectrums for Vt and Eadi under PS and NAVA are shown in Fig. 4 for a section of the frequency domain for a typical patient, and further illustrate the better correlation observed under NAVA. This result is expected, since NAVA reacts in real-time to the electrical signal from the diaphragm, and adjusts the delivered pressure accordingly. Therefore, the frequency of changes in pressure and thus Vt, should be in synchrony with changes in Eadi in comparison to PS, which is not influenced by Eadi. Lastly, this result illustrates that NAVA promotes breathing exactly when and how (as seen by the magnitude of the Vt) the body demands.
Fig. 4. FFT for a selected frequency range for a typical patient.
3.2 Variability
The coefficient of variation in tidal volume is shown in Table 3. Under PS, the coefficient of variation was 0.13±0.08, and under NAVA, 0.28±0.20 over all 22 patients (mean±standard deviation). Using a two-sample Kolmogorov-Smirnov goodness-of-fit hypothesis test, the PS and NAVA CV datasets were found to be significantly different with a p-value of 0.0015, with the NAVA data set being more variable.
Table 3. Coefficient of Variation (CV) in Vt (LQ = Lower
Quartile; MED = Median; UQ = Upper Quartile)
LQ MED UQ PS 0.07 0.10 0.17 NAVA 0.15 0.20 0.32 0.0950 0.1 0.105 0.11 0.115 0.12 0.125 0.13 0.135 0.14 0.145 1 2 3 4 5 6 Frequency S pe ct ra l P ow er NAVA 0.0950 0.1 0.105 0.11 0.115 0.12 0.125 0.13 0.135 0.14 0.145 1 2 3 4 5 6 PS Tidal Volume Eadi (Hz)
Poincaré plots of the ith versus (i+1)th breath further illustrate the greater variability observed under NAVA. A typical patient is shown in Fig. 5.
0 100 200 300 400 500 600 700 0 100 200 300 400 500 600 700 vt i vt i+ 1 PS NAVA
Fig. 5. Poincaré plot for a typical patient
The poincaré plots and CV values described thus far give the variability in tidal volume as an isolated metric. Over all patients, there is no significant difference in the variability in
Eadi between PS and NAVA ([LQ, MED, UQ] = [0.36, 0.49,
0.81], and [0.33, 0.44, 0.88] for PS and NAVA, respectively, with a two-sample Kolmogorov-Smirnov p-value of 0.82). However, for a given patient over a given time period, the variability in output (Vt) should be dependent on the variability of input (Eadi).
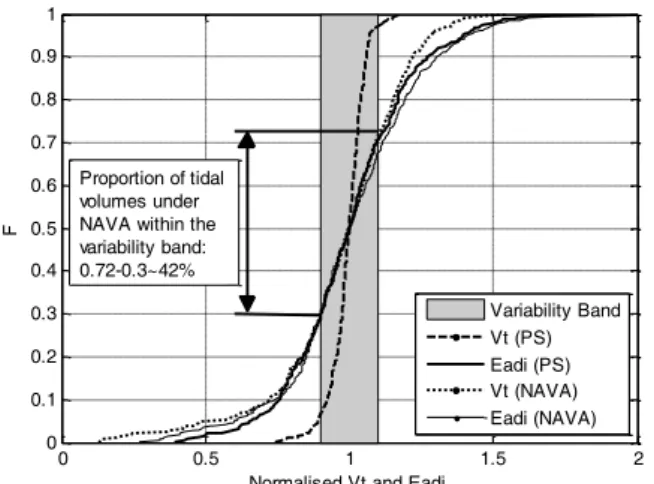
For each patient under both PS and NAVA, the Vt and Eadi values were normalised to their median value, and cumulative distribution plots were generated as seen in Fig. 6. The Eadi signals are very close, but Vt is far more variable for NAVA.
0 0.5 1 1.5 2 0 0.1 0.2 0.3 0.4 0.5 0.6 0.7 0.8 0.9 1
Normalised Vt and Eadi
F Variability Band Vt (PS) Eadi (PS) Vt (NAVA) Eadi (NAVA) Proportion of tidal volumes under NAVA within the variability band: 0.72-0.3~42%
Fig. 6. CDF plot for a typical patient showing range of Eadi and Vt under PS and NAVA.
A variability band of ±10% of the median was defined, such that the proportion of Vt and Eadi values for a specific patient falling outside the band could be used as a measure of variability. It can be seen in Fig. 6 that the variability in Eadi is very similar between PS and NAVA for this patient (59%
and 63% outside the variability band for PS and NAVA, respectively). The variability in tidal volume is comparable for NAVA, with 58% falling outside the variability band. However, the variability in tidal volume is much smaller for PS, with only 9% falling outside the band. The non-parametric population statistics of this type of analysis are shown in Table 4.
Table 4. % Vt and Eadi outside Variability band (LQ =
Lower Quartile; MED = Median; UQ = Upper Quartile)
Mode Metric LQ MED UQ
PS Eadi 62.12 73.59 87.57 Vt 6.45 26.70 39.83 Vt/Eadi* 0.12 0.31 0.57 NAVA Eadi 59.49 64.30 76.94 Vt 39.27 49.34 68.81 Vt/Eadi* 0.61 0.85 0.98 *NAVA and PS significantly different with p-value of 1.16x10⁻⁴ using two-sample Kolmogorov-Smirnov
goodness-of-fit hypothesis test.
These results show that for a given patient-specific variability in Eadi, a much larger variability in tidal volume is observed under NAVA than PS. When a Fisher exact test is performed on the number of breaths with Vt and Eadi inside and outside the variability band, and a cumulative distribution function is plotted of the p-values, Fig. 7 is obtained.
-0.10 0 0.1 0.2 0.3 0.4 0.5 0.6 0.7 0.8 0.1 0.2 0.3 0.4 0.5 0.6 0.7 0.8 0.9 1 P-value P ro po rt io n of p at ie nt s NAVA ~45% PS
Fig. 7. CDF of Fisher exact P-values of Vt and Eadi values inside and outside the variability band.
Fig.7 shows that for all patients under PS, the ratio of breaths inside and outside the variability band is unrelated between
Vt and Eadi (p=0 for all patients). With NAVA, 45% patients
have no significant difference (p>0.05) between Vt and Eadi proportions, indicating that the proportion of breaths with Vt and Eadi inside and outside the variability band is related. Therefore, it is these 45% of patients who could have benefited from the NAVA ventilation mode as opposed to the PS mode.
When the percent Vt outside the variability band is plotted against the percent Eadi outside the band, Fig. 8 is obtained, where the solid line is the line y=x (100% match of
variability). Each individual patient is marked on the plot with a number such that each individual patient’s position under NAVA and PS can be compared.
50 60 70 80 90 100 0 10 20 30 40 50 60 70 80 90 100 1 1 2 2 3 3 4 4 5 5 6 6 7 7 8 8 9 9 10 10 11 11 12 12 13 13 14 14 15 15 16 16 17 17 18 18 19 19 20 20 21 21 22 22 Eadi Variability V t V ar ia bi lit y PS NAVA
Fig. 8. Variability in Vt as a function of variability in Eadi. Fig. 8 shows that for a given variability in Eadi, Vt will have higher variability under NAVA. Note that the 45% of patients who would have benefitted from NAVA (from Fig. 7) are those lying closest the y=x line in Fig 8. It is considered that it is likely to be best for the patient for the variability in Eadi and Vt to be similar (ie closer to the y=x line in Fig. 8), as this outcome would indicate the best correlation between the body's demand (Eadi) and supply (Vt). Future work will examine if higher variability in Vt correlates with better patient outcomes and greater likelihood of successfully disconnecting the patient from the ventilator.
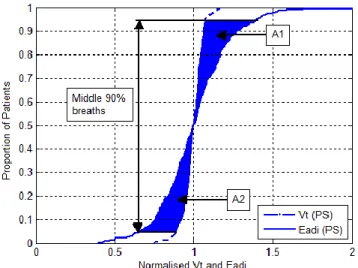
Fig. 6 can also be used to calculate the area between Eadi and
Vt CDF profiles for each patient in each ventilator mode, as
shown in Fig. 9. The population statistics shown in Table 5 illustrate that variability in Vt is much closer to variability in
Eadi under NAVA, by having smaller areas of difference
between these normalized curves. Using a two-sample Kolmogorov-Smirnov goodness-of-fit hypothesis test, the PS and NAVA differences in Eadi and Vt (A1+A2 in Fig. 9) were found to be significantly different with a p-value of 0.00016.
Fig. 9. 90th percentile area between Eadi and Vt CDF
profiles.
Table 5. % Vt and Eadi outside Variability band (LQ =
Lower Quartile; MED = Median; UQ = Upper Quartile)
LQ MED UQ
PS 0.08 0.13 0.26
NAVA 0.03 0.05 0.08
It is observed in Fig. 8 that the variability in Vt is always less than the variability in Eadi, or within 1% of unity, suggesting that the degree of variability observed in Vt is limited by the variability seen in Eadi. A patient’s Vt or Eadi is described as “variable” if x% of its values lie within the variability band. If x is allowed to vary from 0 to 100, then the proportion of patients with a variable Vt given a variable Eadi,
P(Vt=variable|Eadi=variable), can be plotted, as seen in Fig.
10. 0 20 40 60 80 100 0 0.1 0.2 0.3 0.4 0.5 0.6 0.7 0.8 0.9 1
Cut-off for % of values in the variability band being defined as variable
P ro po rt io n of P at ie nt s PS: P(Vt=var|Eadi=var) NAVA: P(Vt=var|Eadi=var)
Fig. 10. Proportion of patients with variable Vt given a variable Eadi.
It is observed that for any reasonable choice of x between 0 and 100, a greater proportion of patients under NAVA have a variable Vt given a variable Eadi. This observation is especially relevant when Eadi is highly variable, as evidenced by the x-intercept of 26% with PS, compared to 8% with NAVA.
4. CONCLUSIONS
22 patients underwent a 20 minute period of mechanical ventilation in PS mode followed by 20 minutes in NAVA mode. Eadi and flow signals were analysed, and it was found that significantly better correlation between Eadi and Vt was achieved in the NAVA ventilation mode, as expected, since in NAVA mode, Eadi determines the pressure settings on the ventilator which then influences flow characteristics.
In addition, it has been shown through a variety of different analyses that for a given variability in Eadi, a higher variability is observed in Vt under NAVA than PS. There is much speculation in the literature that increased breathing
variability is desirable, and is thought to be responsible for increased success in patient separation from the ventilator (Wysocki et al., 2006); and greater recruitment of atelectatic lung units (Mutch et al., 2000b). Future work will aim to correlate the greater tidal volume variability observed under NAVA with better patient outcomes.
REFERENCES
Carlucci, A., Richard, J., Wysocki, M., Lepage, E., Brochard, L. (2001). Noninvasive versus conventional mechanical ventilation. An epidemiologic survey. Am J Respir Crit Care Med, 163:874-80.
Kondili, E., Prinianakis, G., and Georgopoulos, D. (2003). Patient-ventilator interaction. Br J Anaesth, 91:106-19. Mutch, W.A., Harms, S., Lefevre, G.R., Graham, M.R.,
Girling, L.G., Kowalski, S.E. (2000a), Biologically variable ventilation increases arterial oxygenation over that seen with positive end-expiratory pressure alone in a porcine model of acute respiratory distress syndrome. Crit Care Med. 28(7): p. 2457-64.
Mutch, W.A.C., Harms, S., Graham, M.R., Kowalski, S.E., Girling, L.G., and Lefevre, G.R. (2000b). Biologically Variable or Naturally Noisy Mechanical Ventilation Recruits Ateletatic Lung. Am J Respir Crit Care Med, 162:319-323.
Sinderby, C., Navalesi, P., Beck, J., Skrobik, Y., Comtois, N., Friberg, S., Gottfried, S.B., and Lindström, L. (1999). Neural control of mechanical ventilation in respiratory failure. Nat Med, 5(12):1433-6.
Tobin, M.J., Jubran, A., and Laghi, F. (2001). Patient-ventilator interaction. Am J Respir Crit Care Med, 163:1059-63.
Vignaux, L., Vargas, F., Roeseler, J., Tassaux, D., Thille, A.W., Kossowsky, M.P., Brochard, L., and Jolliet, P. (2009). Patient-ventilator asynchrony during non-invasive ventilation for acute respiratory failure: a multicenter study. Intensive Care Med, 35(5): 840-6. Wysocki, M., Cracco, C., Teixeira, A., Mercat, A., Diehl,
J.L., Lefort, Y., Derenne, J.P., and Similowski, T. (2006). Reduced breathing variability as a predictor of unsuccessful patient separation from mechanical ventilation. Crit Care Med, 34(8):2076-2083.