HAL Id: hal-00973475
https://hal-mines-paristech.archives-ouvertes.fr/hal-00973475
Submitted on 4 Apr 2014
HAL is a multi-disciplinary open access
archive for the deposit and dissemination of
sci-entific research documents, whether they are
pub-lished or not. The documents may come from
teaching and research institutions in France or
abroad, or from public or private research centers.
L’archive ouverte pluridisciplinaire HAL, est
destinée au dépôt et à la diffusion de documents
scientifiques de niveau recherche, publiés ou non,
émanant des établissements d’enseignement et de
recherche français ou étrangers, des laboratoires
publics ou privés.
Stochastic power generation
Pierre Pinson, Robin Girard, Patrick Mcsharry
To cite this version:
Pierre Pinson, Robin Girard, Patrick Mcsharry. Stochastic power generation. Hans Hvidtfeldt Larsen,
Leif Sønderberg Petersen. DTU International Energy Report 2013 : Energy storage options for future
sustainable energy systems, Technical University of Denmark, 24-28 - Chapter 6, 2013,
978-87-550-3968-1. �hal-00973475�
Stochastic power generation
Introduction
Our path towards decarbonisation involves the large-scale use of renewable sources – the most prominent contribu-tions being from wind and solar, followed by biomass – to gradually replace fossil fuels for energy production, mainly in the form of heat and electricity. By June 2012, cumula-tive installed wind power capacity worldwide had reached 254 GW and was still increasing rapidly [1]. Ref. [2] gives an extensive introduction to various forms of renewable energy sources among our potential options for the future. Of the various forms of renewable energy sources, some are similar to conventional fuels. Biomass, for instance, includes straw and other waste materials that can be burned in more-or-less conventional furnaces and boilers. Given enough fuel, biomass power plants can be operated and dispatched like their gas or coal equivalents. Dispatch-able power generation units are Dispatch-able to follow market sig-nals and schedule their power production to meet demand. They may also provide ancillary services to the grid, such as support for stabilising voltage and frequency.
In contrast, some other forms of renewable energy are not dispatchable. Indeed, wind farms and solar power plants can be scheduled and controlled only to the extent that their power output can be curtailed if necessary. Renewable energy sources such as wind, solar, wave and tidal power are characterised as variable and of limited predictability. They are formally known as stochastic power sources, meaning that the variation of power production over time can be predicted only partially; it also contains a random component that is inherently uncertain.
The increased share of stochastic power generation in the electricity system certainly is one of the drivers for looking at the various forms of energy storage, which can compen-sate for the limited predictability of wind and solar power. Changing consumption patterns can magnify the issues associated with stochastic power generation. For instance, it is likely that in the future the transport sector will come to rely increasingly on electricity, and this will create a degree of exposure to variations in electricity supply that does not exist in this sector at the moment. Another exam-ple is the increasing tendency of households to generate power via PV panels, or other local generation means, as well as consuming it from the grid. Such “producers/con-sumers” (“prosumers”) may be less predictable in their consumption patterns than traditional consumers, espe-cially since they are more likely to participate in demand
management programmes that encourage them to dynami-cally schedule their use of power and heat.
After a brief overview of the system and market structure, our main emphasis in this chapter is on the issues sur-rounding the variability and predictability of stochastic power generation. Examples are given for wind only, though other stochastic sources of renewable energy would yield qualitatively similar results. We conclude by discuss-ing the implications for the planndiscuss-ing and operation of energy storage facilities.
System and market setup
This section does not aim to give a full overview of the con-text of power system operations in a market environment. Instead we use it to support our choice of the topics most relevant to energy storage and the optimal integration of stochastic power sources. These subjects are then covered in more detail in the sections that follow.
Ref. [3] gives an extensive overview of the challenges in the case of wind energy. Most of these challenges are similar for other forms of stochastic power generation, though some may be technology-specific. In this chapter the main emphasis is on the daily scheduling and operation of power systems, ignoring the role of storage on timescales that are either very short (for example frequency support) or very long (such as smoothing out seasonal variations in wind, sunshine or rainfall).
At present, for most electricity markets, a daily schedule for production and consumption is obtained through a single auction mechanism in the day-ahead market, based on production and consumption offers characterised by quan-tity and price (Figure 14). On the production side, offers are ranked in terms of their short-run marginal costs. This favours stochastic renewable energy sources like wind and solar, since their short-run marginal cost is zero, or even negative if they are subsidised.
The day-ahead market is cleared early in the afternoon before the day of operation. Predictions of power demand and stochastic power generation are therefore needed up to 36 hours ahead so that the corresponding consumption and production offers can be defined. The variability of the electric load is pretty well understood in connection to human activity and the influence of the weather. In con-trast, the variable nature of stochastic power generation is more difficult to appraise. In the past, market and system operators were used to highly accurate load forecasts,
Pierre Pinson, DTU; Robin Girard, MINES ParisTech, Centre for Processes, Renewable Energies and Energy Systems; Patrick McSharry, Smith School for Enterprise and the Environment, University of Oxford
congestion on the grid. Storage located at strategic nodes on the transmission network might alleviate such prob-lems.
Variability of stochastic power generation
Stochastic power generation takes potential energy from the atmosphere, the sun and the oceans, and converts it to electricity via devices such as wind turbines, solar panels, tidal current turbines and wave energy machines. The resulting power output is a direct function of the appropri-ate atmospheric and ocean variables. These in turn have their own natural variability on various scales in time and space, as dictated by complex geophysical phenomena. The power generated by a solar plant, for instance, shows a clear daily cycle. Starting at dawn, solar irradiance increases gradually up to mid-day and then decreases until twilight. On top of this smooth variation may be more abrupt fluctuations as clouds pass across the sun. The hours of daylight and the maximum height of the sun follow an annual pattern, while changing seasonal temperatures may also introduce their own variability by affecting the effi-ciency of the energy conversion process. Similarly, for wind turbines, wind speed is the dominant factor affecting power whereas they now have to deal with renewable energy
fore-casts that are less accurate and more variable. Forecast accuracy has improved considerably over the last 10–15 years [4]. The importance of accurate power generation forecasts from renewables is highly dependent on the mar-ket, the regulatory setup, and the actual penetration of renewable energy.
Electricity production and consumption must be con-stantly balanced to avoid power outages. During the day of operation, any deviations from the day-ahead schedule therefore have to be corrected through the balancing mar-ket. In most cases this means using thermal power plants that are more expensive to run and more polluting than either renewable or conventional baseload plants. As a result, the total operating costs of the power system are influenced by the variability and predictability of renewable sources (see for instance Ref. [5]).
While the grid itself transports energy in space, we can view storage as a way to transport energy in time. The hope is that storage, in smoothing the variability of stochastic power generation, could also help to correct imbalances originating from forecasting errors. We need to account for variability in space as well as in time, since power that is available at the right time but in a different place may cause
Figure 14
Timeline for the daily operation of power markets and systems.
Single-auction market clearing Pay-as-bid Supply Buy Sell Block offers Balancing entities Supply Demand Quantity
Demand System operator
REAL-TIME DAY-AHEAD INTRA-DAY BALANCING
make effective use of its wind resources. Even in less extreme cases, where renewable energy capacity and load centres are spread more evenly across the map, the spatial variability of stochastic generation creates additional power flows on the grid.
Given this variability in space and time, it should not be surprising if aggregating stochastic power generation over wider geographical areas – country, region or even conti-nent – reduces variability, at least in the short term. A number of studies have confirmed this [9] [10]. As long as there is sufficient transmission capacity, the ability to har-vest power from wider areas will reduce the need for stor-age and result in slower rates of charge and discharge. This comes at the expense of potentially prohibitive investment in required transmission capacities.
Finally, the various types of stochastic power generation show different types of variability. For example, ocean swell varies more smoothly than wind speed over short time-scales and distances, though at larger time-scales it may show greater variation than wind speed. As a result, a combina-tion of, say, wind and wave generacombina-tion may result in a smoother power output than either technology could achieve on its own.
output. Wind speed fluctuations are either magnified or dampened through the turbines’ power curves, yielding complex wind power fluctuations. These are better described in the frequency domain. A reference study is that in Ref. [6], where the spectrum of the power output from wind turbines is analyzed, allowing to jointly look at temporal and spatial scales of such fluctuations. Another relevant study is that in Ref. [7], which more specifically focused on the fluctuations of wind speed over the North Sea, a region where it is expected that substantial offshore wind power capacities will be deployed and operated over the coming few decades.
Wind speeds can vary greatly from one day to the next, depending on the local wind climate, which in turn is influenced by both large-scale weather patterns and local thermal effects, for instance sea breezes. Where thermal effects dominate, wind patterns tend to be very similar from one day to the next, as for example on Mediterranean islands and the Red Sea coast. Where winds are driven mainly by larger-scale weather phenomena, as in northern Europe, wind patterns may be totally different from one day to the next. Terrain can also influence wind regimes and wind speed variability over quite small distances. Off-shore wind turbines, for instance, experience generally higher wind speeds, but also stronger swings in output, compared to their counterparts onshore.
Besides the fluctuations in wind speed and power output for periods ranging from seconds to days, it is not yet clear whether wind speeds are changing over the long term as a result of global warming or changes in land use, and if so, whether wind speeds are increasing or decreasing [8]. In any case, any such variation would be too slow to be rele-vant to energy storage.
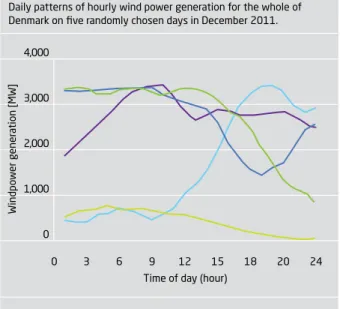
Figure 15 shows wind power generation in Denmark on five randomly chosen days in December 2011. Total Danish wind generating capacity was 3,956 MW at the time. On several of these winter days the wind was very strong at night, yielding wind power generation close to the nominal capacity, and then decreased during the day. On other days, wind power production was low at night but then picked up early in the afternoon. Finally, there were also some days with almost no wind power generation.
As well as temporal variability, spatial variability is also rel-evant because it may require grids to transport large quan-tities of power over long distances. An example is Texas in the USA, which has a large amount of wind power capacity in the western part of the state. Since the main load centres are in the east, Texas requires strong transmission links to
Figure 15
Daily patterns of hourly wind power generation for the whole of Denmark on five randomly chosen days in December 2011.
4,000 3,000 2,000 1,000 0 0 3 6 9 12 15 18 20 24 Time of day (hour)
Windpo
w
er gener
ation [MW]
geographic location, generating plant sizes and size distri-bution, time of day, and weather. As intuitively expected, predictability degrades with increasing forecast lead times. Forecasts for a few minutes to a few hours ahead can be extremely accurate, while predictions with lead times of more than 4–5 days will clearly be of lower quality. Continuing with the example of Denmark, Figure 17 sum- marises the accuracy of 2011 wind power forecasts in west-ern and eastmarises the accuracy of 2011 wind power forecasts in west-ern Denmark as a function of the time of day (corresponding to the hourly divisions of the electricity market). Forecast accuracy is measured in terms of the mean absolute error (MAE): the average absolute percent-age difference between forecast and measurement (so the lower the better).
Since the day-ahead market is cleared at noon on the previ-ous day, the variprevi-ous times on the horizontal axis corre-spond to lead times between 12 and 36 hours. The error increases slowly but surely with the lead time, in the range 4.0– 5.5% of the nominal capacity.
Forecast accuracy is higher for Denmark as a whole than for either of the two regions, thanks to the spatial smooth-ing effect discussed above [10]. For 2011, the total absolute error in wind power forecasts for the whole of Denmark
Predictability of stochastic power generation
Besides damping fluctuations in power generation induced by the natural spatial and temporal variability of stochastic sources, storage could help to accommodate errors in the predictions required by energy markets. As an example we will look at the situation in Denmark on 25 December 2011 (Figure 16).
The forecast issued the previous day indicated that wind power generation would be very high in the morning (at one point even higher than consumption), before falling steadily during the rest of the day. In the event, this is not what happened. The actual power generation was signifi-cantly less than expected, and it reached a minimum earlier than predicted. Over that day, the market required
18,684 MWh from conventional power plants to balance the wind power that did not materialise. This is equivalent to 45% of the wind power predicted for that day, and is also roughly equivalent to the yearly consumption of 4,000 Danish households.
Forecasting errors are not always as extreme as in the above example, but the predictability of stochastic power genera-tion is highly variable. Predictability is influenced by sev-eral factors, notably the type of renewable energy source,
Figure 16
Predicted and actual Danish wind power generation for 25 December 2011. The area between the forecast and observation curves represents the quantity of energy to be balanced throughout that day.
4,000 3,000 2,000 1,000 0 0 3 6 9 12 15 18 20 24 Time of day (hour)
Forecast Actual
Electric load (reference)
Wind po
w
er gener
ation [MW]
Figure 17
Wind power forecast accuracy (mean absolute error) for Denmark in 2011. 6.0 5.5 5.0 4.5 4.0 3.5 0 3 6 9 12 15 18 20 24 Time of day (hour)
DK West DK East DK (whole)
MAE [%% nominal capacity]
Sizing and locating storage in a power system is a complex planning problem which needs to account for the variabil-ity and predictabilvariabil-ity of stochastic power generation, the topology and other characteristics of the network, and the cost of building and operating storage. Storage methods proposed in the literature have most often focused on par-ticular power sources (notably wind and solar), rather than integrated methodologies for the power system as a whole (see, e.g., Refs. [11] and [12]).
One challenge of great relevance is to work out how storage will actually alter the market and the dynamics of the power system, potentially affecting its economic value. An example is energy arbitrage: it is often thought that you can estimate the economic value of storage by simply looking at price differentials in the market. However, if every market participant used storage to maximise the profits from arbi-trage, these price differentials could shrink and eventually vanish.
Overall, we recommend that storage should be part of a portfolio of solutions supporting the integration of diverse sources of stochastic power generation.
was 1.34 TWh, which is roughly equivalent to the yearly consumption of 300,000 Danish households. It fell to the Danish system operator to balance the grid by adjusting thermal power generation either upwards or downwards, and potentially international power exchange, depending on the direction of the forecast error at any particular time. The characteristics of forecast errors are fairly complex to appraise, and this is the reason why optimally operating the electric power system with significant wind power penetra-tion comprises a real challenge.
Challenges for operation and planning
The variability and predictability of stochastic power gener-ation, as described above, present a number of operational and planning challenges when applied to real power sys-tems and markets – whatever technologies are chosen for power generation and storage.
Optimal use of storage requires that we account for the dynamics and uncertain nature of stochastic power genera-tion. This applies both at the time of clearing the market and later, in near real time, when storage is actually called upon to balance deviations from the forecast.
Optimal operating policies first require advanced forecasts in the form of predictive densities or space-time scenarios. These are then used as inputs to purpose-designed stochas-tic optimisation models. If the network has enough storage, in terms of both power output and energy content, one could argue that such complex decision-making is unnec-essary. However, this would result in sub-optimal use of storage assets, perhaps with additional operational costs and shorter life expectancy. The optimal integration of stor-age will also be highly dependent on the type of storstor-age technology, whether it is centralised or distributed, and who operates it (system operator, market participants or final consumers).