HAL Id: hal-01412467
https://hal.archives-ouvertes.fr/hal-01412467
Submitted on 8 Dec 2016HAL is a multi-disciplinary open access
archive for the deposit and dissemination of sci-entific research documents, whether they are pub-lished or not. The documents may come from teaching and research institutions in France or abroad, or from public or private research centers.
L’archive ouverte pluridisciplinaire HAL, est destinée au dépôt et à la diffusion de documents scientifiques de niveau recherche, publiés ou non, émanant des établissements d’enseignement et de recherche français ou étrangers, des laboratoires publics ou privés.
interfacial transition zone (ITS) between cement paste
and aggregates
Etienne Malachanne, Marie Salgues, Mouad Jebli, Frédéric Jamin
To cite this version:
Etienne Malachanne, Marie Salgues, Mouad Jebli, Frédéric Jamin. A cohesive zone model for the char-acterisation of the interfacial transition zone (ITS) between cement paste and aggregates. ECCOMAS Congress 2016, Jun 2016, Crête, Greece. �hal-01412467�
Crete Island, Greece, 5–10 June 2016
A COHESIVE ZONE MODEL FOR THE CHARACTERISATION OF
THE INTERFACIAL TRANSITION ZONE (ITZ) BETWEEN CEMENT
PASTE AND AGGREGATES
Etienne Malachanne1
, Marie Salgues1
, Mouad Jebli2
and Frederic Jamin2 1
Ecole des Mines d’Ales
6 Avenue de Clavieres, 30319 ALES, FRANCE e-mail:{etienne.malachanne,marie.salgues}@mines-ales.fr
2
LMGC UMR UM-CNRS 5508, University of Montpellier 34095 MONTPELLIER CEDEX 5, FRANCE e-mail:{mouad.jebli,frederic.jamin}@umontpellier.fr
Keywords: Interfacial Transition Zone, Tensile strength, Mortar, Cohesive Zone Model
Abstract. Characterization of concrete behavior needs to know mechanical properties of the two phases constituting them : mortar and aggregates. Nevertheless this bi-phasic approach reaches its limits when concrete leaves the elastic domain. At that stage and according to several studies, phenomena which occur at the interface between mortar and aggregates, or in mortar between cement paste and aggregates, must be taken into account. If the occurence of an Interfacial Transition Zone (ITZ), with weak mechanical properties in regard to the two others surrounding them is well knwon, the modeling of this third phase is not settled yet. This study focus on the characterization of the adhesion at interface between cement paste and aggregates. A mortar compounded by two limestone aggregates binded by a cement paste is considered, and tensile tests are performed on a sample of this composite. Based on these experimental results, a numerical study is developed in order to see influence of interface quality in tensile strength. For thar mortar is modeled by finite elements with a cohesive zone model at the interface, substi-tuting ITZ. With the cohesive zone model used, coupling friction and adhesion at the interface, three parameters have to be fitted : normal and tangential stiffness, and decohesion energy. A strong correlation is found between these parameters and tensile strength, but numerical re-sults show also low values of stiffness and decohesion energy at interface. This result could be explained by a partial adhesion between mortar and cement paste in the sample.
1 INTRODUCTION
When concrete is considered as a bi-phasic material represented at a mesoscopic scale, com-pounded by mortar and aggregates, the characterization of its mechanical behavior depends on elastic properties of the two phases, at less until the rupture [21, 16]. Nevertheless an acurate prediction when the elastic limit is reached is often investigated. For that, a damage variable may be introduced and the behavior is described by a volumic model as developed by Pijaudier-Cabot and Mazars [20]. These models allow to describe the post-peak behavior using inverse analysis methods [3], concrete being still represented as a bi-phasic material. In a different way, some studies consider a third phase, the Interfacial Transition Zone (ITZ) between mortar or cement paste and aggregates, as an independant material with weak mechanical properties [18]. In order to take into account this third phase, some numerical studies propose a finite element model representing physically ITZ [15, 10], inducing difficulties particularly in the mesh gen-eration because of the very thin thickness of ITZ in regard to dimensions of other phases [4]. In their experimental and numerical studies, Ke et al. [12, 13] have overcome these difficulties with the development of a micromechanical model, especially for lightweight concrete, in order to predict failure. Other works consider a mechanical damage induced by the quality of the matrix-aggregates interface [14]. In the present study we focus on the caracterization of the mechanical link between cement paste and aggregates.
A non perfect adhesion between two phases, may be modeled by introduction of Cohesive Zone Models (CZM) at the interface. These models provide good description of mechanical behavior, also out of elastic domain [6]. Among various studies using CZM in their numeri-cal models, based on finite elements modelling [17, 7, 23] or with discrete elements [1], the one used in this paper, couples adhesion, friction and unilateral contact [22, 24]. Here, cohe-sive forces directed at interface are both in tangential and normal directions [2]. Cohesion at interface is represented by a damage parameterβ, providing the intensity of adhesion.
The work presented here, deals with a characterization of interface quality, between cement paste and limestone aggregate. For that, the cohesive zone model quoted previously is calibrated on mechanical tests performed on a composite compounded by two cubic samples of limestone linked by a thin thickness of cement paste. For that a three-dimensionnal finite elements model of the composite is carried out using the software LMGC90 [5]. Parameters of CZM law fitted will describe the mechanical properties and the adhesion quality at the interface between cement paste aggregates.
2 MATERIALS AND METHODS 2.1 Experimental sample of concrete
All experimental results come from works of PhD thesis of Mouad Jebli, from University of Montpellier, France. Composite of mortar is realized with two cubic blocks of limestone binded by a thin cement paste, as represented in the Figure 1. Elastic properties of these two materials are obtained by uniaxial compression tests and are summarized in the Table 1.
Material Young’s modulus (GPa) Poisson ratio
Limestone 60 0.3
Cement paste 12.5 0.3
Figure 1: Sample of concrete compounded by two blocks of limestone (10× 15 × 10 mm) binded by a cement paste (10× 2 × 10 mm)
Mechanical tensile tests are carried out on the sample. A velocity of0.01 mm/s is imposed through a tensile test device, as shown by the Figure 2. Sample is loaded until rupture. The onset of cracking and rupture of the sample is recorded with use of a high-speed digital camera. For the calibration of the cohesive zone model, results on 28 days mortar composites have been taken into account.
Figure 2: Tensile test on the concrete sample
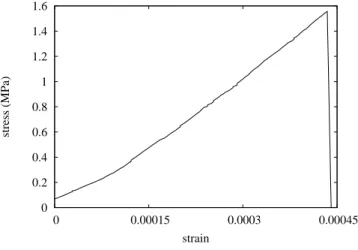
Results of uniaxial tensile test are shown on Figure 3. This curve will be used on the follow-ing to choose parameters of CZM at the interface.
2.2 Cohesive Zone Model
Mathematical developments of the model chosen here, using thermodynamic considerations, are detailed on several works [2, 22]. We will limit in this part to present parameters of the cohe-sive law, and its main constitutive equations. This model considers a non-penetration between two bodies in contact, here cement paste and aggregates. These two materials are meshed by finite elements. The unilateral contact is coupled with friction, coming from Coulomb law
0 0.2 0.4 0.6 0.8 1 1.2 1.4 1.6 0 0.00015 0.0003 0.00045 stress (MPa) strain
Figure 3: Stress (in MPa) vs strain for tensile test on the concrete composite
tween the two materials, and adhesion governing by a state variable which describes the contact state. This variableβ, introduced by Fremond [9], giving the intensity of adhesion between the two bodies in contact, is defined with a damage parameterD included between 0 (no damage) and 1 (rupture) such as :
β = 1 − D (1)
Thus adhesion linked to damage between aggregate and cement paste is : • β = 1 total adhesion
• 0 < β < 1 partial adhesion • β = 0 no adhesion
The thermodynamic description, based on standard material generalized theory [11], needs to define state variables associated to thermodynamical forces. For that one considers the re-versible forces RN and RT associated to the dispalcements uN and uT. Indexes N and T
indicate a decomposition into normal and tengential part on the contact surface. Thus,RN and
RT are considered as normal and tengential contact forces and the displacement is written :
[u] = [uN] .n + [uT] with [uN] = [u] .n (2)
In a same way, the decomposition of contact forces gives :
R = RN.n + RT with RN = R.n (3)
In this problem the state variables areβ, uN anduT, and we introduce a free energy potential
defined such as : ψ(uN, uT, β) = CN 2 u 2 Nβ 2 + CT 2 u 2 Tβ 2 − wb (4)
withCN andCT the normal and tengential stiffness,w the Dupre’s energy and b the adhesion
viscosity coefficient. As explained in works of Raous et al. [22], the main constitutive laws of the contact at the interface come from the subdifferentiation of the free energy potential, and a potential of dissipation, with respect to the state variablesuN, uT andβ. As consequence we
can define the unilateral contact with adhesion :
RN − CN[uN] β 2 ≥ 0 (5) [uN] ≥ 0 (RN − CN [uN] β 2 ) [uN] = 0
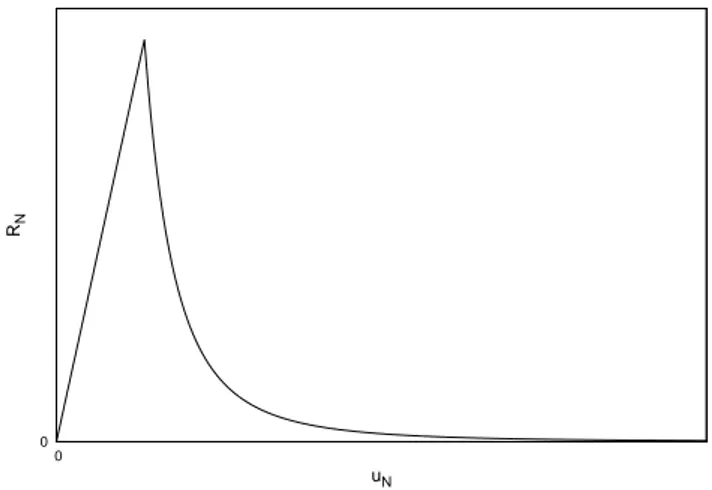
Introducing a fricton coefficient of Coulomb µ, the friction with adhesion is defined by the following equations : ||RT − CT [uT] β 2 || ≥ µ|RN − CN[uN] β 2 | (6) ||RT − CT [uT] β 2 || < µ|RN − CN[uN] β 2 | ⇒ [ ˙uT] = 0 ||RT − CT [uT] β 2 || = µ|RN − CN[uN] β 2 | ⇒ ∃λ > 0, [ ˙uT] = λ(RT − CT [uT] β 2 ) Finally, shape of the cohesive law presented is shown by the curve of the Figure 4 giving the normal reaction with respect to normal displacement. Force-peak represents the limit of adhesion. Indeed at that stage damage occurs at interface, and energy of adhesion, considered as the area under the cruve decreases.
0 0
RN
uN
Figure 4: Shape of the cohesive law
2.3 Numerical computation
All the numerical computations have been proceeded with the open software LMGC90 [5], developed at the University of Montpellier, France, in which the cohesive zone model presented in past section is implemented. A tree-dimensional finite element model of the composite sam-ple has been carried out. A symmetrical geometry has been chosen, as shown by Figure 5, in order to reduce computation time, thus conditions of symmetry will be respected. Geometry is
meshed with hexaedron finite elements H8, and the time step is taken constant and equals to 1 × 10⁻⁴s. A theta-method is chosen for time intregation withθ = 0.55. Boundary conditions
are applied on the lower and upper faces, with a velocityvy = 0.01 mm/s for the tensile load
on the upper, and vertical displacements blocked on the lower due to symmetry.
Figure 5: Meshing of a half composite sample by hexaedron finite elements
Application of the cohesive zone between cement paste and aggregate, is based on contact nodes placed in the contact surface both on cement paste and aggregates. At each time step a detection is realised and rupture occurs when contact is lost between the two bodies. To calibrate cohesive law, several parameters have to be setted : normal and tangential stiffnessCN andCT,
friction coefficient µ, adhesion energy w and adhesion viscosity b. In this model we consider any viscosity at the interface, thusb = 0. Friction coefficient is determinated by experimental study, and µ = 0.4. We assume that adhesion energy, is defined by the experimental curve stress-strain (Figure 3), and calculated as the aera under the curve, until the rupture. Hence :
w = 1
2(1.6 × 10
6
× 0.015 × 10−3) = 12 J/m2 (7)
Hence, adhesion energy calculated here is only the one for the elastic part until rupture, thus according to the Figure 4 presented in the past section we assume that the value corresponding in the cohesive law is near the double,24 J/m2
. We will see in the following if this assumption gives results expected.
Finally, onlyCN andCT have to be fitted with the experimental results. We assume thatCN
=CT, hence their value will be calibrated with several numerical tensile test on the composite
sample.
3 RESULTS
Numerical computation is performed until the peak-stress, and compared with the experi-mental stress-strain curve, the objective being to tend to this curve. On the finite element model, we observe that rupture is represented by a decohesion between the two bodies, as shown by the Figure 6.
As explained previously, in this study two parameters have to be fitted : CN, CT. It appears
Figure 6: Displacement of the two materials after rupture
peak stress along the slope. Influence on these three parameters on the mechanical response are represented of the Figure 7. Value of decohesion energy estimated previously, has to be slightly reduced to bring numerical peak stress closer to the experimental one.
0 0.5 1 1.5 2 2.5 0 0.0001 0.0002 0.0003 0.0004 stress (MPa) strain (m/m) CN=CT=10x1011 Pa/m, w=24 J/m2 CN=CT=5x10 11 Pa/m, w=24 J/m2 CN=CT=4.8x10¹¹ Pa/m, w=22 J/m2 Experimental curve
Figure 7: Influence of parameters CN, CT and w on the mechanical response
Thus, we can observe on Figure 7 that paramaters of cohesive zone model which allow to tend to experimental curve areCN =CT =4.8 × 10¹¹Pa/m and w = 22 J/m2.
4 DISCUSSION
We can first notice a strong correlation between mechanical parameters defined at the in-terface between cement paste and aggregates, and both strain and tensile strength. Moreover numerical results show that with this cohesive zone model, it is possible to tend to experimental results. We can observe that value of decohesion calculated experimentaly, gives a good
estima-tion of the peak stress. The slighly decrease is explained by the interface considered as perfect in the numerical sample which is not the case in the experimental one. As consequence withw fixed by the experiment, only 2 parameters have to be fitted.
Since decohesion occurs only in the ITZ, the latter is substituted by cohesive zones. Thus parameters fitted can be considered as characteristics of the ITZ. A comparison with other studies realised with the same cohesive law, give values of interfacial stiffness higher than the one obtained here. Indeed works of Perales et al. [19], have shown that CN = CT = 2 ×
1018
Pa/m when studies of Fouchal et al. [8] found 1.5 × 10¹⁷
Pa/m. These values depend on material modeled, hydrided Zircaloy for the first and interface between bricks and mortar for the second. In the same way, our values of decohesion energy are also weak, particularly comparing to adhesion between bricks and mortar (0.9 J/mm2
). Two ways may be investigated to explain these low values of interface parameters : parameters identified with numerical computation are not representatives of the real interface properties, or an initial damage occurs at the interface, due to the composite sample fabrication. If the first hypothesis requires other experimental investigations, in particular on a mini-structure of mortar, let us focus on the second through an analysis of Young modulus.
Experimental Young modulus of the composite sample, could be calculated as being the slope of the curve of the Figure 3. Indeed, assuming that until tensile strength, in the linear part, the sample has an elastic behavior, Young modulus is obtained using the Hooke law for an uniaxial tensile test :
Esample =
σ
ε (8)
withσ the stress and ε the strain. Here, according to the Figure 3, Esample = 3.43 GPa. This
value has to be compared with the real Young modulus of the sample, which could be calculated through a serial stiffness. Indeed if we consider that the sample is compounded by three serial elastic bodies, the equivalent stiffness is defined by :
ksample = 1 2 kagg + 1 kp (9) wherekagg andkp are aggregate and paste stiffness defined such as :
kagg,p= Sagg,p× Eagg,p Lagg,p (10) with Sagg = Sp = 100 mm 2
the section of aggregate and cement paste, Lagg = 15 mm the
length of each aggregate and Lp = 2 mm the length of the paste. Thus using these values,
composite stiffness is ksample = 151515 N/mm leading to the theoretical equivalent Young
modulus of the sample :
Eth =
32 × 151515
100 = 48.5 GPa (11)
A noticeable difference is observed between theoretical Young modulus and the one obtained experimentally. This result may be explained by a damage at the interface, due to the interface
quality between aggregate and cement paste, which lead to a fall on the equivalent Young mod-ulus. According to the definition of the damage variable given by Mazars et al. [20], theoretical and experimental Young modulus are binded by the relationship :
Esample = (1 − D)Eth (12)
where the damage variable D is different to zero, inducing an intensity of adhesion β less than 1 at the begining of the computation, as explained by equation (2.2). This observation could indicate a partial adhesion between aggregate and cement paste and explain low values of stiffness and decohesion energy at the interface. Thus the strong correlation between stiffness and adhesion energy at interface, and mechanical behavior of the composite, leads to confirm that tensile rupture is in this case governing by the adhesion quality.
5 CONCLUSION
Cohesive zone model applied to the numerical computation studied here, allows to cali-brate decohesion between cement paste and limestone aggregate, using experimental tensile test on a composite sample compounded by both materials. It is possible to reach experimental stress-strain curve, with values of stiffness at the interface and decohesion energy according to literature. Moreover Young modulus obtained by experimental works and numerical computa-tion, calculating the slope of the stress strain curve, is very small against the theoretical one. Other experimental studies have to be performed to confirm the existence of initial damage at the interface.
REFERENCES
[1] R. de Borst, J. J.C. Remmers, and A. Needleman. Mesh-independent discrete numerical representations of cohesive-zone models. Engineering Fracture Mechanics, 73(2):160– 177, Jan 2006.
[2] A.-S. Bretelle, M. Cocou, and Y. Monerie. Unilateral contact with adhesion and fric-tion between two hyperelastic bodies. International Journal of Engineering Science, 39(18):2015–2032, Dec 2001.
[3] I. Comby-Peyrot, P.-O. Bouchard, F. Bay, and F. Bernard. Numerical aspects of a problem with damage to simulate mechanical behavior of a quasi-brittle material. International Journal of Computational Materials Science and Surface Engineering, 40(3):327–340, 2007.
[4] S. Diamond and J. Huang. The itz in concrete a different view based on image analysis and sem observations. Cement and Concrete Composites, 23(2-3):179–188, Apr 2001. [5] F. Dubois, M. Jean, M. Renouf, R. Mozul, A. Martin, and M. Bagneris. Lmgc90. In
Colloque National en Calcul des Structures. CSMA, 2011.
[6] M. Elices, G.V. Guinea, J. Gmez, and J. Planas. The cohesive zone model: advantages, limitations and challenges. Engineering Fracture Mechanics, 69(2):137–163, Jan 2002. [7] M. Elices, J. Planas, and G.V. Guinea. Fracture mechanics applied to concrete. European
[8] F. Fouchal, F. Lebon, and I. Titeux. Contribution to the modelling of interfaces in masonry construction. Construction and Building Materials, 23(6):2428–2441, Jun 2009.
[9] M. Fremond. Equilibre des structures qui adherent a leur support. Comptes Rendus de l’Academie des Sciences, Paris, 295 (Serie II):913–916, 1982.
[10] F. Grondin and M. Matallah. How to consider the interfacial transition zones in the finite element modelling of concrete? Cement and Concrete Research, 58:67–75, Apr 2014. [11] B. Halphen and Q. S. Nguyen. Plastic and visco-plastic materials with generalized
poten-tial. Mechanics Research Communications, 1(1):43–47, Jan 1974.
[12] Y. Ke, S. Ortola, A.L. Beaucour, and H. Dumontet. Identification of microstructural char-acteristics in lightweight aggregate concretes by micromechanical modelling including the interfacial transition zone (itz). Cement and Concrete Research, 40(11):1590–1600, Nov 2010.
[13] Y. Ke, S. Ortola, A.L. Beaucour, and H. Dumontet. Micro-stress analysis and identification of lightweight aggregates failure strength by micromechanical modeling. Mechanics of Materials, 68:176–192, Jan 2014.
[14] D. Keinde, S. Kamali-Bernard, F. Bernard, and I. Cisse. Effect of the interfacial transition zone and the nature of the matrix-aggregate interface on the overall elastic and inelastic behavior of concrete under compression : a 3d numerical study. European Journal of Environmental and Civil Engineering, 18(10):1167–1176, 2014.
[15] K.M. Lee and J.H. Park. A numerical model for elastic modulus of concrete considering interfacial transition zone. Cement and Concrete Research, 38(3):396–402, Mar 2008. [16] E. Malachanne, R. Sassine, and E. Garcia-Diaz. Numerical model for mechanical behavior
of lightweight concrete and for the prediction of local stress concentration. Construction and Building Materials, 59:180–187, 2014.
[17] F. Moroni and A. Pirondi. Cohesive zone model simulation of fatigue debonding along interfaces. Procedia Engineering, 10:1829–1834, 2011.
[18] C.M. Neubauer, H.M. Jennings, and E.J. Garboczi. A three-phase model of the elastic and shrinkage properties of mortar. Advanced Cement Based Materials, 4(1):6–20, Jul 1996. [19] F Perales, S Bourgeois, A Chrysochoos, and Y Monerie. Two field multibody method
for periodic homogenization in fracture mechanics of nonlinear heterogeneous materials. Engineering Fracture Mechanics, 75(11):3378–3398, 2008.
[20] G. Pijaudier-Cabot and J. Mazars. Damage models for concrete. Handbook of Materials Behavior Models : Failures of Materials, 2:500–512, 2001.
[21] R. R. Prasada, J.O. Olekb, and S. Diamondb. An investigation into the influence of inter-aggregate spacing and the extent of the itz on properties of portland cement concretes. Cement and Concrete Research, 40:1601–1608, 2010.
[22] M. Raous, L. Cangemi, and M. Cocu. A consistent model coupling adhesion, friction, and unilateral contact. Computer Methods in Applied Mechanics and Engineering, 177(3-4):383–399, 1999.
[23] J. Roesler, Glaucio H. Paulino, and C. Park, K.and Gaedicke. Concrete fracture prediction using bilinear softening. Cement and Concrete Composites, 29(4):300–312, Apr 2007. [24] C. Talon and A. Curnier. A model of adhesion coupled to contact and friction. European