HAL Id: tel-01665152
https://tel.archives-ouvertes.fr/tel-01665152
Submitted on 15 Dec 2017
HAL is a multi-disciplinary open access
archive for the deposit and dissemination of sci-entific research documents, whether they are pub-lished or not. The documents may come from teaching and research institutions in France or abroad, or from public or private research centers.
L’archive ouverte pluridisciplinaire HAL, est destinée au dépôt et à la diffusion de documents scientifiques de niveau recherche, publiés ou non, émanant des établissements d’enseignement et de recherche français ou étrangers, des laboratoires publics ou privés.
Investigation of non-equilibrium crystallization of mixed
gas clathrates hydrates : an experimental study
compared to thermodynamic modeling with and without
flash calculations
Quang-Du Le
To cite this version:
Quang-Du Le. Investigation of non-equilibrium crystallization of mixed gas clathrates hydrates : an experimental study compared to thermodynamic modeling with and without flash calculations. Other. Université de Lyon, 2016. English. �NNT : 2016LYSEM002�. �tel-01665152�
NNT: 2016LYSEM002
THÈSE
présentée par
Quang-Du LE
pour obtenir le grade de
Docteur de l’École Nationale Supérieure des Mines de Saint-Étienne
Spécialité : Génie des Procédés
INVESTIGATION DE LA CRISTALLISATION HORS-ÉQUILIBRE
DES CLATHRATES HYDRATES DE GAZ MIXTES: UNE ÉTUDE
EXPÉRIMENTALE COMPARÉE À LA MODÉLISATION
THERMODYNAMIQUE AVEC ET SANS CALCULS FLASH
soutenue à Saint-Étienne, le 09 mars 2016
Membres du jury
Rapporteurs: Ryo OHMURA
Karine BALLERAT-BUSSEROLLES
Keio University, Yokohama, Japan Université Blaise-Pascal, Ingénieure de Recherche CNRS
Examinateurs: Eric CHASSEFIERE
Pierre DUCHET-SUCHAUX Baptiste BOUILLOT
Jean-Michel HERRI
Université Paris-Sud TOTAL SA, Paris EMSE, Co-Encadrant EMSE, Encadrant HDR
Spécialités doctorales Responsables : Spécialités doctorales Responsables
SCIENCES ET GENIE DES MATERIAUX K. Wolski Directeur de recherche MATHEMATIQUES APPLIQUEES O. Roustant, Maître-assistant MECANIQUE ET INGENIERIE S. Drapier, professeur INFORMATIQUE O. Boissier, Professeur GENIE DES PROCEDES F. Gruy, Maître de recherche IMAGE, VISION, SIGNAL JC. Pinoli, Professeur SCIENCES DE LA TERRE B. Guy, Directeur de recherche GENIE INDUSTRIEL A. Dolgui, Professeur SCIENCES ET GENIE DE L’ENVIRONNEMENT D. Graillot, Directeur de recherche MICROELECTRONIQUE S. Dauzere Peres, Professeur
EMSE : Enseignants-chercheurs et chercheurs autorisés à diriger des thèses de doctorat (titulaires d’un doctorat d’État ou d’une HDR)
ABSI Nabil CR Génie industriel CMP
AVRIL Stéphane PR2 Mécanique et ingénierie CIS
BALBO Flavien PR2 Informatique FAYOL
BASSEREAU Jean-François PR Sciences et génie des matériaux SMS
BATTAIA-GUSCHINSKAYA Olga CR Génie industriel FAYOL
BATTON-HUBERT Mireille PR2 Sciences et génie de l'environnement FAYOL
BERGER DOUCE Sandrine PR2 Sciences de gestion FAYOL
BIGOT Jean Pierre MR(DR2) Génie des Procédés SPIN
BILAL Essaid DR Sciences de la Terre SPIN
BLAYAC Sylvain MA(MDC) Microélectronique CMP
BOISSIER Olivier PR1 Informatique FAYOL
BONNEFOY Olivier MA(MDC) Génie des Procédés SPIN
BORBELY Andras MR(DR2) Sciences et génie des matériaux SMS
BOUCHER Xavier PR2 Génie Industriel FAYOL
BRODHAG Christian DR Sciences et génie de l'environnement FAYOL
BRUCHON Julien MA(MDC) Mécanique et ingénierie SMS
BURLAT Patrick PR1 Génie Industriel FAYOL
COURNIL Michel PR0 Génie des Procédés DIR
DAUZERE-PERES Stéphane PR1 Génie Industriel CMP
DEBAYLE Johan CR Image Vision Signal CIS
DELAFOSSE David PR0 Sciences et génie des matériaux SMS
DELORME Xavier MA(MDC) Génie industriel FAYOL
DESRAYAUD Christophe PR1 Mécanique et ingénierie SMS
DOLGUI Alexandre PR0 Génie Industriel FAYOL
DRAPIER Sylvain PR1 Mécanique et ingénierie SMS
FAVERGEON Loïc CR Génie des Procédés SPIN
FEILLET Dominique PR1 Génie Industriel CMP
FRACZKIEWICZ Anna DR Sciences et génie des matériaux SMS
GARCIA Daniel MR(DR2) Génie des Procédés SPIN
GAVET Yann MA(MDC) Image Vision Signal CIS
GERINGER Jean MA(MDC) Sciences et génie des matériaux CIS
GOEURIOT Dominique DR Sciences et génie des matériaux SMS
GONDRAN Natacha MA(MDC) Sciences et génie de l'environnement FAYOL
GRAILLOT Didier DR Sciences et génie de l'environnement SPIN
GROSSEAU Philippe DR Génie des Procédés SPIN
GRUY Frédéric PR1 Génie des Procédés SPIN
GUY Bernard DR Sciences de la Terre SPIN
HAN Woo-Suck MR Mécanique et ingénierie SMS
HERRI Jean Michel PR1 Génie des Procédés SPIN
KERMOUCHE Guillaume PR2 Mécanique et Ingénierie SMS
KLOCKER Helmut DR Sciences et génie des matériaux SMS
LAFOREST Valérie MR(DR2) Sciences et génie de l'environnement FAYOL
LERICHE Rodolphe CR Mécanique et ingénierie FAYOL
LI Jean-Michel Microélectronique CMP
MALLIARAS Georges PR1 Microélectronique CMP
MAURINE Philippe Ingénieur de recherche Microélectronique CMP
MOLIMARD Jérôme PR2 Mécanique et ingénierie CIS
MONTHEILLET Frank DR Sciences et génie des matériaux SMS
MOUTTE Jacques CR Génie des Procédés SPIN
NEUBERT Gilles PR Génie industriel FAYOL
NIKOLOVSKI Jean-Pierre Ingénieur de recherche CMP
NORTIER Patrice PR1 SPIN
OWENS Rosin MA(MDC) Microélectronique CMP
PICARD Gauthier MA(MDC) Informatique FAYOL
PIJOLAT Christophe PR0 Génie des Procédés SPIN
PIJOLAT Michèle PR1 Génie des Procédés SPIN
PINOLI Jean Charles PR0 Image Vision Signal CIS
POURCHEZ Jérémy MR Génie des Procédés CIS
ROBISSON Bruno Ingénieur de recherche Microélectronique CMP
ROUSSY Agnès MA(MDC) Génie industriel CMP
ROUSTANT Olivier MA(MDC) Mathématiques appliquées FAYOL
ROUX Christian PR Image Vision Signal CIS
STOLARZ Jacques CR Sciences et génie des matériaux SMS
TRIA Assia Ingénieur de recherche Microélectronique CMP
VALDIVIESO François PR2 Sciences et génie des matériaux SMS
VIRICELLE Jean Paul DR Génie des Procédés SPIN
WOLSKI Krzystof DR Sciences et génie des matériaux SMS
XIE Xiaolan PR1 Génie industriel CIS
YUGMA Gallian CR Génie industriel CMP
ENISE : Enseignants-chercheurs et chercheurs autorisés à diriger des thèses de doctorat (titulaires d’un doctorat d’État ou d’une HDR)
BERGHEAU Jean-Michel PU Mécanique et Ingénierie ENISE
BERTRAND Philippe MCF Génie des procédés ENISE
DUBUJET Philippe PU Mécanique et Ingénierie ENISE
FEULVARCH Eric MCF Mécanique et Ingénierie ENISE
FORTUNIER Roland PR Sciences et Génie des matériaux ENISE
GUSSAROV Andrey Enseignant contractuel Génie des procédés ENISE
HAMDI Hédi MCF Mécanique et Ingénierie ENISE
LYONNET Patrick PU Mécanique et Ingénierie ENISE
RECH Joël PU Mécanique et Ingénierie ENISE
SMUROV Igor PU Mécanique et Ingénierie ENISE
TOSCANO Rosario PU Mécanique et Ingénierie ENISE
is e à jou r : 29/06/ 2015
Remerciements
« La vie, c’est comme le vent » Il y a 3 ans, pendant l’hiver 2012, j’ai décidé d’amener ma petite famille, et de quitter mon pays pour commencer une nouvelle vie, celle de thésard en France, à 10 000 km du Vietnam. Je savais qu’il y aurait beaucoup de difficulté et j’étais préparé à faire le plus d’efforts possibles.
Cette thèse a été réalisée au sein de l’équipe Hydrate du centre Sciences des Processus Industriels et Naturels (SPIN) de l’école Nationale Supérieure des Mines de Saint-Étienne.
En premier lieu, je remercie chaleureusement mon directeur de thèse M. Jean-Michel HERRI pour m’avoir accueilli dans son équipe, m’avoir encadré et m’avoir conseillé tout au long de ces trois années de thèse. Il m’a apporté son soutien scientifique. J’adresse aussi sincèrement mes remerciements à mon Co-encadrant, M. Baptiste BOUILLOT qui m’a accompagné et m’a apporté le soutien nécessaire pour mener à bien ce travail. Il a été aussi encadrant de ma femme quand elle faisait un master à l’école. Nous lui devons donc beaucoup. Je remercie vivement Mme. Ana CAMEIRAO, qui m’a apporté le soutien nécessaire pour mener à bien ce travail. Je tiens à remercier les membres du jury de ma soutenance. Je remercie M. Eric CHASSEFIERE d’avoir accepté de présider mon jury de thèse. Je remercie également M. Ryo OHMURA et Mme. Karine BALLERAT-BUSSEROLLES d’avoir accepté d’être rapporteur de mon jury de thèse et je remercie aussi M. Pierre DUCHET-SUCHAUX et M. Freddy GARCIA d’avoir accepté de participer à mon jury de thèse. Je souhaite remercier aussi messieurs Fabien CHAUVY, Alain LALLEMAND, Jean-Pierre POYET, Richard DROGO et M. Marc ROUVIERE, pour leur aide technique pendant ma thèse. Sans eux, les travaux présentés dans ce manuscrit n’auraient pas pu être réalisés. J’ai également une pensée pour Alain LALLEMAND qui a pris sa retraite il y a peu de temps.
J’adresse également mes remerciements au personnel administratif, particulièrement Carole BIGOURAUX, Joëlle GUELON, Fabienne DEMEURE, Christine VENDEVILLE et Andrée-Aimée TOUCAS qui m’ont accompagnée tout au long de cette thèse dans mes besoins administratifs.
Je voudrais remercier tous les membres de l’équipe Hydrate qui m’ont très bien accueilli et pour tous les moments qu’on a passé ensemble pendant ces longues années de thèse: Jérome, Fatima, Jerôme, Aurélie, Yamina, Matthias, Pedro, Kien, Aline, Saheb, Son.
Je remercie vivement toutes les personnes de l’EMSE-SE, doctorants, enseignants chercheurs. Grâce à vous, ma thèse a été une expérience enrichissante et agréable à la fois.
Je voudrais dire un « gros » remercie à mes parents qui m’ont toujours soutenu et à la famille de LE-QUANG Duyen, mon grand frère qui m’a aidé beaucoup dans les premiers jours où j’étais en France.
Enfin, un très grand remerciement à mes amours: ma femme Phuong-Anh et ma fille Phuong-Linh pour leurs présences dans ma vie, particulièrement dans ces moments importants. Sans elles, rien n’aurait été possible.
Résumé:
L’activité scientifique du sujet porte sur l’acquisition de données expérimentales et la modélisation de la composition des clathrates hydrates de gaz. Les domaines d’application concernent la séparation et le stockage de gaz, la purification de l’eau, et le stockage d’énergie par matériaux à changement de phase.
L’équipe a mis en évidence il y a quelques années que la composition des hydrates de gaz était sensible aux conditions de cristallisation, et que le phénomène de formation se produisait en dehors de l’équilibre thermodynamique.
Le travail de thèse a permis d’explorer plusieurs modes de cristallisation à partir de solutions de même composition initiale pour observer les différences concernant l’état final, compositions notamment, et les relier à la vitesse de cristallisation.
Suivant le mode de cristallisation, lent ou rapide, l’acquisition des données expérimentales peut prendre de quelques jours à plusieurs semaines. Les expériences sont réalisées en réacteur pressurisé dans lequel nous mesurons en ligne la composition de la phase gaz et de la phase liquide, pour calculer par bilan de matière la composition de la phase hydrate.
Nous avons bien mis en évidence des variations dans la composition de la phase hydrate suivant le mode de cristallisation. Nous avons dû établir un modèle thermodynamique donnant la composition de la phase hydrate à l’équilibre pour des mélanges de gaz qui n’avaient jamais été traité par la littérature, et qui ont donc nécessité des campagnes de mesure extrêmement lentes et donc longues pour être sûr de l’état thermodynamique à l’équilibre.
Nous sommes en cours d’établir un modèle cinétique pour modéliser les écarts à cet état d’équilibre de référence pour nos expériences réalisées à vitesse de cristallisation rapide.
Mots-clés: Clathrate hydrates, Captage et Stockage du CO2, Thermodynamique,
Summary:
The scientific goal of this thesis is based on the acquisition of experimental data and the modeling of the composition of clathrates gas hydrate. The domains of application concern the gas separation and storage, water purification, and energy storage using change phase materials (PCMs).
Our research team has recently demonstrated that the composition of gas hydrates was sensitive to the crystallization conditions, and that the phenomenon of formation was out of thermodynamic equilibrium.
During this thesis, we have investigated several types of crystallization, which are based on the same initial states. The goal is to point out the differences between the initial solution composition and the final solution composition, and to establish a link between the final state and the crystallization rate.
Depending on the rate of crystallization (slow or fast), the acquisition time of experimental data lasted from a few days to several weeks. The experimental tests were performed inside a stirred batch reactor (autoclave, 2.44 or 2.36 litre) cooled with a double jacket. Real-time measurements of the composition of the gas and the liquid phases have been performed, in order to calculate the composition of the hydrate phase using mass balance calculations. Depending on the crystallization mode, we have identified several variations of the composition of the hydrate phase and final hydrate volume.
We have established a successful thermodynamic model, which indicates the composition of the hydrate phase and hydrate volume in thermodynamic equilibrium state using a gas mixture which had never been used before in the literature. So this thermodynamic model has required an extremely slow experimental test. These tests were also long in order to be sure of the thermodynamic equilibrium state.
We are currently establishing a kinetics model in order to model the deviations from the reference point of equilibrium of our experimental tests which were carried out at a high crystallization rate.
Key-words: Gas Hydrates, Thermodynamic, Kinetic, Crystallization, CO2 capture
LIST OF FIGURE
Figure 1: Water molecules forming cages corresponding to hydrate structures, sI, sII and sH ... 26 Figure 2: Comparison of guest molecule sizes and cavities occupied as simple hydrates. Modified from (Carroll, 2014) ... 28 Figure 3: Lattice parameters versus temperature for varius sI Hydrates, modified from (Hester et al., 2007) ... 29 Figure 4: Lattice parameters versus temperature for varius sII Hydrates, modified from (Hester et al., 2007) ... 29 Figure 5: Phase diagrams of methane clathrate hydrates (with P: pressure; T: temperature) (Adisasmito et al., 1991; De Roo et al., 1983; Deaton and Frost, 1946; Falabella, 1975; Galloway et al., 1970; Jhaveri and Robinson, 1965; Kobayashi et al., 1949; Makogon and Sloan, 1994; Marshall et al., 1964; McLeod and Campbell, 1961; Roberts et al., 1940; Thakore and Holder, 1987; Verma, 1974; Yang et al., 2001). ... 34 Figure 6: CH-V Equilibrium of single CO2 at temperature below the ice point. The
simuation curve is obtained with the GasHyDyn simulator, implemented with reference parameters from Table 25 (Dharmawardhana et al., 1980) and Table 26. (Page. 63) and Kihara parameters given in Table 28. (Page. 75). ... 36 Figure 7: CH-V Equilibrium of single CH4 at temperature below the ice point. The
simulation of SI structure is obtained with the GasHyDyn simulator, implemented with reference parameters from Table 25 (Dharmawardhana et al., 1980) and Table 26. (Page. 63) and Kihara parameters given in Table 28. (Page. 75). ... 37 Figure 8: CH-V and CH_SI-V-Lw Equilibrium of single C2H6. The simulation of SI
Structure is obtained with the GasHyDyn simulator, implemented with reference parameters from Table 25 (Dharmawardhana et al., 1980) and Table 26. (Page. 63) and Kihara parameters given in Table 28. (Page. 75). ... 38 Figure 9: CH-V and CH_SII-V-Lw Equilibrium of single C3H8. The simulation of SII Structure is obtained with the GasHyDyn simulator, implemented with
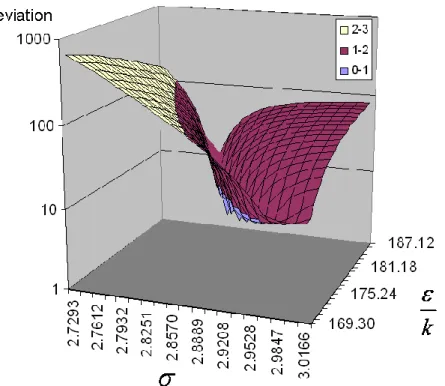
reference parameters from Table 25 (Dharmawardhana et al., 1980) and Table 26. (Page. 63) and Kihara parameters given in Table 28. (Page. 75). ... 39 Figure 10: Schematic of the principle to referring at a hypothetical reference state in order to write the equilibrium between the clathrate hydrate phase and the liquid phase. ... 58 Figure 11: Procedure to optimise the kihara parameters ... 65 Figure 12: Deviation (in %, from Eq.20) between experimental equilibrium data of pure CO2 hydrate Experimental data are from (Yasuda and Ohmura, 2008),
(Adisasmito et al., 1991), (Falabella, 1975), (Miller and Smythe, 1970) which cover a range of temperature from 151.52K to 282.9K and a pressure range from 0.535kPa to 4370kPa... 67 Figure 13 : versus at the minimum deviation with experimental data. a value is taken from Table 27. Pressure and temperature equilibrium data for CO2
hydrate are taken from (Yasuda and Ohmura, 2008), (Adisasmito et al., 1991), (Falabella, 1975), (Miller and Smythe, 1970) which cover a range of temperature from 151.52K to 282.9K and a pressure range from 0.535kPa to 4370kPa. ... 68 Figure 14 : versus at the minimum deviation with experimental data. a value is taken from Table 27. Pressure and temperature equilibrium data for CH4
hydrate are taken from (Fray et al., 2010), (Yasuda and Ohmura, 2008), (Adisasmito et al., 1991) which cover a range of temperature from 145.75 to 286.4K and a pressure range from 2.4kPa to 10570kPa. ... 69 Figure 15 : versus at the minimum deviation with experimental data. a value is taken from Table 27. Pressure and temperature equilibrium data for C2H6
hydrate are taken , from (Roberts et al., 1940), (Deaton and Frost, 1946), (Reamer et al., 1952), (Falabella, 1975), (Yasuda and Ohmura, 2008), (Mohammadi and Richon, 2010a, 2010b), which cover a wide range of temperature from 200.08 to 287.4K and a pressure range from 8.3kPa to 3298kPa. ... 70 Figure 16 : versus at the minimum deviation with experimental data. a value is taken from Table 27. Pressure and temperature equilibrium data for C3H8
hydrate are taken from (Deaton and Frost, 1946), (Yasuda and Ohmura, 2008) and (Nixdorf and Oellrich, 1997) which cover a wide range of temperature from 245 to 278.5K and a pressure range from 41kPa to 567kPa ... 71
k k k k
Figure 17 : versus at the minimum deviation with experimental data. a value is taken from Table 27. Pressure and temperature equilibrium data for CH4-C3H8
hydrate are taken from (Verma et al., 1974) and (Verma, 1974). ... 72 Figure 18 : versus at the minimum deviation with experimental data. SII is assumed. a value is taken from Table 27. Pressure and temperature equilibrium data for Xe- C3H8 hydrate is taken from (Tohidi et al., 1993). ... 73
Figure 19: versus at the minimum deviation with experimental data. SI is assumed. a value is taken from Table 27. Pressure and temperature equilibrium data for Xe-C3H8 hydrate is taken from (Tohidi et al., 1993). ... 73
Figure 20: versus at the minimum deviation with experimental data. a value is taken from Table 27. Pressure and temperature equilibrium data for CO2-C3H8
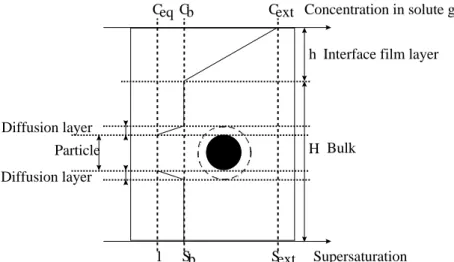
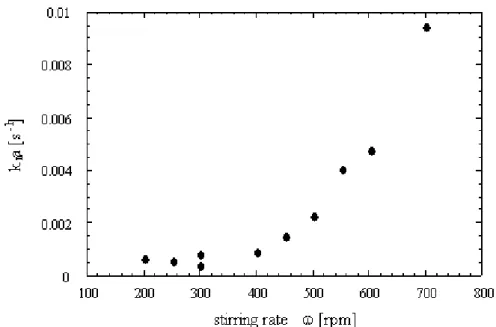
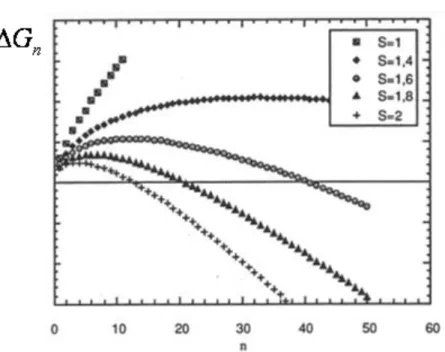
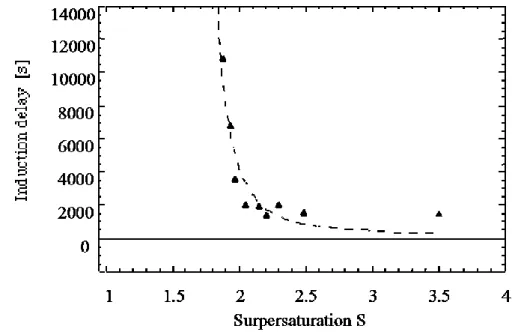
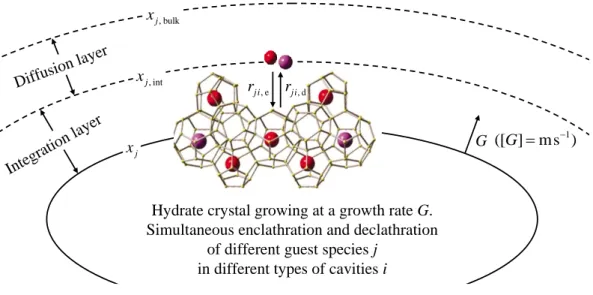
hydrate is taken from (Adisasmito and Sloan, 1992). ... 74 Figure 21: Schematic of the concentration profiles in the environment of a particle in a liquid bulk... 78 Figure 22 : Influence of the stirring rate on the rate of methane dissolution in a stirred batch reactor (Herri et al., 1999a) ... 80 Figure 23 : Shape of the Gibbs energy function during formation of a cluster of n entities, depending on supersaturation (Herri, 1996) ... 85 Figure 24: Induction time versus supersaturation during nucleation of methane hydrate in pure water, at 1°C (Herri et al., 1999b) ... 86 Figure 25: The factor versus angle according to Eq. (45) ... 89 Figure 26: Association of clusters ... 90 Figure 27: Molar fraction of clusters at equilibrium. The index n refers to the number of elementary units of the cluster. S is the value of the supersaturation ... 93 Figure 28 : Elementary steps of gas integration in the vicinity of the growing hydrate surface (Herri and Kwaterski, 2012). ... 96 Figure 29: Double procedure of convergence to calculate the gas hydrate growing rate G, and the gas composition xj, int around the growing hydrate. ... 107 Figure 30: Molar composition of the hydrate phase as a function of the intrinsic growth rates. The liquid phase is supposed to be in equilibrium with a gas phase composed of an equimolar CO2-N2 mixture, at a pressure of 4 MPa and
temperature of 1 °C ... 111 k k k k
Figure 31 : Growth rate of the hydrate phase as a function of the intrinsic growth rate. The liquid phase is assumed to be in equilibrium with a gas phase composed of an equimolar CO2-N2 mixture at a temperature of 1 °C and a
pressure of 4 MPa ... 111
Figure 32: The system of Milli-Q®-AdvantageA10 at SPIN center laboratory ... 113
Figure 33: Experimental set-up ... 116
Figure 34: Schematic of Electromagnetic version of the ROLSITM Sampler injector. ... 117
Figure 35: Schematic of the VARIAN chromatograph (Model 3800 GC) equipped with a TCD detector. ... 118
Figure 36: The system of the ionic chromatography at SPIN laboratory ... 119
Figure 37: The procedure of the high crystallization rate ... 121
Figure 38: P– T evolution during equilibria experiments at high crystallization rate. ... 121
Figure 39: The procedure of the low crystallization rate. ... 122
Figure 40: P – T evolution during equilibrium experiment at low crystallization rate. ... 122
Figure 41: Chromatogram of a liquid sample - Analysis of Lithium ... 123
Figure 42: Calibration curve of the ionic chromatography ... 124
Figure 43: GC principle ... 124
Figure 44: Calibration curve of gas chromatograph ... 127
Figure 45: Chromatogram of a sample of CO2-N2 mixtures ... 129
Figure 46: Experimental equilibrium data of CO2-N2 gas hydrate at high driving force compared with GasHyDyn predictions ... 139
Figure 47: Experimental equilibrium data of CO2-CH4-C2H4 gas hydrate at high driving force compare with GasHyDyn predictions ... 141
Figure 48: Experimental equilibrium data of CO2-CH4-C2H4 gas hydrate at low driving force compare with GasHyDyn predictions ... 142
Figure 49: Experimental equilibrium data of CH4-C3H8 gas hydrate at high and low driving force ... 145
Figure 50: Experimental equilibrium data of CH4-C2H6-C3H8 gas hydrate at low driving force ... 147
Figure 52: Basic hydrate flash algorithm. ... 155
Figure 53: Thermodynamic path (Bouillot and Herri, 2016). ... 156
Figure 54: Algorithm to perform hydrate flash calculation with no reorganization of the crystal phase (framework I) (Bouillot and Herri, 2016). ... 159
Figure 55: Mixed hydrate growth (no reorganization) (Bouillot and Herri, 2016). ... 160
Figure 56: Algorithm to perform hydrate flash calculation with reorganization of the hydrate phase during crystallization (framework II) (Bouillot and Herri, 2016). ... 161
Figure 57: Hydrate growth with crystal phase reorganization (framework II*) (Bouillot and Herri, 2016). ... 162
Figure 58: PT diagram of experimental and predicted results of the reference case (CO2-CH4-C2H6) at different temperatures from the same initial state. ... 164
Figure 59: Predicted and experimental thermodynamic paths (Pressure vs temperature during crystallization) in the reference case (left: all frameworks at different numbers of iterations; right: framework I, N=7). ... 167
Figure 60: Schematic of the calculation of the Volume of Reactor ... 201
Figure 61: Schematic of calibration of Gas Chromatography (GC) ... 203
Figure 62: Calibration curve of gas chromatograph of CO2-N2 gas mixture ... 205
Figure 63: Calibration curve of gas chromatograph of CH3-C3H8 gas mixture ... 206
Figure 64: Calibration curve of the gas chromatograph for CO2-CH4 ... 207
Figure 65: Calibration curve of the gas chromatograph for C2H6-CH4 ... 207
LIST OF TABLE
Table 1: Structure of gas hydrates ... 27 Table 2: Molar Masses of Some Hydrates at 0oC ... 30
Table 3: Densities of Some Hydrates at 0oC (Carroll, 2014) ... 32
Table 4: CH_SI-V-Lw Equilibrium of CO2-CH4 from (Bouchemoua et al., 2009). The
simulation curve is obtained with the GasHyDyn simulator, implemented with reference parameters from Table 25 (Dharmawardhana et al., 1980) and Table 26. (Page 63) and Kihara parameters given in Table 28. (Page. 75). ... 40 Table 5: CH_SI-V-Lw Equilibrium of CO2-CH4 from (Le Quang, 2013). The
simulation curve is obtained with the GasHyDyn simulator, implemented with reference parameters from Table 25 (Dharmawardhana et al., 1980) and Table 26. (Page. 63) and Kihara parameters given in Table 28. (Page. 75). ... 40 Table 6: CH_SI-V-Lw Equilibrium of CO2-CH4 from (Belandria et al., 2011). The
simulation curve is obtained with the GasHyDyn simulator, implemented with reference parameters from Table 25 (Dharmawardhana et al., 1980) and Table 26. (Page. 63) and Kihara parameters given in Table 28. (Page. 75). ... 41 Table 7: CH_SI-V-Lw Equilibrium of CO2-CH4 from (Seo et al., 2000). The simulation
curve is obtained with the GasHyDyn simulator, implemented with reference parameters from Table 25 (Dharmawardhana et al., 1980) and Table 26. (Page. 63) and Kihara parameters given in Table 28. (Page. 75). ... 42 Table 8: CH_SI-V-Lw Equilibrium of CO2-CH4 from (Fan and Guo, 1999). The
simulation curve is obtained with the GasHyDyn simulator, implemented with reference parameters from Table 25 (Dharmawardhana et al., 1980) and Table 26. (Page. 63) and Kihara parameters given in Table 28. (Page. 75). ... 43 Table 9: CH_SI-V-Lw Equilibrium of CO2-CH4 from (Ohgaki et al., 1996). The
simulation curve is obtained with the GasHyDyn simulator, implemented with reference parameters from Table 25 (Dharmawardhana et al., 1980) and Table 26. (Page. 63) and Kihara parameters given in Table 28. (Page. 75). ... 43 Table 10: CH_SI-V-Lw Equilibrium of CO2-CH4 from (Adisasmito et al., 1991). The
reference parameters from Table 25 (Dharmawardhana et al., 1980) and Table 26. (Page. 63) and Kihara parameters given in Table 28. (Page. 75). ... 44 Table 11: CH_SI-V-Lw Equilibrium of CO2-CH4 from (Hachikubo et al., 2002). The
simulation curve is obtained with the GasHyDyn simulator, implemented with reference parameters from Table 25 (Dharmawardhana et al., 1980) and Table 26. (Page. 63) and Kihara parameters given in Table 28. (Page. 75). ... 45 Table 12: CH_SI-V-Lw Equilibrium of CO2-CH4 from (Unruh and Katz, 1949). The
simulation curve is obtained with the GasHyDyn simulator, implemented with reference parameters from Table 25 (Dharmawardhana et al., 1980) and Table 26. (Page. 63) and Kihara parameters given in Table 28. (Page. 75). ... 46 Table 13 : CH_SI-V-Lw Equilibrium of CH4-C2H6 from (Adisasmito and Sloan, 1992).
The simulation curve is obtained with the GasHyDyn simulator, implemented with reference parameters from Table 25 (Dharmawardhana et al., 1980) and Table 26. (Page. 63) and Kihara parameters given in Table 28. (Page. 75). ... 46 Table 14: CH-V-Lw Equilibrium of CH4-C3H8 from (Verma et al., 1974). The
simuation curve is obtained with the GasHyDyn simulator, implemented with reference parameters from Table 25 (Dharmawardhana et al., 1980) and Table 26. (Page. 63) and Kihara parameters given in Table 28. (Page. 75). ... 47 Table 15: CH-V-Lw Equilibrium of CH4-C3H8 from (Deaton and Frost, 1946). The
simulation curve is obtained with the GasHyDyn simulator, implemented with reference parameters from Table 25 (Dharmawardhana et al., 1980) and Table 26. (Page. 63) and Kihara parameters given in Table 28. (Page. 75). ... 48 Table 16: CH-V-Lw Equilibrium of CH4-C3H8 from (McLeod and Campbell, 1961).
The simulation curve is obtained with the GasHyDyn simulator, implemented with reference parameters from Table 25 (Dharmawardhana et al., 1980) and Table 26. (Page. 63) and Kihara parameters given in Table 28. (Page. 75). ... 49 Table 17: CH-V-Lw Equilibrium of CH4-C3H8 from (Thakore and Holder, 1987). The
simulation curve is obtained with the GasHyDyn simulator, implemented with reference parameters from Table 25 (Dharmawardhana et al., 1980) and Table 26. (Page. 63) and Kihara parameters given in Table 28. (Page. 75). ... 50 Table 18: CH-V-Lw Equilibrium of C2H6-C3H8 from (Mooijer-Van den Heuvel, 2004).
with reference parameters from Table 25 (Dharmawardhana et al., 1980) and Table 26. (Page. 63) and Kihara parameters given in Table 28. (Page. 75). ... 51 Table 19: CH-V-Lw Equilibrium of CO2-CH4-C2H6 from (Le Quang, 2013). The
simulation curve is obtained with the GasHyDyn simulator, implemented with reference parameters from Table 25 (Dharmawardhana et al., 1980) and Table 26. (Page. 63) and Kihara parameters given in Table 28. (Page. 75). ... 52 Table 20: CH-V-Lw Equilibrium of CO2-CH4-C2H6 from (Kvenvolden et al., 1984).
The simulation curve is obtained with the GasHyDyn simulator, implemented with reference parameters from Table 25 (Dharmawardhana et al., 1980) and Table 26. (Page. 63) and Kihara parameters given in Table 28. (Page. 75). ... 53 Table 21: CH-V-Lw Equilibrium of CH4-C2H6-C3H8 from (Le Quang, 2013). The
simulation curve is obtained with the GasHyDyn simulator, implemented with reference parameters from Table 25 (Dharmawardhana et al., 1980) and Table 26. (Page. 63) and Kihara parameters given in Table 28. (Page. 75). ... 53 Table 22: CH-V-Lw Equilibrium of CH4-C2H6-C3H8 C4H10(-1) from (Le Quang, 2013).
The simulation curve is obtained with the GasHyDyn simulator, implemented with reference parameters from Table 25 (Dharmawardhana et al., 1980) and Table 26. (Page. 63) and Kihara parameters given in Table 28. (Page. 75). ... 54 Table 23 : CH-V-Lw Equilibrium of CH4-C2H6-C3H8 C4H10(-1) from (Le Quang, 2013).
The simulation curve is obtained with the GasHyDyn simulator, implemented with reference parameters from Table 25 (Dharmawardhana et al., 1980) and Table 26. (Page. 63) and Kihara parameters given in Table 28. (Page. 75). ... 55 Table 24: Correlations to calculate the , , and a.kihara parameters as a function of the pitzer acentric factor and critical coordinates Pc, Tcand Vc ... 60 Table 25: Mascroscopic parameters of hydrates and Ice (Sloan, 1998; Sloan and Koh, 2007) ... 63 Table 26: Reference properties of hydrates from (Sloan, 1998; Sloan and Koh, 2007) 63 Table 27: Kihara parameters after optimisation on experimental data (Herri et al., 2011) and compared to litterature ... 66 Table 28: Kihara parameters, after optimisation from experimental data with the GasHyDyn simulator, implemented with reference parameters from Table 25 (Dharmawardhana et al., 1980) and Table 26. ... 75
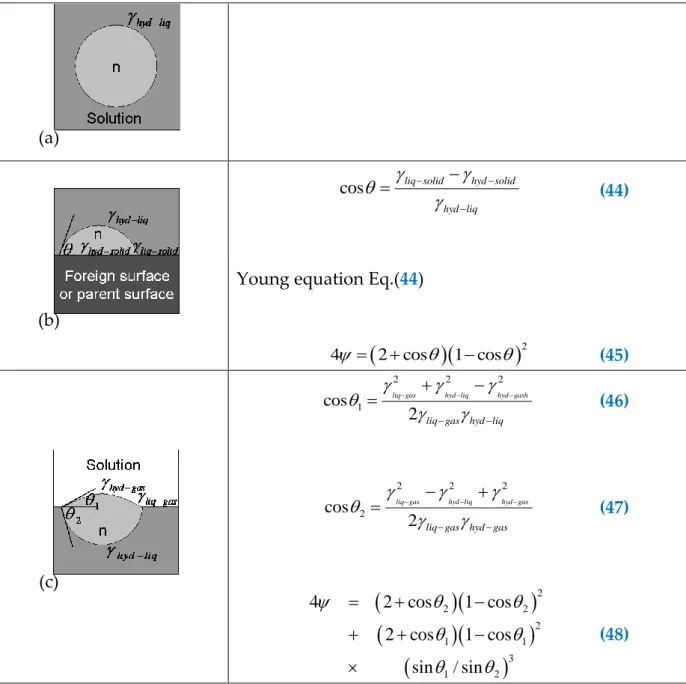
Table 29: Nucleation of cluster of n building units, in homogeneous condition (a), at the surface of foreign surface or parent surface (b), at a gas/liquid interface (c). is a factor between 0 and 1 to quantify the decrease in the critical Gibbs Energy. is the interfacial energy between the phases, hyd=hydrate phase, liq=liq solution,
gas=gas, solid=foreign or parent phase (Kashchiev and Firoozabadi, 2002a,
2002b). ... 88
Table 30: Occupancy factor of enclathrated molecules as a function of the composition in the liquid phase. The equations of the right-hand column are obtained from the classical Langmuir expressions from Eq. (73) (left column) upon replacing xj by the expression of Eq. (93) (right column). ... 103
Table 31: Purity of Helium gas used in our experiments ... 113
Table 32 : The physical properties of Lithium nitrate (LiNO3) ... 114
Table 33: Molar composition of the experiments gas mixtures (standard deviation about 3%) ... 115
Table 34 : Operating conditions of the chromatogram ... 126
Table 35: SRK parameters ... 130
Table 36: Constants for calculating Henry’s constant (Holder et al., 1980) ... 133
Table 37: Molar composition of the studied gas mixtures and initial conditions of experiments. ... 137
Table 38: CH_SI-V-Lw Equilibrium of CO2-N2 at quick crystallization rate procedure versus predicted results ... 138
Table 39: CH_SI-V-Lw Equilibrium of CO2-CH4-C2H6 at high crystallization rate procedure versus predicted results. ... 140
Table 40: CH_SI-V-Lw Equilibrium of CO2-CH4-C2H6 at low crystallization rate procedure versus predicted results. ... 142
Table 41: CH_SI-V-Lw Equilibrium of CH4-C3H8 at high crystallization rate procedure. ... 143
Table 42: CH_SI-V-Lw Equilibrium of CH4-C3H8 at low crystallization rate procedure. ... 144
Table 43: Experimental and predicted pressures for the first data obtained in each experiments (CH4-C3H8) ... 146
Table 44 : CH_SI-V-Lw Equilibrium of CH4-C2H6-C3H8 at high crystallization rate (Le Quang, 2013) ... 148
Table 45: CH_SI-V-Lw Equilibrium of CH4-C2H6-C3H8 at low crystallization rate
procedure. ... 148 Table 46: Quick Kihara parameters optimization of CO2, CH4 and C2H6 on a few
experimental data (Adisasmito et al., 1991; Avlonitis, 1988; Dyadin, 1996; Y. A. Dyadin et al., 1996; Yurii A. Dyadin et al., 1996; Englezos and Bishnoi, 1991; Larson, 1955; Le Quang et al., n.d.; Nixdorf and Oellrich, 1997; Thakore and Holder, 1987; Yasuda and Ohmura, 2008) (* data from (Sloan and Koh, 2007)) 163 Table 47: Experimental versus predicted results for the reference case (CO2, CH4 and
C2H6) from classic thermodynamic calculations assuming a SI structure. ... 164
Table 48: Experimental versus predicted results for the reference case (CO2, CH4 and
C2H6) from classic thermodynamic calculations assuming a SI structure. ... 166
Table 49: Influence of the Kihara parameters uncertainties on the flash hydrate results (framework I, reference case). ... 167 Table 50: Framework I (n=5 and 20) and II* predictions compared to experimental results at quick crystallization (gas 1-2 from CO2-CH4 mixtures and 3-4-5 from
CO2-CH4-C2H6 mixtures) and slow crystallization (reference case of the present
study) ... 169 Table 51: Constants necessary for the calculation of the compressibility factor... 200 Table 52: Experiment data ... 202 Table 53: The results of the calculation ... 202 Table 54: Experiment results ... 204
TABLE OF CONTENTS
1. INTRODUCTION ... 21 2. GAS HYDRATES ... 25
2.1. STRUCTURE OF GAS HYDRATES ... 25 2.2. PHYSICAL PROPERTIES OF GAS HYDRATES ... 30
2.2.1 Molar Mass 30
2.2.2 Density 31
2.2.3 Volume of Gas in Hydrate 32
2.2.4 The Hydration Number 33
2.2.5 Phase diagrams of the hydrates 33
3. EQUILIBRIUM DATA ... 35 3.1. PURE HYDRATES ... 36
3.1.1 CO2 Clathrate Hydrate equilibrium data 36
3.1.2 CH4 Clathrate Hydrate equilibrium data 37
3.1.3 C2H6 Clathrate Hydrate equilibrium data 38
3.1.4 C3H8 Clathrate Hydrate equilibrium data 39
3.2. MIXED HYDRATES ... 40 3.2.1 CO2-CH4 Clathrate Hydrate equilibrium data 40
3.2.2 CO2-C2H6 Clathrate Hydrate equilibrium data 46
3.2.3 CH4-C3H8 Clathrate Hydrate equilibrium data 47
3.2.4 C2H6-C3H8 Clathrate Hydrate equilibrium data 51
3.2.5 CO2-CH4-C2H6 Clathrate Hydrate equilibrium data 52
3.2.6 CH4-C2H6-C3H8 Clathrate Hydrate equilibrium data 53
3.2.7 CH4-C2H6-C3H8 C4H10(-1) Clathrate Hydrate equilibrium data 54
4. THERMODYNAMIC OF GAS HYDRATES ... 57 4.1. MODELLING OF ... 57 4.2. MODELLING OF ... 61 4.3. ADJUSTMENT OF MODELS PARAMETERS ... 63 4.3.1 Determination of the reference parameters 64 4.3.2 Determination of the kihara parameters 66
5. HYDRATES UNDER NON EQUILIBRIUM CONDITIONS ... 77
H w β w
5.1. INTRODUCTION ... 77 5.2. GENERALITIES ABOUT THE CRYSTALLIZATION OF GAS
HYDRATES ... 78 5.3. MODELLING THE GAS/LIQUID TRANSFER IN A BATCH
REACTOR ... 79 5.4. MODELLING THE NUCLEATION ... 80 5.4.1 Primary nucleation from the model of Volmer and Weber (1926) 81 5.4.2 Primary nucleation from a rigorous kinetic approach 89 5.4.3 Primary nucleation for chemical engineers 93
5.4.4 Secondary nucleation 94
5.5. MODELLING THE GROWTH ... 95
5.5.1 Enclathration during crystallisation 98
5.5.2 Discussion 108
5.5.3 Numerical application 109
5.6. Conclusion ... 112
6. MATERIALS AND METHODS ... 113
6.1. CHEMICALS ... 113
6.1.1 Deionized water (H2O) 113
6.1.2 Helium (He) 113
6.1.3 Lithium Nitrate (LiNO3) 114
6.1.4 Gas mixtures (CO2, N2, CH4, C2H6, C3H8) 114
6.2. EXPERIMENTAL DEVICE ... 115 6.3. EXPERIMENTAL PROCEDURE ... 120
6.3.1 High crystallization rate 120
6.3.2 Low crystallization rate 121
6.4. OPERATING PROTOCOLS ... 123 6.4.1 Determination of the concentration of lithium by ionic
chromatography. 123
6.4.2 Calibrating the gas chromatograph (TCD) 124
6.4.3 Mass balance calculation 129
7. EXPERIMENTALS RESULTS AND DISCUSSIONS... 137 7.1. CO2-N2 GAS MIXTURES ... 138
7.3. CH4-C3H8 GAS MIXTURES ... 143
7.4. CH4-C2H4-C3H8 GAS MIXTURES ... 147
7.5. Conclusion ... 149
8. FLASH CALCULATION ... 151
8.1. INTRODUCTION ... 151 8.2. STATE OF THE ART ... 152
8.2.1 Usual flash calculations 152
8.2.2 Flash hydrate modeling 153
8.3. BASIC ALGORITHM ... 154 8.4. HYDRATE FLASH ALGORITHM WITHOUT CRYSTAL
REORGANIZATION ... 157 8.5. HYDRATE FLASH ALGORITHM WITH CRYSTAL
REORGANIZATION ... 161 8.6. KIHARA PARAMETERS OPTIMIZATION ... 162 8.7. RESULTS ... 163
8.7.1. Thermodynamic equilibrium 163
8.7.2. Flash results 165
8.8. KIHARA UNCERTAINTIES ... 167 8.9. MIXED HYDRATE CRYSTALLIZATION ... 168 8.10. CONCLUSION ... 170
9. CONCLUSION ... 173 10. LIST OF SYMBOLS ... 175 11. REFERENCES ... 183 12. APPENDIX 1:CALCULATION OF THE VOLUME OF REACTOR ... 199 13. APPENDIX 2:CALIBRATION OF GAS CHROMATOGRAPHY ... 203 14. APPENDIX 3:EVALUATION OF ERRORS CALCULATION ... 209
1. I
NTRODUCTIONThe Gas hydrates are encountered in many systems where the pressure is high enough and the temperature low enough to cristallize the liquid water and the gas phase in a solid called clathrate hydrate.
Applications of gas hydrate formation are numerous and a complete reviewing has been achieved in the framework of the French ANR national program called SECOHYA coordinated by our team: - gas production from methane hydrate bearing sediments and CO2 injection, - natural gas storage and transportation under
the form of pellets, - thermal storage by using slurries of semi-clathrates hydrates from quaternary ammonium salts, - separation of gases: methane, nitrogen, carbon dioxide, - food preservation by using ozone clahtrates. The applications currently developed in our team are Air conditioning (Darbouret et al., 2005; Douzet et al., 2013), CO2 capture (Duc et al., 2007; Galfré et al., 2014; Herri et al., 2014, 2011;
Herslund et al., 2013), and Methane hydrate bearing sediments for gas production
(Tonnet and Herri, 2009). We collaborate also with other teams to develop science on Food preservation (Muromachi et al., 2013), Sequestration (Burnol et al., 2015) or technology on Waste Wate treatment.
On other hand, gas hydrate formation is a main concern as a risk in the oil production, especially in deep sea pipelines where they can plug the facilities by forming both a crust on the pipelines, and also increasing the viscosity of fluids. This subject has been a main concern for our team and still continues to be (Cameirao et al., 2012; Fidel-Dufour et al., 2005; Herri et al., 2009; Leba et al., 2010).
Lastly, Gas Hydrates are a concern in astrophysics and planetary sciences as its formation, even at very low pressure conditions, is still possible due to the exceptional low temperature. For example, our team is collaborating on the possible methane enclathratation during seasonal cycles on Mars. It could explain the anormal preservation of methane in the Martian atmosphere (Chassefière et al., 2013; Herri and Chassefière, 2012).
In each of the applications, the experimentations and modelling imply to develop knowledge about thermodynamics and kinetics. In fact, the process of crystallization of gas hydrates involves many elementary steps such as nucleation, growth, agglomeration, attrition….. Each of the steps is depending on a driving force (i.e. super-saturation) in between equilibrium conditions (thermodynamic) actual conditions. Actual conditions are governed in the end by mass transfers of gases from the gas phase to the hydrate structure. For example, in a liquid bulk solution, the gas fraction in the liquid is dependent, on one side of the rate of gas dissolution at the Gas/liquid interface, and dependent on the other side of the gas consumption
rate by hydrate crystallization (to be more precise, dependent at the first order of the growth rate).
My work is a contribution to evaluate the composition of gas hydrate under a null-driving force (experiments at pseudo equilibrium) and under high null-driving force. In fact, from theoretical speculations, (Herri and Kwaterski, 2012) has justified that the composition could not only fixed by thermodynamic, but could be also dependent on the relative rates of mass transfers of the different gases.
It opened for my team, a new field of research, because it allows orientating the crystallization in a favorable direction, for example in gas separation process such as the capture of CO2, and it introduces the possibility to modify the crystallization
with the use of kinetic additives or specific geometries.
For my proper concern, the possibility to form hydrate under un-equilibrium conditions opened a main question irelative to the flow assurance management for oil production. In factthe volume of hydrates that are formed could be badly evaluated from simulators working at equilibrium conditions.
This manuscript is organized as following:
The first part of the document deals with structure (Chapter 2), composition (Chapter 3) and thermodynamic modeling (Chapter 4) of gas hydrates. It gives the fudamentals to model equilibrium conditions.
As said before, my work has been conducted half under equilibrium conditions, and half under non equilibrium conditions. Chapter 5 is a focus to couple kinetics and thermodynamics and to show how much the composition of gas hydrate could be not only dependent on thermodynamics but also on kinetics.
Following is my first personal contribution. It has been to monitor experimentally the compositions of hydrates under equilibrium and non-equlibrium conditions (Chapters 6 and 7) by using an original experimental proctocol developed in the our laboratory during the Ph.D. work of A. Bouchemoua (Herri et al., 2011). On my side, I designed two experimental procedures, under low rate or high rate of cristallisation, and I observed the difference in the composition of the hydrates that are formed from a same mixture. The gas mixture has been choiced to be representative of the oil production industry, CO2, CH4, C2H6, C3H8.
My second concern has been to support the modelling approach from two points of view:
- Firstly, I gave equilibrium data to implement our in-house simulation software, called GasHyDyn (presented at the beginning of section §3 Page 21).
In the document, we show the difficulty in retrieving thermodynamic paramaters from the experiments, because of the difficulty to be sure that the data are at equilibrium, and/or because of the necessity to run complex mixtures as some gas hydrates formers can not form pure gas hydrates.
- Secondly, I gave non-equilibrium data and supported a new approach to model the composition of hydrates from a flash calculation (Chapter 8), and to understand the composition of hydrates not from a kinetic modelling as given in Chapter 5, but from a succession of quasi-equilibrium.
As a conclusion of this work, we emphasize that equilibrium of hydrate from gas mixture needs to perform experiments at a very low rate, and so during very long time of experiments, from weeks to months.
2. G
ASH
YDRATES2.1. STRUCTURE OF GAS HYDRATES
The clathrates are ice-like compounds in the sense that they correspond to a re-organisation of the water molecules to form a solid. The crystallographic structure is based on H-bonds. The clathrates of water are also designated improperly as “porous ice” because the water molecules build a solid network of cavities in which gases, volatile liquids or other small molecules could be captured.
The clathrates of gases, called gas hydrates, have been studied intensively due to their occurrence in deep sea pipelines where they cause serious problems of flow assurance.
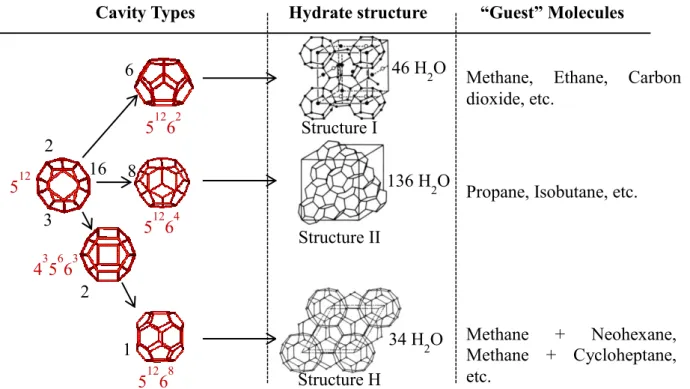
There are two structures of hydrates commonly encountered in the petroleum business (Sloan and Koh, 2007). These are called structure I and structure II, sometimes referred to as type I and II. A third structure of hydrate that also may be encountered is structure H (structures I and II hydrates can form in the presence of a single hydrate former, but structure H requires two formers to be present, a small molecule, such as methane, and a larger type H forming molecule), but it is less commonly encountered (Carroll, 2014). Each structure is a combination of different types of polyhedra sharing faces between them. (Jeffrey, 1984) suggested the nomenclature (ef) to describe the polyhedra to form the primitive cells (where (e) is the number of edges, and (f) the number of faces). Currently, three different structures have been established precisely, called I, II and H (Sloan, 1998; Sloan and Koh, 2007).The three structures are formed by a total of five different water cavities are the 512, 51262, 51264, 51268 and the 435663 (Sloan, 1998; Sloan and Koh, 2007). A
schematic of these cavities may be found in Figure 1 which shows the polyhedra involved in structure I, II and H. On this figure, the water molecule is on the corner of the polyhedral. The edges represent hydrogen bonds. The physical properties of the hydrate cavities and unit cells are provided inTable 1.Structures I, II, and H will be reviewed in more detail throughout this part. In its pure form, the unit cell of the structure I (sI) hydrate contains two small 512 and six large 51262 cavities, in which
only methane, ethane and carbon dioxide of the natural gas components stabilize the structure. Structure II (sII) hydrate contains sixteen small 512 cavities and eight large
51264 cavities. The large cavity in sII can contain larger molecules (up to 6.6 Å, see in Figure 2). This means that propane and iso-butane can stabilize this large cavity. Alternatively, small cavities can be filled with methane, which means that natural gas with propane or iso-butane typically forms sII hydrates. Methane will form sI hydrate by filling both the large and the small cavities, but not sII because the molecules are too small to stabilize the large cavities in sII. Both of these unit cell lattice structures belong to the cubic type. The structure H (sH) hydrate is contains three 512, two 435663 and one 51268 cavities, being significantly more complex (Sum et
al., 2009). This hydrate structure forms a hexagonal unit cell. A given hydrate structure is typically determined by the size and shape of the guest molecule. Each cavity may encapsulate one or in rare cases more guest molecules of proper sizes. Of course, the presence of the guest molecule is necessary to stabilize the crystalline water structure at temperatures well above the normal freezing point.
Figure 1:Water molecules forming cages corresponding to hydrate structures, sI, sII and sH
Based on the knowledge about the hydrate structure for a given gas composition, it is possible to calculate the relative water/guest ratio known as the ideal hydration number:
𝑛ℎ𝑦𝑑 =
𝑛𝑢𝑚𝑏𝑒𝑟 𝑜𝑓 𝑤𝑎𝑡𝑒𝑟 𝑚𝑜𝑙𝑒𝑐𝑢𝑙𝑒𝑠
𝑛𝑢𝑚𝑏𝑒𝑟 𝑜𝑓 𝑔𝑎𝑠 𝑚𝑜𝑙𝑒𝑐𝑢𝑙𝑒𝑠 (1)
Pure methane will occupy the 2 small and the 6 large cavities of sI. With 46 water molecules in a unit cell, the ideal hydration number becomes 5.75. For an natural gas mixture of methane, ethane and propane, where propane and ethane stabilize the 8 large cavities of sII, methane enter the 16 small cavities, and the unit cell has 136 water molecules, the ideal hydration number becomes 5.67 (Figure 1 and Figure 2).
512 51262 51264 435663 51268 6 8 1 2 3 16 2
Cavity Types Hydrate structure “Guest” Molecules
46 H2O 34 H2O 136 H2O Structure I Structure II Structure H
Methane, Ethane, Carbon dioxide, etc.
Propane, Isobutane, etc.
Methane + Neohexane, Methane + Cycloheptane, etc.
Table 1: Structure of gas hydrates
SI SII SH
Cavity 512 51262 512 51264 512 435663 51268
Type of cavity
(j: indexing number) 1 2 1 3 1 5 4
Typical formers CH4, C2H6, H2S, CO2 N2, C3H8, i-C4H10 See belowo
Number of cavities (mj) 2 6 16 8 3 2 1 Average cavity radius (nm)(1) 0.395 0.433 0.391 0.473 0.391 0.406 0.571 Variation in radius, % (2) 3.4 14.4 5.5 1.73 Coordination number 20 24 20 28 20 20 36 Number of water molecules 42 136 134
Cell parameters (nm) a0= 1.1956 (3) a0=1.7315 (4) a=1.2217, b=1.0053 (5) Thermal expansivity 1 a a T (6)
2 1 2 0 3 0 a a T T a T T 2 3 0 2 3 1 0 0 0 0 1 exp 2 3 a a a a a T T T T T T a 4 1 7 2 11 3 1.1280 10 2 1.800310 3 1.589810 a a a 5 1 8 2 11 3 6.7659 10 2 6.1706 10 3 6.2649 10 a a a Cell volume (nm3) 1.709 (3) 5.192 (4) 1.22994 (5) (1) From (Sloan, 1998, p. 33)(2) Variation in distance of oxygen atoms from centre of cages (Sloan, 1998, p. 33). (3) For ethane hydrate, from (Udachin et al., 2002).
(4) For tetrahydrofuran hydrate, from (Udachin et al., 2002).
(5) For methylcyclohexane-methane hydrate, from (Udachin et al., 2002). (6) From (Hester et al., 2007).
o 2-methylbutane, dimethylbutane, 2,3-dimethylbutane, 2,2,3-trimethylbutane, 2,2-dimethylpentane, 3,3-2,2-dimethylpentane, methylcyclopentane, ethylcyclopentane, methylcyclohexane, cycloheptane, and cyclooctane. Most of these components are not commonly found in natural gas.
Figure 2:Comparison of guest molecule sizes and cavities occupied as simple hydrates. Modified from(Carroll, 2014)
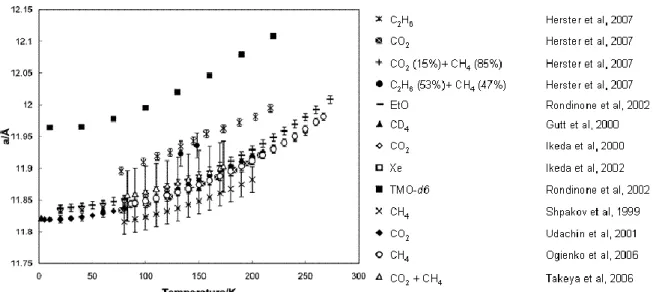
More details about the cell parameters can be found in (Hester et al., 2007). They measured the hydrate lattice parameters for four Structure I (C2H6, CO2, 47% C2H6 +
53% CO2, and 85% CH4 + 15% CO2) and seven Structure II (C3H8, 60% CH4 + 40% Ar Kr N2 O2 CH4 Xe, H2S CO2 C2H6 c-C3H8 (CH2)3O C3H8 Iso-C4H10 n-C4H10 4Å 5Å 6Å 7Å No hydrates ?? (hydrogen hydrates)
Structure II- large and small cavities sII: 512 + 51264
Structure I- large and small cavities sI: 512 + 51262
Structure I- large cavities only sI: 51262
Structure II- large cavities only sII: 51264
Structure H- large, medium and small cavities sH: 512 + 435663 + 51268
C3H8, 30% C2H6 + 70% C3H8, 18% CO2 + 82% C3H8, 87.6% CH4 + 12.4% i-C4H10, 95%
CH4 + 5% C5H10O, and a natural gas mixture). The measurements have been
compared to literature data with Structure I (Figure 3) from EtO (Rondinone et al., 2003), CD4(Gutt et al., 2000), CO2(Ikeda et al., 1999), Xe (Ikeda et al., 2000), TMO-d6
(Rondinone et al., 2003), CH4 (Ogienko et al., 2006; Shpakov et al., 1998), CH4+CO2
(Takeya et al., 2006), and Structure II (Figure 4) from THF (Tse, 1987), TMO-d6
(Rondinone et al., 2003), C3H8(Chakoumakos et al., 2003; Hester et al., 2007; Jones et
al., 2003), CH4+C2H6(Rawn et al., 2003), Air (Takeya et al., 2000), THF-d8 (Jones et al.,
2003). (Hester et al., 2007) conclude that both sI and sII hydrates, with a few exceptions, had a common thermal expansivity, independent of hydrate guest, following the correlation given in Table 1.
Figure 3: Lattice parameters versus temperature for varius sI Hydrates, modified from (Hester et al., 2007)
Figure 4: Lattice parameters versus temperature for varius sII Hydrates, modified from (Hester et al., 2007)
2.2. PHYSICAL PROPERTIES OF GAS HYDRATES
2.2.1 MOLAR MASS
The molar mass (molecular weight) of a hydrate can be determined from its crystal structure and the degree of saturation (An exception is CSMHYD, which does give saturation values). Then, the newer CSMGEM gives composition of the hydrate phase, but not specifically the cell saturation). The molar mass of the hydrate, M, is expressed as follow(Carroll, 2014):
𝑀 =𝑁𝑤𝑀𝑤 + ∑ ∑ 𝑌𝑖𝑗𝑣𝑖𝑀𝑗 𝑛 𝑖=1 𝑐 𝑗=1 𝑁𝑤+ ∑ ∑𝑛 𝑌𝑖𝑗𝑣𝑖 𝑖=1 𝑐 𝑗=1 (2)
where NW is the number of water molecules per unit cell (46 for Structure I, 136 for
Structure II, and 34 for Structure H, (see on Table 1)),MWis the molar mass of water,
Yij is the fractional occupancy of cavities of structure i by component j, vi is the
number of structure i cavities, 𝑛 is the number of cavities of structure i (two for both Structure I and II, but is three for Structure H), and c is the number of components in the cell.
Although this equation looks fairly complicated, it is just accounting for all of the molecules present and then using a number average to get the molar mass.
Table 2:Molar Masses of Some Hydrates at 0oC
(Note: calculated usingEq.(2).The saturation values were calculated using CSMHYD)
Saturation
Gas Hydrate
structures
Small Large Molar mass (g/mol) Methane I 0.8723 0.9730 17.74 Ethane I 0.0000 0.9864 19.39 Propane II 0.0000 0.9987 19.46 Iso-Butane II 0.0000 0.9987 20.24 CO2 I 0.7295 0.9813 21.59
On Table 2 summarizes the molar masses of a few hydrate formers. It is a little surprising that the molar masses of all six components are approximately around
equal (17÷22g/mol). This is because the hydrate is composed mostly of water (18.015 g/mol).
It is interesting that the molar masses of hydrates are a function of the temperature and the pressure, since the degree of saturation is a function of these variables. We usually think of molar masses as being constants for a given substance.
2.2.2 DENSITY
The density of a hydrate, 𝜌, can be calculated using the following formula below
(Carroll, 2014): 𝜌 =𝑁𝑤𝑀𝑊+ ∑ ∑ 𝑌𝑖𝑗𝑣𝑖𝑀𝑗 𝑛 𝑖=1 𝑐 𝑗=1 𝑁𝐴𝑉𝑐𝑒𝑙𝑙 (3)
Where 𝑁𝐴 is Avogadro’s number (6.023.1023 molecules/mole), 𝑉𝑐𝑒𝑙𝑙 is the volume of
the unit cell (Table 1), NW is the number of water molecules per unit cell), MW is the
molar mass of water, Yij is the fractional occupancy of cavities of structure i by
component j, vi is the number of structure i cavities, 𝑛 is the number of cavities of
structure i (two for both Structure I and II, but is three for Structure H), and c is the number of components in the cell.
Eq. (3) can be reduced for a single component in either a Structure I or Structure II hydrate to:
𝜌 =𝑁𝑤𝑀𝑤 + (𝑌1𝑣1+ 𝑌2𝑣2)𝑀𝑗
𝑁𝐴𝑉𝑐𝑒𝑙𝑙 (4)
Again, although Eq. (3) and (4) look complicated, they are just accounting for the number of molecules in a unit cell of hydrate. The mass of all these molecules divided by the unit volume of the crystal gives the density of the hydrate.
The densities of some pure hydrates at 0oC are given in Table 3. Note that the
densities of the hydrates of the hydrocarbons are similar to ice. At last, for an empty hydrate structure, the formula is simple:
𝑀 = 𝑁𝑤𝑀𝑤
Table 3:Densities of Some Hydrates at 0oC(Carroll, 2014) Hydrate structure (I, II, or H) Density (g/cm3) Methane I 0.913 Ethane I 0.967 Propane II 0.899 Isobutane II 0.934 CO2 I 1.107 Ice - 0.917 Water - 1.000
This equation gives a density of 790 kg/m3 for structure I and 785kg/m3 for structure
II. It is a usefull equation to calculate the hydrate volume from the crystallized mass of water.
2.2.3 VOLUME OF GAS IN HYDRATE
Some interesting properties of methane hydrate at 0°C: the density is 913 kg/m3, the
molar mass (molecular weight) is 17.74 kg/kmol, and methane concentration is 14.1 mol percent-this means there are 141 molecules of methane per 859 molecules of water in the methane hydrate.
This information can be used to determine the volume of gas in the methane hydrate. From the density, 1 m3 of hydrate has a mass of 913 kg. Converting this to
moles, 913/17.74 = 51.45 kmol of hydrate, of which 7.257 kmol are methane.
Ideal gas law can be used to calculate the volume of gas when expanded to standard conditions (15 oC and 1 atm or 101.325 kPa)
𝑉 =𝑛𝑅𝑇
𝑃 =
(7.257)(8.314)(15 + 273.15)
Therefore, 1 m3 of hydrate contains about ~170 Sm3 of methane gas at standard
conditions (15 oC and 1 atm or 101.325 kPa). According to Kvenvolden (Kvenvolden,
1993)1m3 gas hydrate may release about 164 m3 methane and 0.8 m3 of water under
standard temperature and pressure (STP) condition.
2.2.4 THE HYDRATION NUMBER
An important property is the hydration number. This value describes the relationship between the water molecules and molecules (Thiam, 2008). The knowledge of this property directly provides information which corresponds to a correct structure is given by Eq. (1) (section §2.1. Page. 25).
If all the cavities were completely occupied, the hydration number corresponds to the ratio between the number of water molecules, and the number of cavities. However, experience shows that the cavities are partially occupied, and that we must define an occupancy rate, to which we return more detail in the section on Thermodynamics modelling. The actual number of hydration is given by:
𝑛ℎ𝑦𝑑 =
𝑛𝑢𝑚𝑏𝑒𝑟 𝑜𝑓 𝑤𝑎𝑡𝑒𝑟 𝑚𝑜𝑙𝑒𝑐𝑢𝑙𝑒𝑠 𝑝𝑒𝑟 𝑢𝑛𝑖𝑡 𝑐𝑒𝑙𝑙
∑𝐶𝑗=1𝑇 ∑𝑁𝑖=1𝑇 𝑣𝑖𝜃𝑗𝑖 (7)
Where 𝒗𝒊 is the number of cavities of the type 𝑖 per molecule of water, 𝜃𝑗𝑖 is the
occupancy rate of cavities 𝑖 by each gas 𝑗 (the occupancy rate is a function of thermodynamic conditions (pressure and temperature) and specific physical properties to the gas molecule, such as size, shape, or its mode of interaction with host molecules), 𝐶𝑇 is the number of species of present gases, 𝑁𝑇 is the number of
different cavities in the elementary network. If we know the number of hydration and the formed structure, can then determine other physical quantities such that the molar volume or density.
2.2.5 PHASE DIAGRAMS OF THE HYDRATES
Phase diagrams define stability regions of gas hydrates and the existing phases in the system. Usually, these phase diagrams represent the liquid-hydrate equilibrium in pressure vs temperature. Indeed, for a given temperature, knowing the pressure is directly linked to the knowledge of the gas solubility (thus the gas molecule concentration in the liquid phase). Figure 5 shows the phase diagram of methane from literature.
Figure 5:Phase diagrams of methane clathrate hydrates (with P: pressure; T: temperature)(Adisasmito et al., 1991; De Roo et al., 1983; Deaton and Frost, 1946; Falabella, 1975; Galloway et al., 1970; Jhaveri and Robinson, 1965; Kobayashi et al., 1949; Makogon and Sloan, 1994; Marshall et al., 1964; McLeod and Campbell, 1961;
Roberts et al., 1940; Thakore and Holder, 1987; Verma, 1974; Yang et al., 2001).
On this figure, four different phases coexist around point M: ice, liquid water, gas, and hydrate. The lower left side (zone I) corresponds to the ice phase. The upper left side (zone G) corresponds to hydrate phase. Between the two zones is the ice-hydrate equilibrium curve. The bottom right area (zone L) is the liquid aqueous phase, and the upper right the hydrate phase again (zone H). Between zone L and H is the liquid-hydrate equilibrium. Between zones I and L is the ice-liquid equilibrium.
Based on the model of (Klauda and Sandler, 2005), a prediction for the distribution of methane hydrate in ocean sediment is presented on a 1° latitude by 1° longitude (1° × 1°) global grid. From that detailed prediction, it is estimated that the global gas hydrates in marine sediments contain 1.2 × 10¹⁷ m3 of methane gas (expanded to
atmospheric conditions), or, equivalently, 74 400 Gt of CH4 in ocean hydrates, which
is 3 orders of magnitude larger than worldwide conventional natural gas reserves. Of this number, (Klauda and Sandler, 2005) estimated that 4.4 × 10¹⁶ m3 of methane
expanded to Standard Temperature and Pressure (STP) exists on the continental margins, which represents one of the largest sources of hydrocarbon on Earth.
Zone G
Zone I
Zone H
Zone L
3. E
QUILIBRIUMD
ATAThe NIST Standard Reference Database #156 is an open access data base which gives the equilibrium data in multiphase systems with Clathrate Hydrates (CH), Vapor (V), Liquid water (Lw) or Ice (I), Liquid hydrocarbon (LHC) for many pure
components or mixtures. This data base extends the data from (Sloan, 2005, 1998): (http://gashydrates.nist.gov/).
The data base implemented in our in-house software, GasHyDyn, also offers a free access to many equilibrium data. All the following equilibrium data are extracted from this data base. The GasHyDyn database has been completed from the NIST database, literature survey and our own experimental data.
Gashydyn software is developed at Saint-Etienne School of Mines by The Hydrate team. It is based on classic Van der Waals and Plateeuw model for the prediction of gas hydrate equilibria with the constant of Parrish and Prausnitz. This software predicts the thermodynamics and the cage occupancy of stable hydrate structures (sI, sII, and sH) from a given pressure or temperature and gas phase composition: (http://www.emse.fr). This software can also be used for both pure and mixed gas hydrates. The software allows takes in account constants ∆𝜇𝑤0, ∆𝐶𝑝0, ∆ℎ𝑤0 and 𝑎,
∆vw0, ∆μ w 0 , ∆C
p0, ∆hw0 from different authors. More details can be founded in section
of the thermodynamic (presented in section §4. Page. 57).
In the next subsection will be provided pure and mixed hydrate equilibrium data. These data are relevant to this work since the same gas molecules were used.
3.1. PURE HYDRATES
3.1.1 CO2 CLATHRATE HYDRATE EQUILIBRIUM DATA
Figure 6: CH-V Equilibrium of single CO2 at temperature below the ice point. The
simuation curve is obtained with the GasHyDyn simulator, implemented with reference parameters from Table 25(Dharmawardhana et al., 1980) and Table 26.
3.1.2 CH4CLATHRATE HYDRATE EQUILIBRIUM DATA
Figure 7: CH-V Equilibrium of single CH4 at temperature below the ice point. The
simulation of SI structure is obtained with the GasHyDyn simulator, implemented with reference parameters from Table 25(Dharmawardhana et al., 1980) and Table
26. (Page. 63) and Kihara parameters given in Table 28. (Page. 75). 0.000001 0.00001 0.0001 0.001 0.01 0.1 1 10 0 50 100 150 200 250 300 Temperature [K] P [ M P a ] Fray et al, 2010
Yasuda and Ohmura, 2008 Mohammadi and Richon, 2008 Makogon and Sloan, 1995 Falabella and Vanpee, 1974 Delsemme and Wenger, 1970 Deaton and Frost, 1946 sI-GasHyDyn simulation
3.1.3 C2H6CLATHRATE HYDRATE EQUILIBRIUM DATA
Figure 8: CH-V and CH_SI-V-Lw Equilibrium of single C2H6. The simulation of SI
Structure is obtained with the GasHyDyn simulator, implemented with reference parameters from Table 25(Dharmawardhana et al., 1980) and Table 26. (Page. 63)
and Kihara parameters given in Table 28. (Page. 75).
1 10 100 1000 10000 200 220 240 260 280 300 Temperature [K] Pre s s u re [ k Pa ] Avlonitis et al, 1988
Mohammadi and Richon, 2010 Yasuda and Ohmura, 2008 Deaton and Frost,1946 Holder and Grigoriou, 1980 Holder and Hand, 1982 Reamer et al., 1952 Robert et al., 1940 Deaton and Frost, 1946 Falabella, 1975
Galloway et al, 1970
3.1.4 C3H8CLATHRATE HYDRATE EQUILIBRIUM DATA
Figure 9: CH-V and CH_SII-V-Lw Equilibrium of single C3H8. The simulation of SII
Structure is obtained with the GasHyDyn simulator, implemented with reference parameters from Table 25(Dharmawardhana et al., 1980) and Table 26. (Page. 63)
and Kihara parameters given in Table 28. (Page. 75). 10 100 1000 240 250 260 270 280 290 Temperature [K] P re s s u re [ k P a ] Goddard, 1981
Holder and Kamath, 1982 Yasuda and Ohmura, 2008 Deaton and Frost, 1946 Englezos and Ngan, 1993 Kubota and al, 1984 Verma, 1974
Nixdorf and Oellrich, 1997 Patil, S.L., 1987
Reamer et al, 1952 Robinson and Mehta, 1971 Miller and Strong, 1946 Thakore and Holder, 1987