HAL Id: tel-01570329
https://tel.archives-ouvertes.fr/tel-01570329
Submitted on 29 Jul 2017HAL is a multi-disciplinary open access archive for the deposit and dissemination of sci-entific research documents, whether they are pub-lished or not. The documents may come from teaching and research institutions in France or
L’archive ouverte pluridisciplinaire HAL, est destinée au dépôt et à la diffusion de documents scientifiques de niveau recherche, publiés ou non, émanant des établissements d’enseignement et de recherche français ou étrangers, des laboratoires
preclinical diagnosis applications
Gonzalo Ramírez Garcia
To cite this version:
Gonzalo Ramírez Garcia. Physicochemical characterization and biocompatibility studies of persis-tent luminescence nanoparticles for preclinical diagnosis applications. Analytical chemistry. Univer-sité Pierre et Marie Curie - Paris VI; Universidad de Guanajuato (México), 2016. English. �NNT : 2016PA066370�. �tel-01570329�
Physicochemical characterization and
biocompatibility studies of persistent luminescence
nanoparticles for preclinical diagnosis applications
A doctoral thesis submitted to
Universidad de Guanajuato
División de Ciencias Naturales y Exactas
and
Université Pierre et Marie Curie
Chimie Moléculaire de Paris Centre
Unité de Technologies Chimiques et Biologiques pour la Santé
for the degree of Doctor en Química de la Universidad de
Guanajuato and Docteur de Chimie Moléculaire de Paris Centre
Author
Gonzalo Ramírez García
July 2016
Supervised by
Prof. Anne Varenne
CERTIFICATE OF APPROVAL
This manuscript has been read and approved by the Examining Committee
constituted by:
Dr. ÁVILA-RODRÍGUEZ Mario
President of the jury
(UGTO)
Dr. MÉNAGER Christine
President of the jury
(UPMC)
Dr. DÍAZ-MUÑOZ Mauricio
Rapporteur
(UNAM)
Dr. KUHN Alexander
Rapporteur
(ENSCBP)
Dr. CRUZ-JIMÉNEZ Gustavo
Examiner
(UGTO)
Dr. BEDIOUI Fethi
Examiner
(ENSCP)
STATEMENT OF ORIGINALITY
This is to certify the originality of this thesis, and that its content is the product
of my own work. This thesis has not been submitted for any degree or other
purposes.
ACKNOWLEDGEMENTS
To the Institutions who give me technical, scientific and financial support to realize this thesis: Mexican National Council for Science and Technology (CONACYT) for their support
through the doctoral fellowship.
Dirección de Apoyo a la Investigación y al Posgrado of the University of Guanajuato (DAIP)
for complementary financial support for stays and attendance to meetings.
French National Research Agency (ANR).
University of Guanajuato and University Pierre et Marie Curie
Unité des Technologies Chimiques et biologiques pour la Santé and all their members for
fruitfully discussions.
The group of Electroquímica Ambiental and all their members.
National Laboratory for the Characterization of Physicochemical Properties and Molecular Structure of the University of Guanajuato for permit us to use their installations and
equipments.
Microscopy and Image Analysis Unit of the Instituto de Neurobiología, UNAM, especially to Ma. Lourdes Palma Tirado by its assistance in the morphological and ultrastructural analysis
of diverse samples.
Bioterio de la División de Ciencias Naturales y Exactas of the Universidad de Guanajuato,
by its help in control and manipulation of experimentation animals.
My most sincere regards and acknowledgements to the examining committee, professors Mario
Ávila Rodríguez, Fethi Bedioui, Gustavo Cruz Jiménez, Mauricio Díaz Muñoz, Alexander Kuhn and Christine Ménager, for your active participation in this adventure, for evaluate this
thesis, and for your observations and advises that really enriched this work in all senses. Gracias a Carolina Arriola y Karina del Real por hacer de cada trámite no un calvario, sino la
ocasión de un momento para compartir historias siempre agradables. Por todo su apoyo para que todo saliera adelante.
Gracias a Carolina Ruiz, Edith R. Martínez Alcaraz, Teresa Razo Lazcano, Juan Pedro Galván,
y J. Antonio Reyes Aguilera por su asistencia técnica.
Un grand merci à l'ensemble des professeurs et copains de l’Unité des Technologies Chimiques et Biologiques pour la santé : Daniel Sherman, Fethi Bedioui, Christian Girard, Sophie
Griveau, Mathiew Lazerges, Cyrine Slim, Johanne Seguin, Laura Trapiella, Elliot Teston, Marie Pastor, Simona Manta, Abdelilah Amar, Ludovic Leleu, Francois Xavier Guillon, Camille Perrault, Amandine Calmet, pour votre fraternité et les nombreux moments agréables
partagés ensemble au quotidien.
Many thanks for those who have given support, wisdom, criticism, histories, smiles and wines along the daily life: Ernesto Camarillo, Chayito, Luisja, Robson, Debora, Timour, Erik y Gibrán.
de diriger ce projet de recherche, pour ses précieux conseils, discussions et commentaires et votre soutien permanent tout au long de ces années d'étude. Le succès de ce projet est grâce à vous :
Prof. Silvia Gutiérrez Granados. Muchas gracias además por encaminarme y acompañarme
en este proyecto de vida. Por todos esos planes que ha tramado y que ejecutamos juntos, y tantos momentos agradables y experiencias inolvidables que siempre me han puesto en el lugar preciso donde debo estar…
Prof. Anne Varenne, J'exprime toute ma gratitude pour votre précieux travail, accompagné
toujours de savoir et d’un énorme sourire et qualité humaine uniques… Pour votre accueil exceptionnel dans plusieurs aspects de la vie. Vos paroles m´inspirent à coqueter le monde entier…
Prof. Cyrille Richard. Merci pour toutes tes idées, ta gentillesse et ton façon unique de faire la
science, toujours dans une ambiance amicale exceptionnelle. Merci pour me montrer avec ton attitude que le bonheur dans la vie n´est-ce pas une destination sinon un trajet…
Prof. Nathalie Mignet. Merci pour votre attention et présence permanente dans toutes mes
activités scientifiques, pour les nombreux moments agréables partagés ensemble au quotidien. Pour la motivation d’être meilleur a chaque jour…
Prof. Fanny d’Orlyé. Merci pour m’accompagner au quotidien et pour avoir supporté mes
périodes de doutes et de stress. Je tends toujours à me motiver avec ta passion pour la recherche et la rigueur scientifique…
Prof. Minerva Martínez Alfaro. Muchas gracias por hacer de cada experimento y cada
experiencia de vida un momento crítico y de reflexión, pero siempre divertido a la vez. Gracias por ayudarme a tomar siempre buenas decisiones.
A las personas que con su filosofía de vida han impactado de manera emocional esta parte de mi vida, y para siempre:
Claudia E. Ramírez Belmán: Por toda tu paciencia. Me basta verte reír para saber que
contigo me voy a empapar el alma toda la vida. Si pensarlo emociona, imagínate hacerlo…
José Cázares Marinero: Por compartir todo tu apoyo en momentos difíciles, alegría, risas,
canciones, entusiasmo y poesías. ¡Ahh, y cacahuates!…
Fátima Quiroz: ¿Y qué historias cuentan tus cicatrices? Las mías no dejan de sangrar porque
les da risa al recordar, y se mueven…
Alberto Ortiz: Por ese arrojo incondicional y lealtad, y por nutrir de anécdotas agradables
todo este tiempo. Sólo se vive una vez, pero si se vive bien, con una sola vida basta…
Ana Isabel Oliveira Simões: As melhores coisas da vida não são coisas… Tse Chi Sum: Si la vida te da limones, pide sal y mezcal…
Keiko Kitagawa: Everything is made of atoms. Are shadows? Are dreams? The smoke
activating the fire alarm in the kitchen is…
Finalmente, esta tesis está dedicada con extremo cariño y afección a mi madre y hermanos, por toda su creatividad para darme su apoyo incondicional, enseñanzas, buenos ejemplos y risas
PREFACE
The present work represents the fulfillment of a jointly supervised doctoral thesis between the University Pierre et Marie Curie, PARIS VI, and the University of Guanajuato according to the applicable terms and conditions for the preparation of the thesis established in agreement by the above mentioned universities. The research has been carried out in the laboratories of the Unité de Technologies Chimiques et Biologiques pour la Santé (Paris, France), and the laboratories of the División de Ciencias Naturales y Exactas of the University of Guanajuato (Guanajuato, Mexico).
This thesis has been directed by a multidisciplinary group integrated by Anne Varenne, Nathalie Mignet, Silvia Gutiérrez Granados and Minerva Martínez Alfaro. Fanny d’Orlyé and Cyrille Richard have also supervised and participated fruitfully in the discussion of the entire work.
This manuscript is presented in English, and it includes an extended summary in French. The general objective of this work has been to develop and apply methodologies for characterization of physicochemical properties and biocompatibility of persistent luminescence nanoparticles for preclinical diagnosis applications.
The present thesis is actually relevant in three senses: first, the development of methodologies for determination of nanoparticle physicochemical properties (Chapter II), the evaluation of their interactions with proteins (Chapters III-V), and thirdly, the application of these methodologies in combination with a complete set of biocompatibility studies to characterize the recently developed ZnGa1.995Cr0.005O4 nanoparticles (Chapter VI and VII), which are a great promise
in the field of the biological imaging for a wide range of applications.
The global conclusions of this research are presented in the last section of this manuscript. As a result of this collaboration, the next publications on indexed journals were achieved or are expected:
Gonzalo Ramírez-García, Fanny d’Orlyé, Silvia Gutiérrez-Granados, Minerva Martínez-Alfaro, Nathalie Mignet, Cyrille Richard, Anne Varenne. Functionalization and characterization of
persistent luminescence nanoparticles by dynamic light scattering, laser Doppler and capillary electrophoresis. Colloids and Surfaces B Biointerfaces, 2015. 136: p. 272-281.
Laura Trapiella-Alfonso §, Gonzalo Ramírez-García §, Fanny d’Orlyé, Anne Varenne; (§ Both authors contribute equal to this work). Electromigration methodologies for the characterization of
nanoparticles and the evaluation of their behaviour in biological systems. TrAC Trends in
Analytical Chemistry, 2016. (In press. Available on-line April 29).
Gonzalo Ramírez-García, Silvia Gutiérrez-Granados, Marco A. Gallegos-Corona, Lourdes Palma-Tirado, Fanny d’Orlyé, Anne Varenne, Nathalie Mignet, Cyrille Richard, Minerva Martínez-Alfaro.
Nathalie Mignet, Cyrille Richard, Anne Varenne. Electrokinetic Hummel-Dreyer characterization
of nanoparticle-plasma protein corona: the non-specific interactions between PEG-modified persistent luminescence nanoparticles and bovine serum albumin. (Submitted)
Photo-activation enhances the toxicity of persistent luminescence nanoparticles in breast cancer cells. (Under revision)
A quantitative method to optimize the PEGylation of persistent luminescence nanoparticles thus increasing their permanency in blood circulation: evaluation of the nanoparticle interactions with human serum albumin. (Under revision)
Comparative and competitive interactions between PEGylated persistent luminescence nanoparticles and apolipoprotein-e versus albumin: analysis in a binary system of proteins. (Under
revision)
Gonzalo Ramírez-García, David O. Oluwole, Siphesihle Robin Nxele, Fanny d’Orlyé, Tebello Nyokong, Fethi Bedioui, Anne Varenne. Characterization of phthalocyanine functionalized
quantum dots by dynamic light scattering, laser Doppler and capillary electrophoresis. (Submitted)
With exception of the latest, the essence of each one of these works is presented in the next chapters.
ABSTRACT
Nowadays engineered nanoparticles surround us, leading to many and highly valuable applications in different domains. Thanks to their unique properties they are revolutionizing and pushing up varied research areas including biomedical, material, physics and chemistry sciences, and thereby our society. Nevertheless, those properties are hardly dependent on the nature, size, shape, surface chemistry and chemical environment of these materials. The use of nanoparticles for biomedical applications implies the knowledge of their physicochemical parameters in physiologically relevant media.
Zinc gallate nanoparticles doped with chromium (ZnGa1.995Cr0.005O4) are innovative persistent
luminescence materials with particular optical properties allowing their use for in vivo imaging. They offer the promise of revolutionary tools for biological imaging with applications such as cellular tracking or tumor detection. They can be excited in the tissue transparency window by visible photons and emit light for hours after the end of the excitation. This allows observing the probe without any time constraints nor autofluorescence signals produced by biological tissues when using fluorescent probes.
In the first chapter, a brief review describing the relevance of the ZnGa1.995Cr0.005O4
nanoparticles and their applications is presented. Thereafter, the nanoparticle functionalization effects on their physico-chemical properties and on their colloidal stability and applications are described. Some important aspects about NPS pharmacokinetic and their biocompatibility are also presented in order to lay the groundwork for the toxicity studies presented in Chapters VI and VII. Finally, the state of the art and trends about the characterization of NPS by means of electrokinetic methodologies and the parameters obtained from the electrophoretic profiles are reviewed with emphasis on the NPs characterization for biomedical applications and their interactions with biomolecules.
Modification of the surface of these nanoparticles is essential to be colloidally stable not only for cell targeting applications but also for proper distribution in living organisms. The use of different methods for controlling and characterizing the functionalization process is imperative to better understand the subsequent interactions with biological elements. The optimization of the
ZnGa1.995Cr0.005O4 synthesis with various functional groups on their surface (-OH, aminosilane and
PEG) and their physic-chemical characterization have been explored for the first time in this work by means of dynamic light scattering, laser Doppler electrophoresis in combination with capillary electrophoresis. The results are presented in Chapter II. Special interest was focused in the latter method in order to evaluate its potential for the evaluation of colloidal and chemical properties and stability of functionalized nanoparticles. The hydrodynamic diameter, zeta potential, electrophoretic dispersion, stability over time and aggregation state of persistent luminescence nanoparticles under physiological-based conditions have been studied for each functional state. This thorough control increases our knowledge on these nanoparticles for subsequent interactions and toxicological studies and ultimately medical application.
proteins could help determining the role played by this protein corona in the fate of the nanoprobes. In this sense, the nanoparticle surface passivation is therefore a very crucial challenge in biomedicine. In Chapter III we developed herein for the first time an electrokinetic Hummel and Dreyer method for quantitatively characterize protein corona formation on nanoparticles. This strategy was designed and optimized to evaluate the non specific binding of Bovine Serum Albumin with the PEG-functionalized ZnGa1.995Cr0.005O4 persistent luminescence nanoparticles developed for in vivo biological imaging. The binding strength and the number of binding sites were determined at
different ionic strengths. This methodology opens the way to an easy, low sample- and time-consuming evaluation of the impact of NPs surface nature on protein-corona formation and therefore on their potential for various bio-medical applications. As the first application of this method, in the Chapter IV the effect of the reaction time during aminosilanation step on the interactions between PEGylated nanoparticles and Human Serum Albumin was quantitatively evaluated in order to determine the optimal conditions for polyethylene glycol anchorage. The obtained results are in good agreement with the previous in vivo observations, since the lower the aminosilanation time, the stronger the interactions with proteins. Thereby, this methodology can help in the optimization and control of the production of functionalized nanoparticles for increase their permanence in blood circulation before the in vivo analysis.
In Chapter V, a second step for a better understanding of protein corona, three different strategies were used to compare the interactions between the PEGylated ZnGa1.995Cr0.005O4 and
Human Serum Albumin (the most abundant serum protein) or Apolipoprotein-E (ApoE) (which has been related to the active transport of nanoparticles or molecules through the blood brain barrier) by means of electrokinetic CE: i) interaction of injected nanoparticles with single proteins in the BGE, under the same analytical conditions, comparison of the electrophoretic profiles and determination of the binding parameters, ii) incubation of the NPs with one of the proteins and then electrokinetic separation in a separation media including the second protein, and vice versa, and iii) evaluation of the nanoparticle/protein interaction in a binary system of both proteins mixed at different ratios. These analytical methodologies show the application of capillary electrophoresis in the Hummel-Dreyer and Affinity modes according to the interaction parameters, for the evaluation of interactions between the persistent luminescence nanoparticles and two plasma proteins in a comparative and competitive system, resulting in a higher affinity between the PEGylated nanoparticles and the ApoE in comparison to the Human Serum Albumin. These observations may open interesting prospects for brain blood barrier translocation by the persistent luminescence nanoparticles or other contrast agent or delivery nanoparticles, and thereby for their application in optical imaging or therapeutics into the brain zone.
During the persistent luminescence, the most part of the energy is slowly emitted as photons, however, some of the electrons in the conduction band can reduce the molecular oxygen to produce superoxide anion (O2•-). In Chapter VI, we evaluated the light effect on the reactive oxygen species
production by irradiated or non-irradiated ZGO persistent luminescence nanoparticles. Their influence in oxidative stress induction and their cytotoxic effect on MCF-7 and MDA-MB-231
to UV and visible light, and the corresponding oxidative stress induced in cells after internalization can be directly related to their dose-dependent inhibition of cell viability. On the other hand, PEGylated nanoparticles were not uptake by cells, and cell viability was not altered by these nanoparticles. This study reveals the importance of consideration of light irradiation for the study of luminescent nanoparticles toxicity, and a novel possible application in photodynamic therapy.
Despite the attractive optical properties of the ZnGa1.995Cr0.005O4 persistent luminescence
nanoparticles, their use demands extensive toxicological evaluation (Chapter VII). A complete set of mice were treated with a single intravenous administration of hydroxylated or PEGylated nanoparticles at different concentrations and then a set of standard tests were carried out 1 day, 1 month and 6 months after the administration in order to evaluate their acute, sub-chronic and long term in vivo effects. Hydroxylated nanoparticles induced some important health alterations at the higher dose both at short and at long term exposition. High concentrations of hydroxylated nanoparticles generate structural alterations at histological level, endoplasmic reticulum damage and oxidative stress in liver, as well as rising in white blood cells counts. On the contrary, no clinical sign related to PEGylated nanoprobes treatments were noted during our in vivo experiments, denoting the protective effect of PEG-functionalization and thereby their potential as safe in vivo diagnostic probes.
As a global conclusion, this work demonstrates the efficiency and high potential of electrokinetic methodologies for the physicochemical characterization of the recently synthesized
ZnGa1.995Cr0.005O4 persistent luminescence nanoparticles and their interactions with biomolecules.
The knowledge of this information in addition to the in vitro and in vivo biocompatibility studies can thereafter potentiate their biological applications.
These methodologies developed in this work could be further used for other types of NPs and proteins.
LIST OF CONTENTS
CERTIFICATE OF APPROVAL ... i
STATEMENT OF ORIGINALITY ... ii
ACKNOWLEDGEMENTS ... iii
PREFACE ... v
ABSTRACT ... vii
LIST OF CONTENTS ... x
ACRONYMS AND SYMBOLS ... xv
INDEX OF FIGURES AND TABLES ... xviii
CHAPTER I. THEORETICAL FRAGMENT ... 1
1.1. PERSISTENT LUMINESCENCE NANOPARTICLES FOR BIOMEDICAL
IMAGING ... 2
1.1.1. Luminescent nanoparticles for optical imaging ... 2
1.1.2. Persistent luminescence nanoparticles ... 3
1.1.3. ZnGa1.995Cr0.005O4 persistent luminescence nanoparticles ... 7
1.1.4. Modification and functionalization of nanoparticles ... 11
1.1.4.1. Passive and active targeting ... 13
1.2. PHARMACOKINETICS OF NANOPARTICLES FOR BIOLOGICAL
IMAGING ... 14
1.2.1. Administration of manufactured nanoparticles ... 14
1.2.2. Nanoparticle biodistribution ... 14
1.2.2.1. Protein corona formation ... 15
1.2.2.2. Cellular uptake and interactions ... 16
1.2.3. Metabolism ... 17
1.2.3.1. Nanoparticle toxicity... 18
1.2.4. Clearance of nanoparticles ... 20
1.3. COLLOIDAL STABILITY OF NANOPARTICLES ... 24
1.3.1. The role of attraction and repulsion forces in colloidal stability ... 24
1.3.1.1. Zeta-potential ... 26
1.4.
ELECTROKINETIC
METHODS
FOR
NANOPARTICLE
CHARACTERIZATION ... 28
1.4.2. Capillary electrophoresis: Principles ... 31
1.4.3. Applications of electrokinetic methods for nanoparticle characterization: the current context ... 32
1.4.3.1. Noble-metal nanoparticles ... 35
1.4.3.2. Quantum Dots ... 37
1.4.3.3. Metal oxide nanoparticles ... 37
1.4.3.4. Carbon-based nanomaterials ... 38
1.4.3.5. Polymeric nanoparticles ... 39
1.4.4. Evaluation of nanoparticles as drug delivery systems ... 40
1.4.6. Current trends in capillary electrophoresis for nanoparticle characterization ... 42
1.5. CAPILLARY ELECTROPHORESIS METHODOLOGIES FOR THE
EVALUATION OF INTERACTIONS BETWEEN NANOPARTICLES AND
BIOMOLECULES ... 43
1.5.1. Evaluation of interactions between nanoparticles and proteins ... 44
1.5.2. Interaction of nanoparticles with other biomolecules and biological systems ... 47
1.5.3. Current trends in the capillary electrophoresis application for the determination of nanoparticle/biomolecules interactions ... 48
OBJECTIVES ... 49
General objective ... 49
Particular objectives ... 49
CHAPTER II. FUNCTIONALIZATION AND CHARACTERIZATION OF
ZnGa
1.995Cr
0.005O
4PERSISTENT LUMINESCENCE NANOPARTICLES BY
DYNAMIC LIGHT SCATTERING, LASER DOPPLER AND CAPILLARY
ELECTROPHORESIS ... 50
2.1. BACKGROUND AND JUSTIFICATION ... 51
2.2. MATERIALS AND METHODS ... 53
2.3. RESULTS AND DISCUSSION ... 55
2.3.1. ZGO-OH: Point of zero charge ... 56
2.3.2. Ionic strength effect on ZGO-OH colloidal stability at physiological pH: Use of adequate mathematical models for ζ-potential determination ... 56
2.3.3. pH effect on ZGO-OH colloidal stability at fixed ionic strength ... 58
2.3.4. Amelioration of the ZGO-NH2 synthesis by a thermal step ... 60
2.3.5. Ionic strength effect on ZGO-NH2 colloidal stability at physiological pH ... 63
2.3.6. Ionic strength effect on the ZGO-PEG colloidal stability at physiological pH ... 64
CHAPTER III. ELECTROKINETIC HUMMEL-DREYER
CHARACTERIZATION OF NANOPARTICLE-PLASMA PROTEIN CORONA:
THE
NON-SPECIFIC
INTERACTIONS
BETWEEN
PEG-MODIFIED
PERSISTENT LUMINESCENCE NANOPARTICLES AND BOVINE SERUM
ALBUMIN ... 67
3.1. BACKGROUND AND JUSTIFICATION ... 68
3.2. MATERIALS AND METHODS ... 69
3.3. RESULTS AND DISCUSSION ... 71
3.3.1. The Hummel-Dreyer method as a propose to determinate nanoparticle/protein interactions ... 71
3.3.2. External calibration for the determination of the bound protein concentration ... 73
3.3.3. Saturation curves and binding parameters determination ... 76
3.4. PARTIAL CONCLUSIONS ... 79
CHAPTER IV. ... 80
A QUANTITATIVE METHOD TO OPTIMIZE THE PEGYLATION OF
PERSISTENT LUMINESCENCE NANOPARTICLES THUS INCREASING THEIR
PERMANENCY IN BLOOD CIRCULATION: NANOPARTICLE INTERACTIONS
WITH HUMAN SERUM ALBUMIN ... 80
4.1. BACKGROUND AND JUSTIFICATION ... 81
4.2. MATERIALS AND METHODS ... 82
4.3. RESULTS AND DISCUSSION ... 84
4.3.1. Influence of the aminosilanization time effect on the size and ζ-potential of ZnGa1.995Cr0.005O4 nanoparticles ... 84
4.3.2. Aminosilanization time effect on the electrophoretic profiles for ZGO-PEG/human serum albumin interactions... 86
4.3.3. Saturation curves and binding parameters determination ... 88
4.4. PARTIAL CONCLUSIONS ... 91
CHAPTER V. ... 92
COMPETITIVE INTERACTIONS BETWEEN PEGYLATED PERSISTENT
LUMINESCENCE NANOPARTICLES AND APOLIPOPROTEIN-E VERSUS
ALBUMIN: ANALYSIS IN A BINARY SYSTEM OF PROTEINS ... 92
5.1. BACKGROUND AND JUSTIFICATION ... 93
5.2. MATERIALS AND METHODS ... 95
5.3. RESULTS AND DISCUSION ... 96
5.3.1. ZGO-PEG interactions with single proteins in the BGE... 97
5.3.2. Determination of binding constants for ZGO-PEG interaction with HSA or ApoE ... 98
Albumin or Apolipoprotein-E ... 106
5.4. PARTIAL CONCLUSIONS ... 108
CHAPTER VI. ... 109
PHOTO-ACTIVATION ENHANCE THE TOXICITY OF PERSISTENT
LUMINESCENCE NANOPARTICLES IN BREAST CANCER CELLS ... 109
6.1. BACKGROUND AND JUSTIFICATION ... 110
6.2. MATERIALS AND METHODS ... 111
6.3. RESULTS AND DISCUSION ... 113
6.3.1. Light exposure effect on ROS production by ZGO nanoparticles ... 113
6.3.2. Breast cancer cell viability alteration by pre-irradiated ZGO nanoparticles ... 116
6.3.3. In vitro oxidative stress evaluation: Aqueous peroxides and nitric oxide metabolites measurement ... 118
6.3.4. Uptake of ZGO-NPs by cells ... 121
6.4. PARTIAL CONCLUSIONS ... 122
CHAPTER VII. ACUTE, SHORT AND LONG-TERM TOXICITY OF
PERSISTENT NANOPHOSPHORS IN MICE ... 124
7.1. BACKGROUND AND JUSTIFICATION ... 125
7.2. MATERIALS AND METHODS ... 126
7.3. RESULTS AND DISCUSSION ... 128
7.3.1. In vivo nanoparticle biodistribution ... 128
7.3.2. Mice weight control ... 129
7.3.3. Biodistribution in organs by persistent luminescence analysis ... 131
7.3.4. Oxidative and nitrosative stress evaluation ... 133
7.3.5. DNA damage study by comet assay ... 135
7.3.6. Complete blood count analysis ... 135
7.3.7. Histopathological examination of principal organs ... 137
7.3.8. Evaluation of structural alterations by TEM ... 139
7.4. PARTIAL CONCLUSIONS ... 140
GENERAL CONCLUSIONS ... 142
PERSPECTIVES ... 144
ANEXE I. RÉSUMÉ GÉNÉRALE EN FRANÇAIS ... 165
Caractérisation physicochimique des nanoparticules à luminescence persistante et
étude de leur biocompatibilité pour des applications précliniques de diagnostic ... 165
A1. Introduction ... 166
A2. Résultats et discussion ... 168
A2.1. Synthèse, fonctionnalisation et caractérisation des ZnGa1.995Cr0.005O4 ... 168
A2.2. Évaluation des interactions entre ZGO-PEG et l'albumine par la méthode électrocinétique de Hummel-Dreyer ... 171
A2.3. Évaluation des interactions entre ZGO-PEG et deux protéines plasmatiques l’Apolipoprotéine E et l’albumine de sérum humain : effets compétitifs ... 178
A2.4. Effets de la photo-activation de ZnGa1.995Cr0.005O4 sur la toxicité des cellules de cancer du sein 183 A2.5. Toxicité aiguë, à court et à long terme de nanosondes à luminescence persistante chez la souris186 A3. Conclusions ... 190
ACRONYMS AND SYMBOLS
Acronyms Details
ACB Ammonium carbonate buffer
ACE Affinity capillary electrophoresis
AFM Atomic force microscopy
ApoE Apolipoprotein-E
APTES 3-Aminopropyl triethoxysilane
BBB Blood brain barrier
BGE Background electrolyte
BSA Bovine Serum Albumin
CE Capillary electrophoresis
CZE Capillary zone electrophoresis
DAPI 4´,6-diamidino-2-phenylindole
DDABr Didodecyldimethylammonium bromide
DFM Dark-field microscopy
DLS Dynamic light scattering
DMF N,N-Dimethylformamide
DMSO Dimethyl sulfoxide
DNA Deoxyribonucleic acid
DSC Differential scanning calorimetry
EC Electrochemical detector
EDTA Ethylenediaminetetraacetic acid
ELS Evaporative light scattering
FACE Frontal analysis capillary electrophoresis
FACMCE Continuous frontal analysis in a microchip electrophoresis format
FRET Förster resonance energy transfer
FTIR Fourier transform infra-red spectroscopy
GRAN Granulocytes
HCT Hematocrit
HD Hummel-Dreyer capillary electrophoresis method
HEPES 4-(2-Hydroxyethyl)piperazine-1-ethanesulfonic acid
HGB Hemoglobin
HPLC High performance liquid chromatography
HSA Human Serum Albumin
IC50 Inhibitory dose at 50%
IS Ionic strength
LDE Laser Doppler electrophoresis
LDV Laser Doppler velocimetry
LED Light-emitting diode
LIF Laser induced fluorescence detector
LYM Lymphocytes
MEKC Micellar electrokinetic chromatography
MeO-PEG5kDa-NHS Methoxypolyethylene glycol N-hydroxysuccinimide (5000 Dalton)
MOPS Morpholino propanesulfonic acid
Acronyms Details
NECEEM Non-equilibrium CE of equilibrium mixtures
NM Nanomaterial
NMR Nuclear magnetic resonance
NOx Nitric oxide metabolites
NP Nanoparticle
PAGE Polyacrylamide gel electrophoresis
PDI Polydispersity index
PEG Polyethylene glycol
PLNPs Persistent luminescence nanoparticles
PLT Platelets
POx Aqueous peroxides
PZC Point of zero charge
QD Quantum dot
RBC Red blood cells
ROS Reactive oxygen species
SEM Scanning electron microscopy
TDA Taylor dispersion analysis
TEM Transmission electron microscopy
VACE Vacancy affinity capillary electrophoresis
VPM Vacancy peak method
WBC White blood cells
XRD X-ray diffraction
XTT 2,3-bis(2-methoxy-4-nitro-5-sulfophehyl)-2H-tetrazolium-5-carboxanilide
ZGO-NH2 Aminosilane-functionalized ZnGa1.995Cr0.005O4 nanoparticles ZGO-NPs ZnGa1.995Cr0.005O4 nanoparticles
ZGO-OH Hydroxyl-functionalized ZnGa1.995Cr0.005O4 nanoparticles ZGO-PEG Pegylated ZnGa1.995Cr0.005O4 nanoparticles
Symbol Details
Ac Vacancy peak area obtained during HD calibration
As Vacancy peak area of the sample in the HD method
Aλ Absorbance at given wavelength (λ)
a Hydrodynamic radius
C Molar concentration
DH Hydrodynamic diameter
Λ0
counter Limit equivalent conductance of the counter ion
E Electric field
e Elementary electric charge
η Vicosity
ε Molar extinction coefficient
ε0 Electric permittivity of vacuum
εr Relative electric permittivity
k Boltzmann constant
κ Debye-Hückel parameter (reciprocal thickness of the ion cloud)
Ka Binding constant
l Light pathway in cm
L Ligand
[L]b Bound ligand concentration
[L]T Total ligand concentration
[S]b Bound substrate concentration
[S]T Total substrate concentration
mcounter Ionic drag coefficient of the counterion
μE Electrophoretic mobility
n Number of binding sites on a substrate
NA Avogadro number nH Cooperativity O2•- Superoxide anion RH Hydrodynamic radius S Substrate T Temperature v Electrophoretic velocity
VA Attraction potential energy
VR Repulsion potential energy
VT Total potential energy
z Charge number of the counterion
INDEX OF FIGURES AND TABLES
CHAPTER I
Fig. 1. 1. Relative size of nanoparticles [8]. ... 2
Fig. 1. 2. The book Litheosphorus Sive de Lapide Bononiensi by Fortunius Licetus (Bologna, Italy, 1640) on the persistent luminescence of the Bologna stone [17]. ... 4
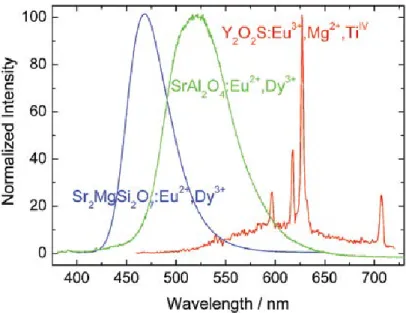
Fig. 1. 3. The luminescence spectra of the blue emitting Sr2MgSi2O7:Eu2+,Dy3+, green emitting SrAl2O4:Eu2+,Dy3+, and red emitting Y2O2S:Eu3+,Mg2+,TiIV phosphors after UV excitation [17]. ... 4
Fig. 1. 4. Persistent luminescence applications [22]. ... 5
Fig. 1. 5. Number of papers published (from Web of Science). At the left side, with the key words “persistent luminescence” and “in-vivo imaging” ; at the right side with the key words “persistent luminescence” and “nanoparticles” (adapted from [24]). ... 6
Fig. 1. 6. Absorption spectra of important chromophores present in mammalian tissues [27]. ... 7
Fig. 1. 7. Crystalline spinel structure of ZnGa2O4:Cr [30]. ... 8
Fig. 1. 8. Photoluminescence excitation (solid line) and emission (dotted line) spectra of ZGO-NP [33]. ... 8
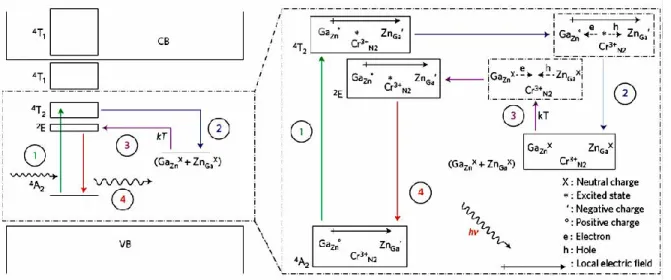
Fig. 1. 9. Schematization of the mechanism proposed for the persistent luminescence induced by LED excitation. Conduction band (CB) and valence band (VB) [33]. ... 9
Fig. 1. 10. Room-temperature persistent luminescence decay curves of bleanched ZGO-NP. Excitation was applied during 2 min under ultraviolet light or LED array sources. Un-excited ZGO-NP (by isolating them in the darkness for at least one week before the analysis) were used as background reference [33]. ... 10
Fig. 1. 11. Schematic representation of the in vivo imaging after in situ activation of the ZGO-NP [33]. ... 11
Fig. 1. 12. Functional decoration of nanoparticles (adapted from [42]). ... 12
Fig. 1. 13. The nanoparticle-corona complex in a biological system (Adapted from [60])... 15
Fig. 1. 14. Schematic of the known pathways for nanoparticle internalization [72]. ... 17
Fig. 1. 15. The tissue-specific extravasation of nanomaterials. A) Liver, B) spleen, C) kidney, and D) lung [126]... 21
Fig. 1. 16. Illustration of attractive and repulsive forces between nanoparticles according DLVO theory [147]. ... 25
Fig. 1. 17. Schematic laser Doppler electrophoresis setup (A), and migration of a nanoparticle as an effect of the applied electric field [159]. ... 30
Fig. 1. 18. Standard capillary electrophoresis setup. ... 31
Fig. 1. 19. A comprehensive scheme for the control and optimization of nanoparticle synthesis and properties based on analytical electrokinetic methodologies (Adapted from [192]). ... 33
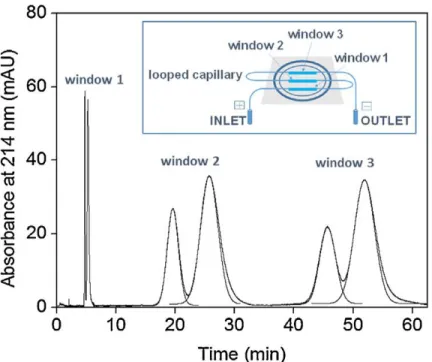
Fig. 1. 20. Electrophoretic behavior of positively charged AuNPs (single red CTAB-capped AuNP, a) and negatively charged AuNPs (single green SDS-capped AuNP, b) in situ visualized by capillary electrophoresis coupled to dark field microscopy detector. Conditions: 5 mM PBS (pH 9.0) ; electrokinetic injection,5 kV; separation voltage, 0.6 kV [210]. ... 36 Fig. 1. 21. Online CE-TDA for the separation and the determination of the size of two nanolatexes
window 1, 42 cm to window 2, 57 cm to window 3) × 26 μm I.D.(365 μm O.D.). Hydrodynamic injection: 50 mbar, 28 s. Applied voltage: +30 kV during 6.2 min. Mobilizing pressure: 40 mbar. Electrolyte: 35.2 mM Na2B4O7 + 1.0 mM Brij-35 (pH 9.2)
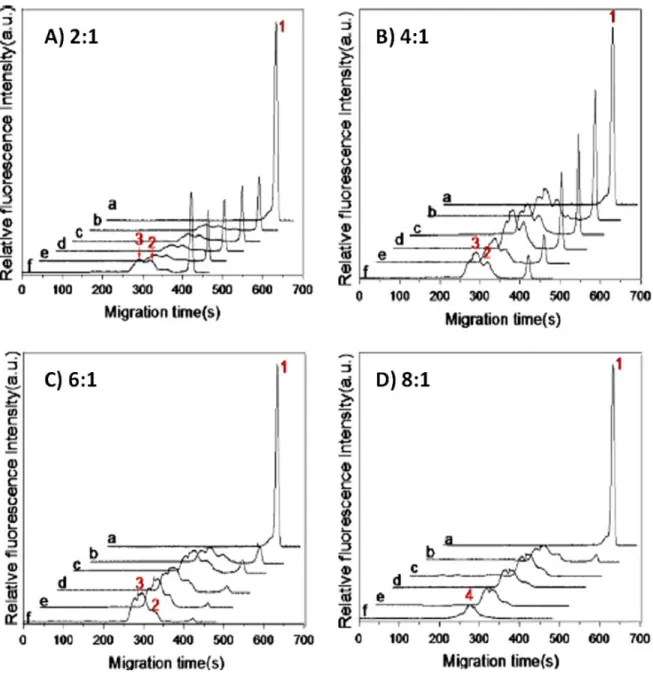
[222]. ... 40 Fig. 1. 22. FACCE of polymeric micelles (a), PEG-b-PGlu (b) and their mixture (c) in effective mobility scale. Experimental conditions: electrolyte: 10 mM phosphate buffer (pH 7.2). Applied voltage: +10 kV. Samples: (a) polymeric micelles diluted at 33% v/v in the electrolyte, (b) PEG-b-PGlu at 3.8 g/L, (c) polymeric micelles diluted at 33.3% v/v in the electrolyte containing PEG-b-PGlu at 3.8 g/L [200]. ... 41 Fig. 1. 23. CZE of QDs-dBSA self-assembled at different dBSA/QD ratios (A, 2:1; B, 4:1; C, 6:1; D, 8:1. Incubation time : without BSA (a) ; with BSA 0 min (b), 10 min (c), 20 min (d), 30 min (e), 60 min (f) [247]. ... 46
CHAPTER II
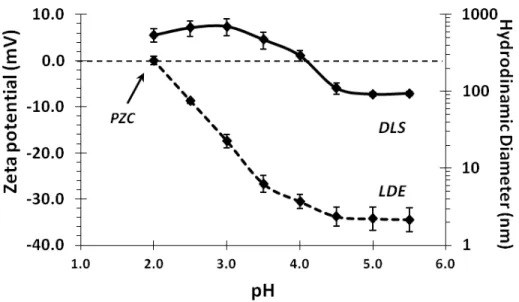
Fig. 2. 1. Sequential surface functionalization of ZnGa1.995Cr0.005O4 nanoparticles. ... 54 Fig. 2. 2. Characterization of ZGO-OH suspensions (1.0 mg/mL) in terms of zeta potential (dashed
line) and hydrodynamic diameter (continuous line) estimated by LDE and DLS, respectively, in a 30 mM citrate buffer pH 2.0 to 5.5 (n= 4 repetitions, and error bars represent standard deviation)... 56
Fig. 2. 3. Hydrodynamic diameter (at 1.0 mg/mL) in phosphate buffers (pH 7.4) at different ionic
strengths (‐‐‐‐‐ 10 mM, –∙– 30 mM, ∙∙∙∙∙∙ 50 mM, and ––– 100 mM) estimated by DLS (A) and zeta potential estimated by LDE (B) of ZGO-OH at different NP concentrations ( 0.1, 0.5, and 1.0 mg/mL) (n= 4 repetitions, and error bars represent standard deviation). ... 57
Fig. 2. 4. Hydrodynamic diameter (at 1.0 mg/mL) and at different pH values (pH 6.0 ‐‐‐‐‐, 6.5 –∙–,
7.0 ∙∙∙∙∙∙, 7.4 ——, and 8.0 –––) estimated by DLS (A), electrophoretic profiles (at 0.2 mg/mL) obtained by CZE (B) and zeta potential derived from mobility measurements either by CZE (dashed line) or by LDE (continuous line) (C) of ZGO-OH in 30 mM phosphate buffers. Separation conditions: bare fused silica capillary column: 50.0 μm i.d., 35.0 cm total length, 26.5 cm effective length; injection: 10 s at 20 mbar; applied voltage: 12 kV; UV absorption detection at 200 nm; capillary temperature: 25 ◦C. (n= 4 repetitions, and error bars represent standard deviation). ... 59
Fig. 2. 5. Surface bounded APTES: a) covalently, b) electrostatically, and c) by means of hydrogen
bond. ... 60
Fig. 2. 6. Influence of the thermal treatment on the hydrodynamic diameter (continuous lines) and
zeta potential (dashed lines) of ZGO-NH2 (1.0 mg/mL) estimated by DLS and LDE in 20
mM MOPS (pH 7.4). A) No thermal treatment, B) 100 °C/15 minutes, C) 150 °C/15 minutes, D) 200 °C/15 minutes (n= 4 repetitions, and error bars represent standard deviation). E) Electrophoretic profiles of ZGO-NH2 (0.2 mg/mL) during pre-conditioning
after thermal treatment steps in 10 mM MOPS (pH 7.4). Separation conditions: DDABr modified capillary column: 50.0 μm i.d., 35.0 cm total length, 26.5 cm effective length; injection: 10 s at 20 mbar; applied voltage: -10 kV; UV absorption detection at 200 nm;
2
zeta potential estimated by LDE of ZGO-NH2 (0.2 mg/mL ) in MOPS (right) at various
ionic strengths (––– or : 30 mM ; ∙∙∙∙∙∙ or : 20 mM ; –∙– or : 10 mM) (n= 4 repetitions, and error bars represent standard deviation). ... 63
Fig. 2. 8. A) Hydrodynamic diameter of ZGO-PEG estimated by DLS ( 1.0 mg/mL). B)
Electrophoretic profiles of ZGO-PEG (0.2 mg/mL), and C) Zeta potential of ZGO-PEG estimated by LDE and CE ( 0.2 mg/mL) in phosphate and MOPS buffers pH 7.4 at various ionic strengths (‐‐‐‐‐ 30 mM, –∙– 50 mM, ∙∙∙∙∙∙ 100 mM, and ––– 150 mM). (n= 4 repetitions, and error bars represent standard deviation). CE separation conditions : Separation conditions: bare fused silica capillary column: 50.0 μm i.d., 35.0 cm total length, 26.5 cm effective length; injection: 10 s at 20 mbar; applied voltage: 12 kV; UV absorption detection at 200 nm; capillary temperature: 25 ◦C. Peak at left corresponds to EOF (0.01% DMF). ... 65
CHAPTER III
Fig. 3. 1. A) TEM image of the ZGO-PEG. B) Ionic strenght effect on the hydrodynamic diameter (diamonds) and ζ-potential (squares) of ZGO-PEG (0.2 mg/mL) in phosphate buffer solutions, pH 7.4, at varying ionic strength from 30 to 150 mM. ... 71 Fig. 3. 2. Schematic representation of the Hummel-Dreyer method for the evaluation of interactions between nanoparticles and proteins. EOF: Electroosmotic flow. ... 73 Fig. 3. 3. Representative electropherograms at λ = 200 nm for external calibration according Hummel-Dreyer method. Vacancy peaks corresponds to injections of background buffer (pH 7.4 phosphate buffer solution at 60 mM) in a capillary filled with buffer containing BSA at different concentrations (a-DMF, b-0.10, c-0.15, d-0.20, e-0.25, f-0.30, g-0.60 and h-0.90 μmol L-1). The corresponding calibration curve is shown in the inset figure. ... 74
Fig. 3. 4. Electropherograms at λ = 200 nm characteristic of the BSA/ZGO-NP interaction at different protein concentrations in 60 mM IS phosphate buffer solutions (pH 7.4) implementing the Hummel-Dreyer method in CE. ... 75 Fig. 3. 5. A) Binding isotherms characterizing the BSA/ZGO-PEG NP interaction in phosphate buffer (pH 7.4) at varying ionic strength. B) Scatchard plot. Error bars indicate the ± standard deviation of a set of four measurements performed on samples prepared independently at each concentration. ... 77
CHAPTER IV
Fig. 4. 1. Sequential surface functionalization of ZnGa1.995Cr0.005O4 nanoparticles. The
aminosilanization time was varied at 3 or 5 hours under the same reaction conditions. PEGylation reaction was carried out under the time and same reaction conditions in parallel. ... 84
Fig. 4. 2. Representative electropherograms for the evaluation of interactions between
ZGO-PEG(3h) or ZGO-PEG(5h) and HSA (0.9 μM) according to the Hummel-Dreyer method at different ionic strength. ... 87
3h 5h
phosphate buffer (pH 7.4) at different ionic strengths as obtained from the Hummel-Dreyer methods. Error bars indicate the ± standard deviation of four replicates. Lines represent the non linear curve fitting of the experimental data. ... 88
Fig. 4. 4. Scatchard plots for the interaction between HSA and ZGO-PEG3h (circles) or ZGO-PEG5h
(diamonds) at 30, 60, and 100 mM (continuous, dotted and double lines, respectively) according to Scatchard equation. Error bars indicate the ± standard deviation of four sets of samples prepared by separate at each concentration. ... 89
CHAPTER V
Fig. 5. 1. Set of representative electropherograms obtained at λ = 200 nm with the
Hummel-Dreyer/Affinity Capillary Electrophoresis method for A) HSA/ZGO-PEG and B) ApoE/ZGO-PEG interactions in ammonium carbonate buffer solutions (pH 8.0) at 30 mM ionic strength. E=14 kV. Peak identification: a) DMF, b) 0, c) 0.12, d) 0.24, e) 0.72, f) 0.96, g) 1.44 μM of the corresponding protein. ... 97
Fig. 5. 2. A) Model fitting curves for ZGO-PEG interactions with HSA and B) corresponding
Scatchard’s plot for the ZGO-PEG/HSA binding. C) Model fitting curves for ZGO-PEG interactions with ApoE and D) corresponding Hill’s plot for the ZGO-PEG/ApoE binding.
BGE: ammonium carbonate buffer (pH 8.0) at 30 mM ionic strength. Error bars indicate
the ± standard deviation of four sets of samples prepared by separate at each protein concentration. ... 101
Fig. 5. 3. Electropherograms for evaluation of interactions of ZGO-PEG and ApoE (A), ZGO-PEG
and HSA (B), and ZGO-PEG with a mixture of ApoE and HSA: HSA concentration was fixed and ApoE varied (C), and HSA was varied and ApoE concentration remained constant (D). Signals in black correspond to ZGO-PEG injection for NP/proteins interactions, while superimposed blue lines in C) and D) correspond to BGE injection, giving access to inter-protein interactions evaluation. The indicated values are the total inter-protein concentration in the mixture considering the dilution. BGE: ammonium carbonate buffer solutions (pH 8.0) at 15 mM ionic strength. E=14.0 kV. ... 103
Fig. 5. 4. Schematic representation for interpretation of interactions between ZGO-PEG and the
binary system of proteins HSA:ApoE. ... 104
Fig. 5. 5. Set of representative electropherograms obtained at λ = 200 nm for the various strategies
employed to better understand the interaction mechanisms. a) Injection of ZGO-PEG in the capillary conditioned with the BGE, b) injection of ZGO-PEG in the capillary conditioned with the BGE containing HSA, c) injection of ZGO-PEG in the capillary pre-conditioned with the ApoE, d) injection of the pre-incubated ZGO-PEG/HSA in the capillary pre-conditioned with the BGE, e) injection of the pre-incubated ZGO-PEG/ApoE in the capillary pre-conditioned with the BGE, f) Injection of the pre-incubated ZGO-PEG/HSA in the capillary pre-conditioned with the ApoE, g) injection of the pre-incubated ZGO-PEG/ApoE in the capillary pre-conditioned with the HSA. Protein concentration was 1.44 μM for all cases. BGE: ammonium carbonate buffer solutions (pH 8.0) at 30 mM ionic strength. E=12.0 kV... 106
Fig. 6. 1. Reaction for the reduction of XTT tetrazolium to XTT formazan by superoxide radicals.
... 114
Fig. 6. 2. UV-Visible spectra for evaluation of the O2•- generation in time by A) ZGO-OH under UV
ligth irradiation, B) ZGO-OH under visible light irradiation. Light type effect on UV-Visible spectra for evaluation of O2•- generation by C) ZGO-OH and D) ZGO-PEG two
hours after UV light irradiation as indicated by the reduction of 100 μM XTT. ... 115 Fig. 6. 3. Kinetics for the O2•- generation by ZGO-PEG and ZGO-OH NPs under UV or visible-ligth
irradiation and compared with their darkness counterpart as indicated by the reduction of 100 μM XTT. * Represents significant differences respect to control measure (time=0 minutes) according Tukey-Kramer test (p<0.05). ... 116 Fig. 6. 4. ZGO-NP and UV light irradiation effect on cell viability 24 hours after incubation. A) MDA-MB-231, and B) MCF-7 breast cancer cells 50000 cell/well. * Represents significant differences respect to control (viability= 100 %) according Tukey-Kramer test (p<0.05). Nanoparticles were administered after 5 minutes of UV irradiation or without irradiation.
... 117
Fig. 6. 5. Effect of ZGO-NP on superoxide production (quantified as peroxides by colorimetric assay) by A) MDA-MB-231, and B) MCF-7 breast cancer cells after 24 hours of incubation in culture media (10000 cell/well). Nanoparticles were administered after 5 minutes of UV irradiation or without irradiation. ... 119 Fig. 6. 6. Effect of ZGO-NP on nitric oxide production (quantified as stable nitric oxide metabolites by Griess colorimetric assay) in A) MDA-MB-231, and B) MCF-7 breast cancer cells after 24 hours of incubation in culture media (10000 cell/well). Nanoparticles were administered after 5 minutes of UV irradiation or without irradiation. ... 120 Fig. 6. 7. In vitro cellular uptake of A) ZGO-OH, B) ZGO-PEG and C) Control at [0.05 mg/mL] by MDA-MB-231 24 hours after administration. The arrows indicate the cell nucleus. ... 122
CHAPTER VII
Fig. 7. 1. Biodistribution of UV pre-excited ZGO-NPs after intravenous injection of 2 mg/mouse and in situ activated at time 1hour and 4 hours. (1 unit= 2800 photons/s∙cm2∙steradians). ... 129
Fig. 7. 2. Mean body gained weight ± SD of mice after chronic ZGO-NPs administration (over 6 months). * Represents significant statistical differences by Tukey HSD respect to control (p < 0.05), (n=6). ... 130 Fig. 7. 3. Ex vivo biodistribution of ZGO-OH and ZGO-PEG (2 or 8 mg/mouse) at different periods after intravenous injection. Persistent luminescence intensity is expressed in false color units (1 unit D 2,800 photons s-1 cm2 sr) for all images. ... 132
Fig. 7. 4. Aqueous peroxide production by mouse organs after acute, sub-chronic and chronic administration of ZGO-NPs. Quantification by colorimetric assay. * Represents significant statistical differences by Tukey HSD respect to control (p < 0.05). (n=4). ... 134
treated mice (8 mg/mouse). H2O2 (8.8 % [v/v]) treated cells were used as positive control. ... 135
Fig. 7. 6. Hematoxylin and eosin stains on liver, spleen, kidney and lung under optical microscope for histopathological morphology analysis at 6 months after ZGO-NPs injection. ... 138 Fig. 7. 7. TEM images of liver (L) and spleen (S) of mice 6 months after injection of ZGO-NP at 8 mg/mouse. Single staining was used for all TEM analysis. Arrows in the images show endoplasmic reticulum. ... 139
ANEXE-1
Fig. A-2.1. 1. Fonctionnalisation séquentiel des nanoparticles de ZnGa1.995Cr0.005O4. ... 168
Fig. A-2.1. 2. Réponses électrophorétiques pour la caractérisation des ZGO fonctionnalisés avec des groupes fonctionnels variés... 169 Fig. A-2.1. 3. Diamètre hydrodynamique (à 1,0 mg/mL) à des valeurs de pH variées (pH 6,0 ‐‐‐‐‐, 6,5 –∙–, 7,0 ∙∙∙∙∙∙, 7,4 ——, and 8,0 –––) estimés par DLS (A), profils électrophorétiques (à 0,2 mg/mL) obtenues par CZE (B) et potentiel zeta de ZGO-OH dans tampon phosphate 30 mM dérivée des mesures de mobilité, soit par CZE (ligne en pointillé) ou par LDE (ligne continue) (C). Conditions de séparation: capillaire de silice fondue: 50,0 μm d.i., 35,0 cm de longueur totale, 26,5 cm de longueur effective; injection: 10 s à 20 mbar; tension appliquée: 12 kV; détection par absorption UV à 200 nm; température capillaire: 25 ◦C. (n = 4 répétitions, et les barres d'erreur représentent l'écart-type). ... 170 Fig. A-2.2. 1. Représentation schématique de la méthode électrocinétique de Hummel-Dreyer pour l’évaluation des interactions entre nanoparticles et protéines. EOF: Écoulement électroosmotique. ... 172 Fig. A-2.2. 2. Électrophérogrammes représentatifs à λ = 200 nm pour la calibration externe d’accord à la méthode de Hummel-Dreyer. Les pics de vacance correspondent à l’injection d’électrolyte support (tampon phosphate pH 7.4 à force ionique 60 mM) dans un capillaire rempli avec du BSA à des concentrations différentes (a-DMF, b-0,10, c-0,15, d-0,20, e-0,25, f-0,30, g-0,60 et h-0,90 μmol L-1). La courbe d’étalonnage insérée correspondant à
ces mesures. ... 173 Fig. A-2.2. 3. Electrophérogrammes représentatifs obtenus à λ = 200 nm avec la méthode
Hummel-Dreyer pour l’analyse des interactions BSA/ZGO-NP dans des tampons phosphate (pH 7.4) à force ionique 60 mM. ... 174 Fig. A-2.2. 4. A) Courbes d’association pour des interactions entre la BSA et les ZGO-PEG dans le tampon phosphate (pH 7.4) à force ionique variée. B) Courbes obtenues d’accord à l’équation de Scatchard. Les barres d’erreur indiquent ± écart type de quatre mesures. . 176 Fig. A-2.2. 5. Électrophérogrammes représentatifs pour l'évaluation des interactions entre
ZGO-PEG3h ou ZGO-PEG5h et la HSA selon la méthode Hummel-Dreyer à forces ionique
différentes. La concentration de la HSA pour cet exemple est de 0,9 μM. ... 177 Fig. A-2.3. 1. Électrophérogrammes représentatifs pour l'évaluation des interactions selon la
a) DMF, b) 0, c) 0,12, d) 0,24, e) 0,72, f) 0,96, et g) 1,44 μM de la protéine correspondante.
... 179
Fig. A-2.3. 2. Electropherogrammes pour l’évaluation des interactions entre ZGO-PEG avec des mélanges d’ApoE et HSA: en A) la concentration de la HSA a été fixé et l’ApoE variée. En B), la HSA a été variée, tandis que la concentration d’ApoE reste constante. Les signales en lignes noires correspondent à l’injection des NPs pour l’évaluation des interactions, tandis que les lignes bleus correspondent à l’injection d’électrolyte support. Pour l’étalonnage les valeurs indiquent les concentrations totales des protéines dans le mélange des protéines en considérant la dilution. BGE: tampon de carbonate d’ammonium (pH 8.0) à force ionique 15 mM. E=14.0 kV. ... 181 Fig. A-2.4. 1. Spectre UV-Visible pour l’évaluation de la production de O2•- dans le temps. A)
ZGO-OH stimulé par la lumière UV, B) ZGO-ZGO-OH stimulé par la lumière visible. Effet du type de la lumière sur le spectre UV-Visible pour l´évaluation de la génération de O2•- par C)
ZGO-OH et D) ZGO-PEG après deux heures d’excitation comme indiqué par la réduction de XTT 100 μM. ... 184 Fig. A-2.4. 2. Internalisation cellulaire in vitro de A) ZGO-OH, B) ZGO-PEG et C) Contrôle à [0,05 mg/mL] par MDA-MB-231 24 heures après l’administration. Les flèches indiquent les noyaux cellulaires... 185 Fig. A-2.5. 1. Biodistribution des ZGO-NPs (ZGO-OH et ZGO-PEG) pré-exités lors de linjection intraveneuse de 2 mg/souri, et activation in situ après 1 heure et 4 heures. (1 unité= 2800 photons/s∙cm2∙stéradians). ... 187
Fig. A-2.5. 2. Images de foie (F) et rate (R) des souris 6 mois après l’injection de ZGO-NP à des concentrations de 8 mg/souris. Les flèches dans les images signalent le réticulum endoplasmique. ... 189
TABLES CHAPTER I
Table 1- 1. Commonly used techniques to evaluate the stability of nanoparticles. ... 29
CHAPTER III
Table 3- 1. Summary of model fitting parameters according to the Hummel-Dreyer method for BSA/ZGO-PEG complexes. ... 78
CHAPTER IV
Table 4- 1. Size and zeta potential of sequentially functionalized ZGO-OH and ZGO-PEG in 30 mM
phosphate buffer, and ZGO-NH2 in 10 mM MOPS buffer (at pH 7.4). ... 85 Table 4- 2. Summary of model fitting parameters according Hummel-Dreyer study for
HSA/ZGO-Table 5- 1. Summary of model fitting parameters according HD-CE analysis for HSA/ZGO-PEG,
and ACE for ApoE/ZGO-PEG complexes in ammonium carbonate buffer pH 8.0 at 30 mM ionic strength. ... 101
CHAPTER VI
Table 6- 1. ZnGa1.995Cr0.005O4 characterization in pH 7.4 phosphate buffer solution. ... 113
Table 6- 2. IC50 values (μg/mL) of the nanoparticle cytotoxicity to different cells by trypan blue
assay. ... 121
CHAPTER VII
Table 7- 1. Hematic biometry of ZGO-NPs treated mice at short and long term after administration (n=2); WBC, white blood cells; LYM, lymphocytes; GRAN, granulocytes; RBC, red blood cells; HGB, hemoglobin; HCT, hematocrit; PLT, platelets. *Statistically different vs. the control (p<0.05) by Tukey-HSD test, (n=4). ... 136
ANEXE-1
Tableau A.2- 1. Résumé des paramètres d'ajustement selon la méthode Hummel-Dreyer pour les
complexes BSA/ZGO-PEG obtenues par l'équation de Scatchard. ... 177 Tableau A.2- 2. Paramètres d’interaction d’accorde à la méthode Hummel-Dreyer pour l’étude des complexes HSA/ZGO-PEG3-5h. ... 178
Tableau A.2- 3. Résumé des paramètres d’interaction obtenues d accord a l’analyse HD-CE pour HSA/ZGO-PEG, et ACE pour les complexes ApoE/ZGO-PEG dans le tampon de carbonate d’ammonium pH 8.0 à force ionique 30 mM. ... 180
CHAPTER I.
1.1. PERSISTENT LUMINESCENCE NANOPARTICLES FOR BIOMEDICAL
IMAGING
1.1.1. Luminescent nanoparticles for optical imaging
Optical imaging is a rapidly developing field of research aimed at noninvasively interrogating animals for disease progression, evaluating the effects of a drug, assessing the pharmacokinetic behavior, or identifying molecular biomarkers of diseases [1]. The first medical imaging was realized in the late 1895 by Wilhelm Röntgen shortly after he discovered X-ray and applied it to capture the images of the bones of a hand on film [2]. The immediate consequence of this discovery triggered intense development of new imaging technologies, such as X-ray computed tomography, magnetic resonance imaging, positron emission tomography, ultrasound and optical imaging, that are indispensable to medicine diagnostic [2, 3]. These imaging technologies differ predominantly in resolution, penetration depth, temporal resolution and energy expended for generation of the image.
Today, these modern imaging technologies coupled with newly developed imaging probes facilitate the integration of complex biological and physical phenomena into the rapid visualization process at a molecular level [4-6]. A pre-requisite of molecular imaging is precisely the development of specific, targeted imaging contrast agents to assess the biological processes, hence different kind of compounds with optical properties are being studied [7].
Nanotechnology is emerging as a versatile tool for biomedical applications, and the field of optical imaging is not excluded. Nanomaterials possess at least one dimension between 1 and 100 nm, and at this scale, unique physical, chemical and optical properties have been discovered. In the Figure 1.1 is illustrated an approximate comparison of the nanoparticle size with other relevant structures.
In addition, the nanoparticle size influences the capacity to interact with molecules or cellular elements in living organisms, which enhance their applications, i.e. luminescent nanoparticles for biomedical imaging.
Luminescence is an emission of light by a substance not resulting from heat, and it can be described according to excitation source and the duration of the emission after the end of the excitation in fluorescence (nanoseconds) or phosphorescence (some seconds) [9]. Certain features of luminescent nanoparticles, such as multi-functionality, multivalency, and the ability to carry large payloads have made them the subject of intense researches, and a great variety of configurations have been synthesized, i.e. semiconductor quantum dots, fluorophore-encapsulated silica nanoparticles, gold nanoclusters, carbonaceous materials (carbon-dots, nanodiamonds), up-conversion nanoparticles, metal oxide nanoparticles, rare earth nanoparticles, etc. [10-12].
However these nanomaterials present several limitations such as short light emission time, low sensibility (especially due to tissue autofluorescence under external illumination) and weak tissue penetration of low wavelength excitation light [13, 14]. Current optical imaging probe applications are hampered by poor sensitivity, being one of the principal reasons to develop new luminescent nanomaterials. Innovative materials with a property known as persistent luminescence promise surpass some of these disadvantages.
1.1.2. Persistent luminescence nanoparticles
The persistent luminescence is the optical phenomenon presented by some compounds whose light emission remains for extended periods of time after the excitation source has been turned off, with a record of time of more than several hours [15, 16].
The well-documented history of persistent luminescence as a phenomenon dates from the beginning of the 17th century, when an Italian shoemaker, V. Casciarolo [17], observed strong
luminescence from the mineral barite (BaSO4) in its reduced form (BaS) containing different trace
impurities, later to be known as “Bologne stone”. Several books were written about this “miraculous” phenomenon (Figure 1.2).
Despite no explanation being found for the persistent luminescence, the applications were taken into use until the 20th century, principally as luminous paints, which were based on persistent luminescence from the different sulphide materials such as copper-doped BaS, showing both weak and short light emission [18].
The introduction of the rare earth based phosphors to ameliorate these limitations takes place in the 1960s, however, a negative collateral effect was incorporated: the afterglow, by which the emission was retarded and in many cases weakened as result of the formation of traps to store the excitation energy [17].
Fig. 1. 2. The book Litheosphorus Sive de Lapide Bononiensi by Fortunius Licetus (Bologna, Italy, 1640) on the persistent luminescence of the Bologna stone [17].
Due to this problem, persistent luminescence remained almost disregarded until 1995, when the new persistent luminescence era was born with the Eu2+ doped and rare earth (R3+) co-doped
alkaline earth aluminates (MAl2O4:Eu2+,R3+; being M Ca and Sr) synthesis [19].
Since then, a lot of new compounds have been developed. Presently, there are Eu2+ based
persistent luminescence phosphors emitting across all the visible electromagnetic spectra (Figure 1.3). However, for these materials the persistent luminescence is not so long nor strong at the red region, representing a predicament for some applications [17].
During the past few decades, the research on persistent luminescence materials has been focused mainly on Eu2+-doped compounds. Actually, they represents only 20% of the total number
of known persistent phosphorous, which has increased to over 200. Other compounds are not based on Eu2+, but rather, on intrinsic host defects, transition metals or trivalent rare earths (cerium,
terbium, dysprosium, etc.) [17]. For an extensive list of the actually known persistent nanomaterials, we could refer to the reviews from Smet P. et al. [20] and from Viana B. et al. [21]. These kinds of materials have been principally used in safety indications, road signs, safety clothing, billboards, toys, graphic arts and interior decoration [22] (Figure 1.4).
Fig. 1. 4. Persistent luminescence applications [22].
Their use in the form of nanoparticulate materials for biomedical applications for in vivo imaging has been barely suggested for the first time in 2007 by de Chermont et al. [14]. Contrary to classical fluorescent probes that need to be constantly excited to produce a signal, persistent luminescence nanoparticles have the capacity to store excitation energy in traps and then to emit light for a long period of time, from dozen of minutes to hours upon thermal activation [23]. This property is of particular interest for in vivo bioimaging applications since it allows complete avoidance of the autofluorescence signal coming from endogenous chromophores also excited when using fluorescent probes. Due to this series of advantages, the research regarding biomedical applications has increased since the pioneer work presented in 2007 (Figure 1.5) (adapted from [24], and actualized).
Fig. 1. 5. Number of papers published (from Web of Science). At the left side, with the key words “persistent luminescence” and “in-vivo imaging” ; at the right side with the key words “persistent
luminescence” and “nanoparticles” (adapted from [24]).
The exact models to explain the persistent luminescence phenomena are far from being understood. In general, a persistent luminescence process requires the presence of abundant traps able to trap carriers such as electrons, holes, or pairs of both, and immobilize them for a long period of time and thereby, retain the energy for a long period of time before being emitted as photons for example by thermal activation [25]. Taking into account the current models, it is necessary to consider the matrix, the dopants and co-dopants agents when designing persistent luminescence materials because their selection can impact directly on the intensity and duration of persistent luminescence, ranging from seconds to hours, and in the emission wavelength. Furthermore, the thermal bleaching and interaction of the dopants with electron traps, recombination centers or crystal lattice, are of particular significance because persistent luminescence has been related with the defects in the molecular network and with the concentrations of the elements present in it [26].
The main requirements that the persistent luminescence materials must fulfill for in vivo biomedical imaging purposes are the followings [21]:
i) Nanometric size (< 100 nm) ii) Persistent emission over hours
iii) Intensive emission in the tissue transparency window iv) Adequate functionalization
v) Chemical and colloidal stability in aqueous solution
The tissue transparency window (also called “biological optical window” or simply “therapeutic window”) is the region of the electromagnetic spectrum in which tissues are most transparent, as said, between 600 nm and 1300 nm. This region is demarcated by the combination of absorption of lower wavelength light by the important tissue chromophores (oxy and deoxyhemoglobin and melanin) together with reduced light scattering at longer wavelengths and the occurrence of water absorption at wavelengths greater than 1300 nm (See Figure 1.6) [27].
0 5 10 15 20 25 2007 2008 2009 2010 2011 2012 2013 2014 2015
![Fig. 1. 6. Absorption spectra of important chromophores present in mammalian tissues [27]](https://thumb-eu.123doks.com/thumbv2/123doknet/2325185.30182/34.918.251.663.106.503/fig-absorption-spectra-important-chromophores-present-mammalian-tissues.webp)
![Fig. 1. 11. Schematic representation of the in vivo imaging after in situ activation of the ZGO-NP [33]](https://thumb-eu.123doks.com/thumbv2/123doknet/2325185.30182/38.918.140.777.107.435/fig-schematic-representation-vivo-imaging-situ-activation-zgo.webp)
![Fig. 1. 15. The tissue-specific extravasation of nanomaterials. A) Liver, B) spleen, C) kidney, and D) lung [126]](https://thumb-eu.123doks.com/thumbv2/123doknet/2325185.30182/48.918.134.790.321.771/fig-tissue-specific-extravasation-nanomaterials-liver-spleen-kidney.webp)
![Fig. 1. 16. Illustration of attractive and repulsive forces between nanoparticles according DLVO theory [147]](https://thumb-eu.123doks.com/thumbv2/123doknet/2325185.30182/52.918.155.743.459.968/illustration-attractive-repulsive-forces-nanoparticles-according-dlvo-theory.webp)
![Fig. 1. 19. A comprehensive scheme for the control and optimization of nanoparticle synthesis and properties based on analytical electrokinetic methodologies (Adapted from [192])](https://thumb-eu.123doks.com/thumbv2/123doknet/2325185.30182/60.918.140.793.235.681/comprehensive-optimization-nanoparticle-synthesis-properties-analytical-electrokinetic-methodologies.webp)