HAL Id: hal-01021694
https://hal-enac.archives-ouvertes.fr/hal-01021694
Submitted on 30 Oct 2014
HAL is a multi-disciplinary open access
archive for the deposit and dissemination of
sci-entific research documents, whether they are
pub-lished or not. The documents may come from
teaching and research institutions in France or
L’archive ouverte pluridisciplinaire HAL, est
destinée au dépôt et à la diffusion de documents
scientifiques de niveau recherche, publiés ou non,
émanant des établissements d’enseignement et de
recherche français ou étrangers, des laboratoires
Evil waveform test-bed design
Christophe Macabiau, Willy Vigneau, Dominique Houzet
To cite this version:
Christophe Macabiau, Willy Vigneau, Dominique Houzet. Evil waveform test-bed design. NAVITEC
2001, 1st ESA Workshop on Satellite Navigation User Equipment Technologies, Dec 2001, Noordwijk,
Netherlands. �hal-01021694�
EVIL WAVEFORM TEST-BED DESIGN
Christophe MACABIAU(1), Willy VIGNEAU(2), Dominique HOUZET(3)
(1)ENAC
7, Avenue Edouard Belin BP 4005
31055 TOULOUSE CEDEX 4 [email protected]
(2)M3SYSTEMS
1, rue des Oiseaux 31410 LAVERNOSE LACASSE [email protected] (3)ENSEEIHT 82, rue Camichel 31000 TOULOUSE [email protected] I. INTRODUCTION
Several types of failures can occur in the GPS satellites that transmit the ranging signals to the users. Among them, a specific type of failure in the signal generation process aboard the satellite may result in an anomalous waveform being transmitted, called an ‘evil waveform’.
Evil waveforms are GPS signals that have a distorted PRN code modulation waveform. The main impact is a rupture of the symmetry of the cross-correlation peak inside the tracking channel, therefore inducing a different measurement error for two receivers that would not have the same architecture. As a consequence, there is a potential for evil waveforms to induce large tracking errors of differential systems if left undetected.
Simulations of the impact of these evil waveforms using simplified GPS receiver simulators with harmonized assumptions have been conducted by several teams. This includes simulations of the performance of the ground monitoring techniques and tracking errors induced by these waveforms [2]. Only a small number of practical results were reported about the behavior of real receivers tracking evil waveforms [2].
ESTEC has decided to develop a test-bed to increase the knowledge on the true effect of evil waveforms on real receivers since few results exist on the subject. The test set-up will allow to :
• understand how real receivers behave when tracking evil signals (deformation of correlation function, acquisition
and tracking points),
• find-out if their behavior is conform to what can be predicted using receiver simulators,
• analyze what exactly is the performance of the different ground monitoring techniques.
This test-bed is developed jointly by M3SYSTEMS, ENAC and ENSEEIHT.
II. EVIL WAVEFORM MODEL
Evil waveforms are GPS signals that have a distorted PRN code modulation waveform. The deformation is modeled by a lead or a lag of the rising or falling edges of the modulation code, and/or by a second-order filtering of this waveform.
The main impact is a rupture of the symmetry of the cross-correlation peak inside the tracking channel, therefore inducing a different measurement error for two receivers that would not have the same architecture.
As a consequence, there is a potential for evil waveforms to induce large tracking errors of differential systems. This potential danger pushed the Global Navigation Satellite System Panel (GNSSP) of the International Civil Aviation Organization (ICAO), and the RTCA SC-159, to propose sections in the standards that would guarantee the safe operation of differential GPS.
Several teams gathered their efforts to tackle that problem, and it was proven from simulation results that an adequate ground monitoring technique exists and that constraints on the airborne receiver could be proposed to make sure the differential tracking error does not exceed the required accuracy level.
The evil waveform is a GPS signal that has a distorted PRN code modulation waveform. The failure giving birth to an evil waveform occurs in the code modulation generation channel only, therefore the transmitted carrier is not affected. Two types of failure can occur that result in an evil waveform being radiated. A failure in the digital code chip generation module can alter the synchronization of some of the C/A code chip edges. A mismatch of the analog band-limiting filter can distort the physical waveform being transmitted.
As a consequence, the model proposed in [1] is a PRN signal affected by one or both of the following effects:
2. The modulation is filtered by a 2nd order filter characterized by two parameters:
• σ=δωn where δ is the damping factor and ωn/2π is the frequency.
•
1
22
π
δ
ω
−
=
n dF
is the resonant frequency.Usually, σ and Fd are expressed in MHz.
Several types of threat models are considered:
• Threat model A: this type of evil waveform contains only the lead/lag effect. In that case, σ=0, Fd=0 and the
accepted range of values for ∆ is: –0.12 Tc ≤ ∆ ≤ 0.12 Tc.
• Threat model B: this type of evil waveform contains only the 2nd order filtering effect. Therefore, ∆=0 and the
possible range of values for σ and Fd is: 0.8 MHz ≤ σ ≤ 8.8 MHz, 4 MHz ≤ Fd ≤ 17 MHz.
• Threat model C: this type of evil waveform contains both effects. The possible range of values is: –0.12 Tc ≤ ∆ ≤
0.12 Tc, 0.8 MHz ≤ σ ≤ 8.8 MHz, 7.3 MHz ≤ Fd ≤ 13 MHz.
III. IMPACT OF EVIL WAVEFORM ON RECEIVERS
Model A evil waveforms add a periodic line spectrum to the nominal C/A code power spectrum density. This
additive line spectrum has a
sin
(
π
f
∆
)
π
f
∆
envelope. Moreover, model A evil waveforms raise the DCcomponent of the code modulation by an amount close to
∆
2
due to the near balance of 0s and 1s in each C/A code.As indicated in [Enge et al., 1999], the cross-correlation between model A evil waveforms and a nominal C/A code
shifts the top section of the triangle by ∆/2, and introduces a plateau of width ∆.
Model B evil waveforms raise all the frequency components of the code spectrum located around Fd,. As a result,
the cross-correlation function is also filtered by the 2nd order filter.
Model C evil waveforms are a combination of the lead/lag effect with the 2nd order filtering effect.
IV. TEST-BED ARCHITECTURE
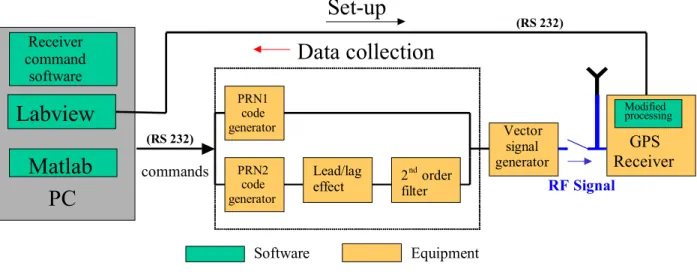
The General test bed architecture can be broken down into the following building blocks :
• Baseband IF Signal generator: This generator is designed to output the baseband evil waveform signal. It includes a
digital unit providing analog undisturbed baseband GPS signals with two different C/A code (PRN1 and PRN2) . One of these signals is crossing a module that provides the lead/lag effect on the rising edge of chips, the output is
the model A evil waveform. This signal is fed to a 2nd order filter designed to add model B evil waveform
generation capability. The output of this baseband IF Signal generator is the sum of the undisturbed signal and the model C evil waveform (or model A or B according to the modules’ parameters), both in baseband. The whole signal generator functions are provided by a numeric card (FPGA) described in Section V.
• RF Signal generator:. This is an Off The Shelf signal generator performing the modulation of the L1 carrier by the
baseband modulation signal. The selected equipment is Vector signal generator – SMIQ – Rohde & Schwarz.
• Receiver: For determining the measurement error induced by evil waveforms, the receiver can be any GPS receiver
providing raw data output. For testing the performance of evil waveform monitoring techniques, the receiver selected is a NovAtel Millenium receiver with specific multi-correlator software (Cf. Section 6). This receiver will also be extensively used for range error analysis due to its large RF bandwidth and its capability to have various chip spacings and discriminator types.
• Evil waveform events monitoring : The system is composed of the NovAtel Millenium receiver with the
multi-correlator software, whose outputs are collected in real time with a LabView module running on a PC, implementing an SQM technique.
Matlab
Labview
Vector signal generatorGPS
Receiver
Set-up
Data collection
RF SignalPC
(RS 232) Software Equipment Modified processing 2 nd order filter Receiver command software (RS 232) commands Lead/lag effect PRN2 code generator PRN1 code generatorFigure 1: Test Bed Configuration
Figure 2 shows the test bed that has been developed. The baseband signal generator block is provided by the electronic card – metallic box-, the RF signal generator is the SMIQ 02B at the bottom-left of the picture, events monitoring are assumed by the computer, and the receiver is the black box on the generator. The additional equipment used for development and validation phases is a frequency meter and an oscilloscope (on the SMIQ).
Figure 2: Evil Waveform Test Bed
V. EVIL WAVEFORM GENERATOR
The board is using a set of a digital unit delivering model A evil waveforms, and the 2nd order filter. The digital
unit is designed to output the analog baseband GPS signal including rising or falling edge shifts corresponding to model A evil waveforms. This unit is a FPGA circuit reading memories containing valid navigation messages and the PRN to be generated. The FPGA will also have the capability to delay the rising or the falling edges of the bit transitions by triggering counters driving latches.
This output will then have to be fed to a 2nd order filter implemented in the second digital unit. The
combination of the module adding the delays on the bit transitions and the 2nd order filter allows the generation of any
GPS evil waveform.
Two PRNs signals are generated in baseband: one of them is not affected by the evil waveform, the second one is affected. This is done so that the GPS receiver can provide two pseudorange measurements than can be differenced to yield directly the pseudorange measurement error induced by the evil waveform.
trigger the generation of the C/A code chip edges. That 10 MHz reference is also internally used by the SMIQ itself to generate the L1 carrier. Such a synchronization is required so that the receiver can track signals for which the dynamics on the carrier is identical to the dynamics on the code modulation.
The general architecture of the board used to generate the evil waveform is given in figure 3:
Modulo 2 adder Navigation Data stream Generator PRN2 code generator Ligne retard RS232 Downloading CONTROL SMIQ I Q Lead /Lag Effect Clock 10 Mbps D/A converter 2nd order Filter PRN2 code generator 1.023Mbps (1 ms/cycle) 1.023Mbps (1 ms/cycle) Modulo 2 adder 50 bit/s (12,5 min/cycle)
Figure 3: Evil Waveform Generator Architecture
Figure 4 shows an example of the code tracking error that can be observed with a nominal signal when no evil waveforms are applied.
-0 1 -0,05 0 0,05 0,1 0,15 1 5 9 13 17 21 25 29 33 37 41 45 49 53 57 61 65 69 73 77 81 85 89 93 97 101 105 109 113 117
Figure 4: Nominal tracking error in absence of evil waveforms.
VI. MULTICORRELATOR RECEIVER
The receiver used in the test-bed is a Novatel Millenium receiver. That receiver can provide as much as 48 correlator output pairs (48 on I, 48 on Q), where all correlators are slaved to the punctual determined by one tracking pair in one tracking channel.
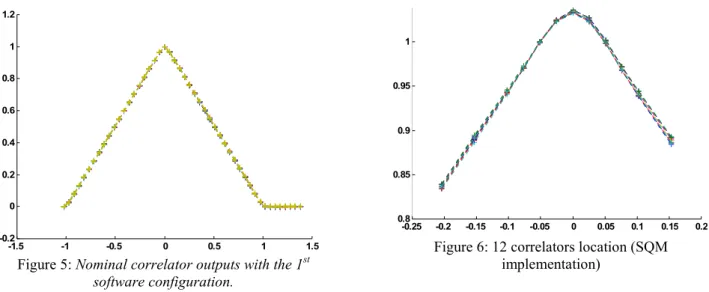
The first software has a single tracking channel providing 48 correlator output pairs with 5 distributions (evenly spaced correlator, leading or trailing edge only, peak intensive distribution, and ultra wide spacings). Correlator ouputs observed with the first configuration with nominal signal conditions are shown in figure 5.
-1.5 -1 -0.5 0 0.5 1 1.5 -0.2 0 0.2 0.4 0.6 0.8 1 1.2
Figure 5: Nominal correlator outputs with the 1st
software configuration. -0.25 -0.2 -0.15 -0.1 -0.05 0 0.05 0.1 0.15 0.2 0.8 0.85 0.9 0.95 1
Figure 6: 12 correlators location (SQM implementation)
The second software is a multiple correlator outputting 12 correlator pair values (12 I and 12 Q) for 4 tracking channels. In each channel, all the correlators are slaved to the tracking pair and placed at the location (in each of the 4 channels) as illustrated in figure 6. This software version is designed to implement the SQM candidate 2b described in [Ref. 11]. Finally, the third software version has a single tracking channel and allows 4 chip spacings (0.05, 0.1, 0.2, 0.5, 1.0) with traditional dot-product discriminator (figure 7), and 3 chip spacing sets (0.05-0.1, 0.1-0.2, 0.2-0.4) with double delta discriminator. -1 -0.8 -0.6 -0.4 -0.2 0 0.2 0.4 0.6 0.8 1 0 0.1 0.2 0.3 0.4 0.5 0.6 0.7 0.8 0.9 1
Figure 7: Possible E-L tracking pairs with 3rd SW version
-1 -0.8 -0.6 -0.4 -0.2 0 0.2 0.4 0.6 0.8 1 0 0.1 0.2 0.3 0.4 0.5 0.6 0.7 0.8 0.9 1
Figure 8: Possible ∆∆ tracking pairs with 3rd SW version
VI. OBSERVATION OF CORRELATION FUNCTIONS
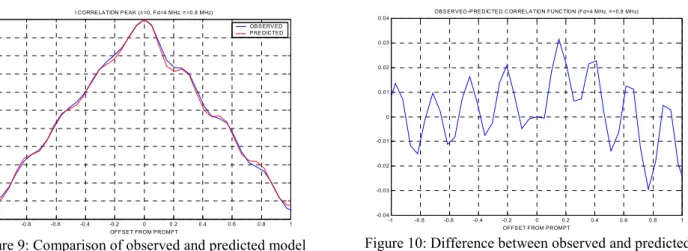
One of the tasks of the test plan is to observe the correlation function of the signal affected by the evil waveform with the local C/A code. That analysis is done to determine what exactly is the real influence of evil waveforms on true receivers, and also to check how close the correlation shapes predicted with the simulation software are to the observed functions. Figures 9 and 10 show an example of a comparison between the observed and the predicted correlation functions.
-1 -0.8 -0.6 -0.4 -0.2 0 0.2 0.4 0.6 0.8 1 -0.1 0 0.1 0.2 0.3 0.4 0.5 0.6 0.7 0.8 0.9 OF F SE T FROM PROMP T I CORRE LA TION P E AK (∆=0, F d=4 MHz, σ=0.8 MHz) OB S ERV ED PRE DICTED
Figure 9: Comparison of observed and predicted model B correlation functions. -1 -0 .8 -0.6 -0.4 -0.2 0 0.2 0.4 0.6 0 .8 1 -0.04 -0.03 -0.02 -0.01 0 0.01 0.02 0.03 0.04 OF FS ET FROM PROMPT
OBS ERVE D -P RE D IC TE D C ORRE LATION FUNC TION (Fd=4 MHz, σ=0.8 MHz)
Figure 10: Difference between observed and predicted model B correlation functions.
As we can see from these 2 figures, the main effect of the oscillations is predicted with good accuracy although a deviation is visible. That deviation has a maximum value of 0.03, and is globally lower than 5% in the interval [-0.5; 0.5] chip of the correlation function.
VII. CODE TRACKING ERROR
Another task included in the test plan is to observe the tracking error induced by evil waveforms. That analysis is done to determine what exactly is the influence of evil waveforms on a receiver tracking loop and to compare the predicted values with the observed values.
Figures 11 and 12 show the evolution of the observed and predicted tracking errors induced by a model A evil waveform on an E-L 0.05 chip DLL and a 0.2 chip DLL.
Figure 11 : Comparison between observed and predicted effect of model A EWF on an E-L 0.05 chip
DLL
Figure 12 : Comparison between observed and predicted effect of model A EWF on an E-L 0.2 chip
DLL
The linear evolution of the tracking error seen on these 2 figures can be explained by the predicted effect of a model A evil waveform on the correlation peak. In the case of an infinite bandwidth receiver, a model A evil waveform creates a plateau of width ∆ on the correlation function and shifts the correlation function by ∆/2. Therefore, as the receiver used has a wide bandwidth (BW2=16 MHz), the tracking error grows as ∆/2 as long as ∆ is lower than the chip spacing. Some distortions to that simple value are introduced when ∆ is larger than the chip spacing.
The software used to predict the measurement error takes all this into account, but we can see that the predicted value deviates from the observed value as ∆ grows (0.8 m for ∆=0.12 Tc for a 0.05 chip DLL in figure 11, 0.6 m for ∆=0.12 Tc for a 0.2 chip DLL in figure 12). That behaviour may be due to several factors: first of all, the ∆ value
affecting the PRN modulation may have a few percent incertitude. Secondly, as the DLL chip spacing is smaller than ∆, the DLL locks on a point that is difficult to predict because of the flatness of the discrimination function in those cases.
Globally, the error is lower than 0.8 m for all configurations tested, which is satisfying.
Figures 13 and 14 show a comparison between the observed and predicted tracking errors induced by a model B evil waveform on an E-L 0.1 chip DLL.
Figure 13: Evolution of the observed tracking error in
presence of a model B evil waveform. Figure 14: Deviation between the observed and the
predicted tracking error (model B evil waveform).
Figure 13 represents the evolution of the observed tracking error as a function of Fd and σ. As we can see, for a
specific σ, the error decreases when Fd increases. This is due to the combinations of two effects: first of all, as Fd increases, the tracking error decreases in the case of an infinite bandwidth receiver. Then, the filtering effect applied by the receiver front-end filter reduces the amount of high-frequency components entering the tracking loops. As we can see, the effect of model B evil waveforms is quite constant starting from Fd=9 MHz.
We can see from the contour plot in figure 14 that the deviation between the observed and predicted tracking
errors is maximum when Fd is lower than 8 MHz. In that region, the maximum deviation is –1.9 m (observed 9.6 m /
predicted 11.5 m) for Fd=4 Mhz and σ=3.8 MHz. The deviation here may be due to the implementation of the second order filter that was done on the FPGA and to our capacity to model the RF front-end filter. The waveform is encoded on 8 bits, which is perhaps too small a number of bits to represent the waveform. Then, the true RF front-end filter differs from our best model. That deviation represents an 18% accuracy, which we feel is quite large. Current efforts aim at understanding whether this deviation is due to the model B evil waveform implementation in the EWF generator or to an inadequate receiver filter model.
VII. CONCLUSION
A test-bed for evaluation of the effect of evil waveforms on real receivers is in development for ESA. That test-bed is designed to provide knowledge on the true impact of evil waveforms on the correlation function and on the tracking error, as well as to test the performance of SQM techniques.
The test-bed is composed of a baseband generator that can generate all evil waveforms in models A, B and C, delivering a signal to a vector signal generator to which a real receiver can be connected.
Initial correlation function observations show a good consistency between the predicted and observed deformations (less than 5% error in the [–0.5; 0.5] chip region.
The pseudorange error measurements in most of the possible cases have been done. The first analyses of the observed and predicted errors that were conducted are satisfying for model A evil waveforms (0.8 m max deviation between observations and predictions). Those analyses are not completely satisfying for model B evil waveforms (1.9 m max deviation), and efforts will are made to determine whether this deviation may be due to the EWF generator or to the receiver filter model.
REFERENCES
[1] P. ENGE, E. PHELTS and A. MITELMAN, « Detecting Anomalous Signals from GPS Satellites », Global Navigation Satellite System Panel meeting, Toulouse October 18-29 1999, working paper 19.
[2] C. MACABIAU, E. CHATRE, « Signal Quality Monitoring for Protection of GBAS Users Against Evil Waveforms », ION GPS 2000.