ÉCOLE DE TECHNOLOGIE SUPÉRIEURE UNIVERSITÉ DU QUÉBEC
THESIS PRESENTED TO
ÉCOLE DE TECHNOLOGIE SUPÉRIEURE
IN PARTIAL FULFILLEMENT OF THE REQUIREMENTS FOR A MASTER’S DEGREE WITH THESIS IN ELECTRICAL ENGINEERING
M.A.Sc
BY Jakub MAZUR
AUDITORY RESEARCH PLATFORM : TWENTY-FOUR HOUR IN-EAR DOSIMETRY
MONTREAL, AUGUST 1ST, 2016
This Creative Commons license allows readers to download this work and share it with others as long as the author is credited. The content of this work may not be modified in any way or used commercially.
BOARD OF EXAMINERS
THIS THESIS HAS BEEN EVALUATED BY THE FOLLOWING BOARD OF EXAMINERS
Mr.Jérémie Voix, Thesis Supervisor
Department of Mechanical Engineering at École de technologie supérieure
Mr.Ghyslain Gagnon, Chair, Board of Examiners
Department of Electrical Engineering at École de technologie supérieure
Mr.Frédéric Laville, Member of the Jury
Department of Mechanical Engineering at École de technologie supérieure
Mr.Christian Giguère, External Evaluator
Faculty of Health Sciences, University of Ottawa
Mr.Hugues Nélisse, External Evaluator
Institut de recherche Robert-Sauvé en santé et en sécurité du travail
THIS THESIS WAS PRENSENTED AND DEFENDED
IN THE PRESENCE OF A BOARD OF EXAMINERS AND THE PUBLIC ON JULY 8TH 2016
AUDITORY RESEARCH PLATFORM: TWENTY FOUR HOUR IN EAR DOSIMETRY
Jakub MAZUR RÉSUMÉ
La perte auditive induite par le bruit, est une lésion permanente et irréversible. Bien qu’elle soit évitable, par la mesure appropriée de la dose de bruit reçue et la limite de cette dernière, la perte auditive induite par le bruit reste l’une des maladies professionnelles les plus communes et un fléau touchant plusieurs centaines de millions d'individus dans les pays industrialisé. Elle représente également un enjeu de santé grandissant dans les milieux de vie modernes, notamment par le biais des activités de loisir bruyants, tels les sorties dans des concerts, bars ou discothèques, mais aussi pas le biais de l'utilisation d'outils motorisés bruyants ou encore par le biais de l'utilisation des appareils multimédia personnels. Les dosimètres acoustiques conventionnels, capables de mesurer la dose de bruit reçue par un individu donné, peuvent être utilisés, dans des approches de santé sécurité au travail (SST), afin de limiter les risques de pertes auditives induites par le bruit en milieu de travail. Cependant leur utilisation en conjonction avec des appareils multimédia personnels, des appareils de communication voire même de simples protecteurs auditifs, reste très difficile en pratique. De plus, ces dosimètres de bruit étant principalement adapté à des problématiques d'hygiène industrielle, ils ne sont pas conçus pour une mesure continue sur 24 heures de l'exposition au bruit : en SST, la législation actuelle se base sur un quart de travail de 8 heures, suivi d’un temps de récupération de 16 h dans un environnement « relativement calme », c'est à dire dont le niveau sonore n'excède pas 75 dB(A), ce qui n'est pas réaliste compte-tenu des activités de loisirs bruyantes citées précédemment auxquels des travailleurs sont régulièrement soumis. Il n'y a, dans la législation actuelle, aucune recommandation pour la prise en compte de cette exposition sonore récréative, ni pour la mesure en continue sur 24 heures de la dose de bruit reçue.
Aussi, pour limiter le fléau de la perte auditive professionnelle et récréative conviendrait-il de pouvoir mesurer d'une part l'exposition sonore effective d'un travailleur durant son quart de travail, et notamment en tenant compte de l'atténuation effective offerte par le port éventuel d'un protecteur auditif, mais d'autre part en mesurant également l'exposition sonore récréative induite par l'utilisation l’utilisation d’outils motorisés bruyants ou encore par le biais de l'utilisation des appareils multimédia personnels.
Ce projet de maîtrise a pour but le développement d'outils permettant la mise au point d'une telle méthode de mesure continue sur 24 heures de la dose de bruit, et compatibles tant avec la mesure de l'exposition professionnelle, incluant l'effet du port d'un protecteur auditif, qu'avec l'exposition récréatives, incluant la compatibilité avec l'utilisation des appareils multimédia personnels. À cette fin, un système embarqué, baptisé « Auditory Research Platform » (ARP), a été développé et consiste en un bouchon d'oreille sur mesure équipé de 2 microphones et 1 haut-parleur et raccordé, par fils, à un processeur numérique du signal (DSP) lequel est logé dans un boitier compact se portant à la ceinture et contrôlable, via
Bluetooth, par un téléphone ou une tablette fonctionnant sous Android. Le système ARP développé peut ainsi être utilisé pour la mesure de l'exposition sonore professionnelle, puisqu'il agit à la fois comme protecteurs auditifs sur mesure et également comme dosimètre intégrateur, mais il peut aussi mesurer l'exposition sonore induite par l'utilisation des appareils multimédia personnels, puisqu'il est précisément hébergé sur un tel système. Par ailleurs, une boite à outil Matlab intitulée « Dosimetry Toolbox » a été développée afin de permettre, en ayant recours à une application tierce, la mesure précise de la dose de bruit mais afin de permettre également la visualisation aisée des données personnalisés d'exposition au bruit. À titre illustratif, un algorithme de mesure continue sur 24 heures de la dose de bruit incluant un modèle simple de récupération de la fatigue auditive lors des périodes de non exposition a également été développé. Les sources logicielles de l'outils « Dosimetry Toolbox », de même que les spécifications matérielles de la plate-forme ARP sont distribués en libre-accès (« Open Source »), afin de permettre à la communauté scientifique de poursuivre ce travail sur la détermination d'un critère de risque pour la dosimétrie continue sur 24 heures mais aussi pour l'étude des mécanismes plus fondamentaux sous-jacents au problème de la perte auditive induite par le bruit, tels que la détermination du taux effectif et individualisé de récupération de la fatigue auditive, la détermination du niveau sonore de silence effectif, la prise en compte de la contribution sonore de la voix du porteur dans la dose voire même la détermination de la susceptibilité individuelle à la perte auditive induite par le bruit.
Mots-clés: santé et sécurité au travail, acoustique, bruit, exposition sonore, dosimetrie, sonométrie
AUDITORY RESEARCH PLATFORM: TWENTY FOUR HOUR IN EAR DOSIMETRY
Jakub MAZUR ABSTRACT
Noise induced hearing loss (NIHL) is permanent and irreversible, yet completely preventable. It remains to be one of the most common health and safety diseases in the workplace and is an increasing concern in daily urban life and recreational activities, such as live music, bars & nightclubs, and even personal media players (PMPs). Conventional ‘personal’ noise dosimeters do not easily interface with PMPs, communication devices, and HPDs, nor are they meant for 24-hour use. Not only is it quite difficult to keep track of noise exposure accumulated over a 24-hour period; there are few guidelines to follow. Current legislation is designed for 8-hour work-shifts and based on a 16-hour recovery period in a ‘relative quite’ environment (<75 dB(A)). In an effort to increase hearing protection compliance in dangerously noisy environments two common issues are addressed: 24-hour tracking of effective individual noise exposure level, including communication or PMPs, and tracking proper fit of hearing protection devices (HPDs).
The objective of this thesis is assessing the feasibility of designing a device capable of monitoring comprehensive 24-hour in-ear noise dosimetry, while interfacing with personal music players (PMPs) or communication devices. This thesis also proposes a novel algorithm for 24-hour (personal/individual/in-ear) noise dosimetry including auditory recovery while providing an open-source framework of hardware and software tools to encourage further development in this area. A custom in-ear open-source hardware ‘Auditory Research Platform’ (ARP) and an open-source Matlab ‘Dosimetry Toolbox’ have been developed for this purpose. The ARP hardware is an embedded digital signal processing system contained within a palm-sized belt-pack ready to interface with PMP, communication devices, and custom HPDs, all controllable with an Android device. The Matlab Dosimetry Toolbox is compatible with a third party iOS application and is intended to facilitate the creation of a personal noise exposure database while visualizing the results.
This Master degree thesis discusses the development of the hardware and software while identifying instrumentation challenges and highlighting several key research questions related to the risk assessment of NIHL. Preliminary laboratory studies are presented and the real-life usability of such a platform is discussed. The results of this work can be used to enable further studies revisiting damage risk criteria and further research into the underlying mechanisms of NIHL such as: recovery rate, effective silence, own voice contribution, and ultimately individual susceptibility.
TABLE OF CONTENTS
Page
INTRODUCTION ... 1
CHAPTER 1 LITERATURE REVIEW ... 5
1.1 Measurement of individual HPD attenuation ... 5
1.2 Measurement of individual noise exposure ... 7
1.3 Traditional dosimetry equipment ... 9
1.4 Legislation and standards history ... 10
1.5 Hearing science perspective ... 15
1.6 Revisiting TTS studies ... 17
1.7 Psychoacoustic noise dosimeter model ... 19
1.8 Summary ... 21
CHAPTER 2 METHODOLOGY ... 21
2.1 In-ear electroacoustic platform ... 23
2.1.1 Ear tip ... 23
2.1.2 Electroacoustic transducers ... 24
2.2 Correction factors and signal processing algorithms ... 26
2.2.1 Correction for the occluded ear canal ... 27
2.2.2 Correction factor measurement ... 227
2.3 Continuous, in-line verification of HPD attenuation ... 30
2.4 Real-time dose calculation including cumulative and recovery effects ... 32
2.5 Electronic hardware platform ... 34
2.5.1 Specifications ... 34
2.5.2 Design ... 34
2.5.2.1 Audio codecs and digital signal processors ... 35
2.5.2.2 Microcontroller ... 37
2.5.2.3 Communication protocols ... 38
2.5.2.4 Peripheral devices ... 39
2.5.2.5 Power Management ... 41
2.5.2.6 Android ... 42
2.6 Development and manufacturing ... 44
2.6.1 Parts list and schematic capture ... 45
2.6.2 PCB layout, manufacturing and assembly ... 46
2.6.3 Hardware validation ... 47
2.7 Embedded software programming and debugging ... 47
2.8 Matlab dosimetry toolbox ... 49
2.8.1 Mobile noise exposure assessment ... 51
CHAPTER 3 RESULTS ... 59
3.1 Open-Source Hardware Platform ... 59
3.1.1 Hardware Objectives ... 59
3.1.2 Hardware Status ... 60
3.2 Dosimetry Algorithm ... 62
3.2.1 Algorithm Objectives and Description ... 62
3.2.2 Demonstration of the Dosimetry Algorithm ... 62
3.3 Matlab Dosimetry Toolbox ... 68
3.4 Discussion of Results ... 68
CONCLUSION ... 71
RECOMMENDATIONS ... 73
APPENDIX I Poster I: Noise Dose ... 77
APPENDIX II Publication I: Implementing 24-hour in-ear dosimetry with recovery ... 78
APPENDIX III Publication II: Development of Dosimetric Hearing Protection Device ... 79
APPENDIX IV Publication III: In-Ear Auditory Research Platform ... 80
LIST OF FIGURES
Page
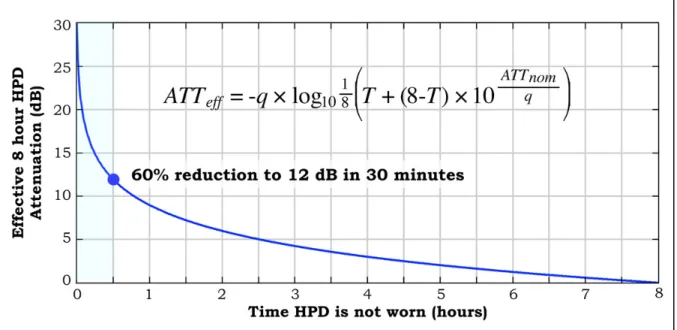
Figure 1.1 Effective 8-hour HPD attenuation vs. time HPD is not worn ... 8
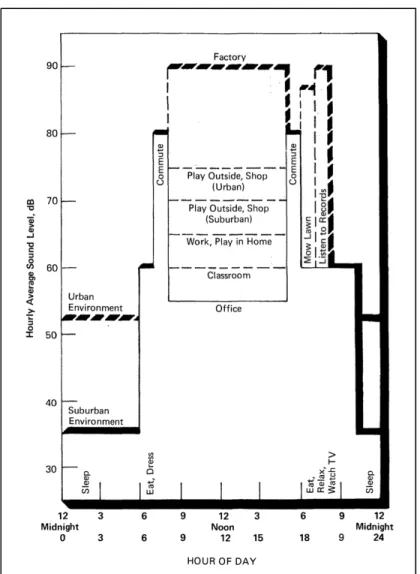
Figure 1.2 A 24-hour noise-exposure estimate graph ... 13
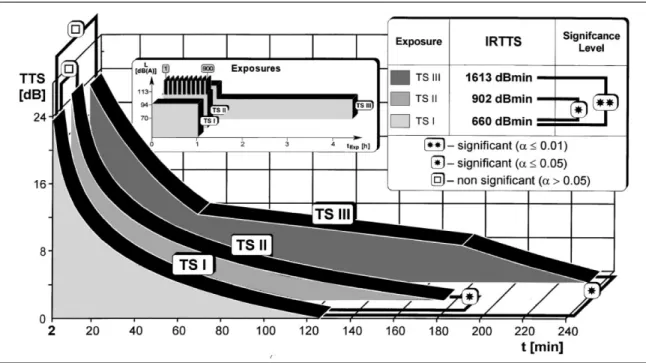
Figure 1.3 TTS recovery times for three different types of noise exposure ... 18
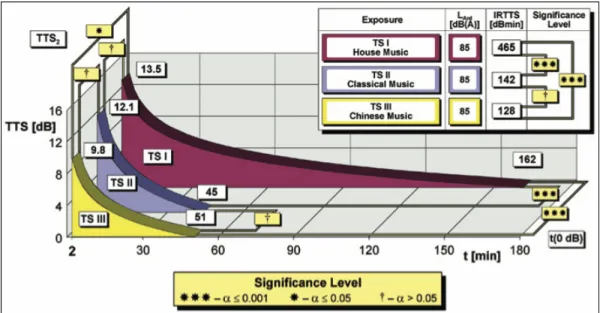
Figure 1.4 Recovery times from exposure to various genres of music ... 19
Figure 1.5 Psychoacoustic noise dosimeter model prediction ... 20
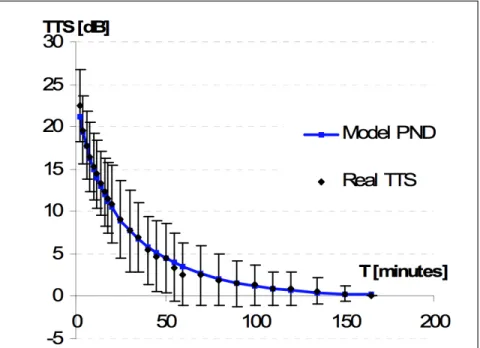
Figure 1.6 The TTS estimations of the PND model ... 21
Figure 2.1 CAD prototype of ARP earpieces ... 25
Figure 2.2 Measurement locations for traditional noise exposure assessment and modern dosimetry ... 26
Figure 2.3 Pressure variables at different locations in the open (left) and occluded ear (right) ... 27
Figure 2.4 Correction factors applied to the measurements ... 29
Figure 2.5 Effect of adjusting the recovery criterion time ... 33
Figure 2.6 High-level overview of Auditory Research Platform (ARP) ... 35
Figure 2.7 Block diagram of the digital signal processor (DSP) ... 36
Figure 2.8 Screenshot of SigmaStudioTM ... 37
Figure 2.9 Overview of the microcontroller functions used in the ARP ... 38
Figure 2.10 Overview of the peripheral devices on the ARP ... 40
Figure 2.11 Overview of the power management section of the ARP ... 41
Figure 2.12 Overview of the main Android functions used ... 43
Figure 2.13 Graphic design mock-up of envisioned ARP app interface ... 44
Figure 2.14 Overview of the flow of the ARP development and manufacturing process ... 45
Figure 2.15 CAD render of both ARP PCBs stacked ... 46
Figure 2.16 GUI screenshot of contributed ‘Dosimetry Toolbox’ for Matlab ... 49
Figure 2.17 Replicating a shoulder-worn dosimeter, using the iPhone 5S ... 52
Figure 2.18 iPhone 5S running SoundMeter ... 53
Figure 2.19 ‘Tool Options’ menu of the SoundMeter app ... 54
Figure 2.20 Specifying the Filename in the export menu of SoundMeter app ... 55
Figure 2.21 Screenshot of virtual sound level meter (VSLM) ... 56
Figure 3.1 Photo of the completed ARP hardware interfaced to Android tablet ... 61
Figure 3.2 Case-study ‘Scenario 1’ ... 66
Figure 3.3 Case-study ‘Scenario 2’ ... 68
Figure 5.1 Octave band SPL as measured in the occluded ear canal ... 74 Figure 5.2 Sequential function chart of the proposed dose and recovery algorithms 76
LIST OF ABREVIATIONS ARP Auditory Research Platform
ATS Asymptotic Threshold Shift BTE Behind-the-Ear
dB Decibel
DSP Digital Signal Processor
EPA Environmental Protection Agency GPIO General-Purpose-Input-Output HATS Head and Torso Simulator HPD Hearing Protection Device HTD Head and Torso Diffraction
IDE Integrated Development Environment IEM Inner-Ear-Microphone
IL Insertion Loss
MIRE Microphone in Real Ear
MSHA Mine Safety and Health Administration NHCA National Hearing Conservation Association NIHL Noise Induced Hearing Loss
NIOSH National Institute for Occupational Safety and Health NIPTS Noise-Induced Permanent Threshold Shift
NITTS Noise-Induced Temporary Threshold Shift NRR Noise Reduction Rating
OEM Outer-Ear-Microphone
OER Occluded Ear Canal Resonance OHC Outer Hair Cells
OSHA Occupational Health and Safety Administration PCB Printed Circuit Board
PMP Personal Media Players
PND Psychoacoustic Noise Dosimeter REAT Real-Ear-at-Threshold
SDIO Serial-Data-Input-Output SPI Serial-Peripheral-Interface SPL Sound Pressure Level TF Transfer Function
TFOE Transfer Function of the Open Ear TTS Temporary Threshold Shift TWA Time Weighted Average
LIST OF SYMBOLS AND UNITS OF MEASUREMENTS i Increment in discrete time
Kr Maximum auditory recovery rate
LAeq(IEM) Estimated free-field equivalent level based on actual measured in-ear levels
LAeq(NR) Estimated free-field equivalent level based on NR of well-fitted earplug
LAeqi A-weighted equivalent level for the ith interval
Lc Criterion level
Lp Free-field sound pressure level
LpA A-weighted free-field sound pressure level
LpFF Free-field sound pressure level
LpIEM SPL measured inside the occluded ear canal using the IEM
LpOEM SPL measured outside of the user’s HPD near the entrance of the ear canal
Ls Effective silence level
Lt Threshold level
N Total number of discrete increments NR(FIELD) Noise reduction estimated in situ
q Normalized exchange rate
qr Normalized recovery exchange rate
Tc Criterion time
INTRODUCTION Context
There is a fine line between noise and music; a trip to the local karaoke bar can serve as a quick reminder. Although the definition of noise varies based on personal taste, from an acoustic perspective, music or noise, recreational or occupational, is just pressure fluctuations about the mean atmospheric pressure. From a health and safety perspective, both can be equally harmful.
Noise induced hearing loss (NIHL) is the result of overexposure to noise (or music) as a function of: sound pressure level and frequency distribution, duration and temporal spacing, as well as an individual’s own physiological susceptibility (Johnson et al. 2010). NIHL is permanent and irreversible, yet completely preventable (NIOSH 2001). It remains one of the most common health and safety diseases in the workplace and is an increasing concern in daily urban life and modern recreational activities, such as attending live music, bars & nightclubs (Santos et al. 2007) and even listening to personal music players (Portnuff & Fligor 2011).
Personal hearing protection devices (HPDs) are often the best defense against NIHL; however, their effectiveness is contingent upon two variables, the noise exposure level and the attenuation of the HPD. The noise exposure level varies based on environmental factors, while the attenuation of the HPD is in itself a function of HPD model, proper fit and the percentage of time it is worn. A proper HPD provides adequate protection by affording sufficient attenuation while avoiding overprotection. Overprotection hinders perception of speech and warning signals, which may lead the user to remove the HPD, in turn drastically reducing the effective attenuation of the HPD. Thus, in order to select a proper HPD, two important metrics are required, the attenuation of the HPD and individual exposure levels of the user (Voix & Laville 2005). Although methods for measuring the real-world attenuation of HPDs on individuals have been examined for over 40 years, their laboratory performance remains notoriously misrepresentative of actual field attenuation.
Background and Need
The popularity of personal media players (PMP) is hard to ignore, in recent years headphones have outsold loudspeakers in the consumer market (Levin Consulting, personal communication, 2011). The ability of these devices to cause permanent hearing damage has been well documented in literature, even leading to recently updated technical safety standards in the European Union, requiring devices to default to safe listening levels and warn the user if the level is estimated to exceed 85 dB(A) (EU, 2013). Although listening habits are highly inter-individual and hard to accurately objectively assess, research suggests that many individuals are at risk (Levey et al., 2011). The growing concern is that the combination of PMP use with loud recreational activities or occupations can amount to hazardous exposure levels.
The purpose of a noise dosimeter is to track and inform the user of their individual noise exposure, hopefully allowing corrective action to take place before incurring harmful consequences. Unfortunately, conventional ‘personal’ noise dosimeters do not easily interface with HPDs, PMPs, and communication devices (Portnuff et al., 2012), nor are they meant for 24-hour use. Not only is it quite difficult to keep track of noise exposure accumulated over a 24-hour period, there are few guidelines to follow. Current legislation is designed for 8-hour work-shifts and based on a 16-hour recovery period in a ‘relatively quiet’ environment (CSA 2006).
Recent research revisiting noise exposure and associated physiological effects, through the assessment of temporary-threshold-shifts (TTS), emphasizes that the current damage risk criteria used in noise dosimetry does not adequately represent the associated risk. In order to accurately assess the potential damage, the spectral and temporal characteristics of the noise exposure must be taken into account; yet current metrics fail to do this (Kostek et al. 2012; Strasser et al. 2008).
Objectives
of monitoring comprehensive 24-hour in-ear noise dosimetry, while interfacing with personal music players (PMPs) or communication devices. The specific objectives of this thesis are: • Designing and prototyping an open-source development platform (hardware & software)
capable of collecting noise dosimetry field data and testing dosimetry algorithms; • Adapting a noise dosimetry algorithm for 24-hour use, including auditory recovery; • Designing a Matlab toolbox to analyze field-data, calculate standard noise dosimetry and
test the proposed 24-hour dosimetry algorithm.
While the objectives are quite ambitious, the goal of the thesis regarding hardware development is to demonstrate the feasibility of developing such a device and carry out initial testing of the platform. The contributions described within this thesis consist of:
Technical Contributions
• An open-source hardware Auditory Research Platform (ARP); • An open-source toolbox for Matlab;
• Proposed dosimetry algorithm for 24-hour use; • Technical user manual for the ARP (CRITIAS 2015); • Poster entitled “Noise Dose” (see APPENDIX I, p. 78). Scientific Publications
• Paper entitled, “Implementing 24-hour in-ear dosimetry with recovery”, presented at 2013 International Congress on Acoustics and published in the proceedings (see APPENDIX II, p. 80);
• Abstract entitled, “Development of an individual dosimetric hearing protection device”, presented at 2012 Inter-Noise conference (see APPENDIX III, p. 79);
• Poster entitled “Smart Dosimetric Hearing Protection Device”, presented at 2011 National Hearing Conservation Association (NHCA) conference (see APPENDIX IV, p. 77).
Patent Applications
Outline
Chapter 1 begins with a literature review including measurement of individual HPD attenuation, measurement of individual noise exposure, traditional dosimetry techniques, a brief history of legislation and standards, hearing science perspective, revisiting recent temporary-threshold-shift studies and an overview of a psychoacoustic noise dosimeter model. Chapter 2 describes the methodology for the development of the hardware, algorithm and Matlab toolbox, including the in-ear electroacoustic platform, correction factors and signal processing algorithms, and details of the electronic hardware platform and Matlab toolbox. Chapter 3 describes the results of the thesis, the status of the hardware and a demonstration of the dosimetry algorithm using the Matlab toolbox. Finally, a conclusion is presented followed by recommendations for future work.
CHAPTER 1 LITERATURE REVIEW
Before exploring traditional dosimetry equipment (Section 1.3) this chapter begins by summarizing two underlying topics: measurement of HPD attenuation (Section 1.1) and measurement of individual noise exposure (Section 1.2). This is followed by an introduction to the noise exposure metrics and limits currently used in legislation and standards (Section 1.4), and a brief perspective from hearing science regarding the effects of noise exposure on the auditory system (Section 1.5). A series of experiments examining an auditory side-effect to noise exposure, the temporary-threshold-shift (Section 1.6) is highlighted, leading up to the summary of a recently published novel approach to noise dosimetry: the psychoacoustic noise dosimeter (Section 1.7). Finally, a short summary is presented, tying these topics back into the objectives of this thesis (Section 1.8).
1.1 Measurement of individual HPD attenuation
All HPDs sold in the U.S. are required to be labeled with a Noise Reduction Rating (NRR). This is a single-number estimation of the amount of attenuation that a particular HPD provides (Johnson et al. 2010). Unfortunately, this NRR value is notoriously misrepresentative of actual field attenuation. Attempts to identify this relationship began in the 70’s and comprehensive reviews are available (Berger et al. 1996; Gaudreau et al. 2008). Originally, measurement of HPD attenuation was performed on a group of subjects after being fit by a trained experimenter or “supervisor fit”. More recent standards include a “trained-subject fit” method, where a trained experimenter instructs the subjects on proper HPD insertion techniques, and even an “inexperienced-subject fit” (ANSI S12.6 2008), where no guided instructions are provided. Discrepancies between laboratory and field attenuation values remain and after over 40 years, it has been well established that the NRR ratings exceeds noise reduction that is experienced in the field (Voix & Laville 2005). The Occupational Health and Safety Administration (OSHA) has implemented the practice of derating the NRR measurement by 50% for all types of hearing protectors. The National
Institute for Occupational Safety and Health (NIOSH) recommends scaling the NRR with a predefined amount 25%, 50% or 70%, depending on the HPD type (Johnson et al. 2010). As Voix and Laville have said “Even if such methods better predict the average group field performance, it is still impossible to relate this population-based, statistically-derived, laboratory-driven attenuation estimate to real individual field attenuation” (Voix & Laville 2009). One solution to this fundamental problem, as proposed by Berger, is to perform ‘individual fit testing’. This requires measuring the real-world attenuation performance of HPDs on individual workers. Several methods to obtain these measurements exist and fall into two categories, psychophysical and objective (Casali et al. 1995).
The Real-Ear-at-Threshold (REAT) method, often referred to as the ‘gold standard’, is a psychophysical measurement involving the difference between the occluded (with HPD) and the unoccluded (without HPD) detection thresholds of a subject. The average REAT value, over a group of subjects, can then be used to generate an NRR. For labeled NRRs, the US Environmental Protection Agency (EPA) mandates a correction factory subtracting two standard deviations from the mean value, in order to estimate the minimum noise reduction theoretically achieved by 98% of the laboratory subjects (Berger et al. 1996; Casali et al. 1995). Although REAT takes into account all relevant sound paths to the inner ear, not only is it time-consuming and very sensitive to the ambient background noise, making it often impractical for field usage, but it is also hampered by two limitations: the first one is the well-known low-frequency masking error caused by physiological noise, which leads to an overestimation of the low-frequency attenuation, and the second one is the variability of determination of hearing threshold levels (Voix & Laville 2009).
The Microphone in Real Ear (MIRE) method is an objective measurement involving the placement of a measurement microphone directly in the ear canal of the subject and performing a measurement with and without the HPD. The difference between these two measurements is termed insertion loss (IL), expressed in dB, and can be used to predict an individual based REAT equivalent value (Casali et al. 1995). Originally, this measurement procedure was complex, required delicate laboratory equipment and fitting of the subject by a
professional. Recently, a modified MIRE method, dubbed field-MIRE (F-MIRE), using a probe tube and two microphones was developed by Voix and Laville (Voix 2006; Voix & Laville 2009). This method although originally developed for custom HPDs, has been refined and confirmed by Berger et al. (Berger 2005) for non-custom earplugs and even adapted for ear muffs (Nelisse et al. 2011). Considering the trade-offs between speed, accuracy, repeatability and practicality, F-MIRE appears to be the most effective means to conduct field HPD attenuation measurements.
This idea of ‘individual fit testing’ has spawned the recent commercialization of many fit verification tools: VeriPro by Sperian Protection, Sonopass by Sonomax, SafetyMeter by Phonak, Multi-Fit by NIOSH, HPD Well-Fit by NIOSH, QuickFit by NIOSH, INTEGRAFit by Workplace Integra, and EARFit by 3M (Voix 2010). Some of these tools use psychophysical methods and some the objective method to enable a one-time confirmation of HPD attenuation.
1.2 Measurement of individual noise exposure
The tracking of individual noise exposure is challenging as it requires the knowledge of the HPD attenuation and the monitoring of environmental sound pressure levels (SPLs), or the direct measurement of the effective (protected) levels, i.e. behind the HPD. Traditionally, dosimeters are used in tracking noise exposure; they are body-worn derivatives of integrating sound level meters and are usually worn on top of the shoulder (Berger 2003). Although they provide an effective measure of unprotected exposure levels, they cannot account for HPD use or proper fit. It is well understood that the performance of a HPD is directly affected by how well it is worn and what percentage of time it is worn for. As seen in Figure 1.1, removing a HPD for even a short amount of time, drastically reduces its effectiveness.
Figure 1.1 Effective 8-hour HPD attenuation vs. time HPD is not worn, during 8-hour shift, using 3 dB exchange rate. Where q is the normalized exchange rate, T is time HPD is not
worn, ATTnom is the nominal attenuation of the HPD and ATTeff is the 8-hour effective
attenuation. The highlighted point on the graph indicates an 8-hour effective attenuation of 12 dB after HPD removal of 30 minutes
The example HPD has a maximum attenuation of 30 dB, but when removed for just 30 minutes of an 8-hour work shift, its effective attenuation more than halves to just 12 dB (Voix & Laville 2005). Traditionally, questionnaires are used in assessing the percentage of time a HPD is worn, although recent research has shown that reported vs. measured results are victim to large subject reporting bias, especially in environments with unstable noise levels. In a study of HPD use among construction workers, Neitzel and Seixas found that workers who reported “always” using HPDs on a questionnaire, actually only wore them about 1/3 of the time [33% (±43)] when assessed via dosimetry, while being exposed above levels of 85 dB(A). Furthermore, combining the HPD attenuation levels with use time data dropped the effective HPD performance to less than 3 dB (Neitzel & Seixas 2005).
Noise exposure legislation is based on an 8-hour work shift, and 16-hour recovery period, usualy below 75 dB(A). For example if a worker’s off-duty quarters are noisy, this time is to be considered part of the work-shift (CSA Z107.56 2013). Currently, dosimeters are required
to be manually reset back to a 0% dose which brings into question whether a subject has recovered back to 0% dose upon returning to work, either from exposure acquired during their previous work shift, or from recreational activities.
Recently, results of an F-MIRE-based study that measured the effective attenuation (i.e. behind the HPD) obtained over entire industrial work shifts show that it was indeed again lower than the labeled NRR. Furthermore, they saw variations in individual effective protected levels as a function of time, substantial left and right ear differences and significant inter-subject variability for workers wearing the same type of HPDs. These research findings further bring into question the effectiveness of HPDs in real-world environments and confirm the advantages of new instrumentation practices (Nelisse et al. 2011).
1.3 Traditional dosimetry equipment
Modern dosimeters are battery powered, body-worn derivatives of integrating sound level meters storing equivalent A-weighted levels and computing and presenting exposure levels in several fashions. The dosimeter is configured with the chosen damage risk criteria (Criterion Level, Criterion Time, Exchange Rate) and is meant for a subject to quickly assess their 8-hour ‘noise dose’. As a convenient personal indicator this dose is often represented as a simple percentage, hiding the variables behind the calculation. For documentation purposes or comparisons Lex is used, which is the Leq adjusted for a specific time period, such as an 8-hour work shift (CSA Z107.56 2013). In the U.S., dosimeters are required to comply with the ANSI standards ANSI S1.43 and S1.25. The classification of these measurement systems falls into three categories, Type 0, 1 and 2, differing only in the tolerance limits allowed. As a rough guide, measurements with a Type 1 dosimeter will have errors not exceeding 1 dB, while Type 2 will not exceed 2 dB (American National Standards Institute Inc. 2007; American National Standards Institute Inc. 1991).
Dosimeters are traditionally worn on top of the shoulder, mid-way between shoulder and neck, with microphone pointing vertically upward. Although a study of the effects of
body-worn dosimeter microphone placement concluded that in a diffused field the overall dB(A) errors were minor, in a direct field there were significant variations affected by both the position and supporting structure of the microphone and the localization of noise source and its spectrum. One of the suggestions was the use of a binaural system (Byrne & Reeves 2008). Although, dosimeters can currently provide an effective measure of unprotected noise exposure levels (in non-impulse dominant environments) (Kardous et al. 2005), they are still relatively simple devices in individual noise exposure assessment, as they cannot account for HPD attenuation or proper fit, nor do they take into account recovery of the human auditory system.
Recently, an untraditional in-ear dosimetry system has been commercialized, the Exposure Smart ProtectorTM by a startup company doseBustersTM which has now been acquired by Sperian Protection. It consists of a miniature microphone with a generic ear-tip adapter and is meant to insert into compatible HPDs. When the subject is wearing an HPD, the level measured by the dosimeter is the protected level and when the subject removes the HPD, the microphone continues to measure the level of exposure (unprotected) as a conventional dosimeter would (Byrne & Reeves 2008). This is meant to give the actual exposure of the subject, taking into account the performance of the protector as well as proper fit. Unfortunately, this system appears to have two main limitations. Firstly it does not provide any real-time data, which would allow the user to take corrective action before being over-exposed. Secondly, it does not provide insight as to why a particular subject is over his dose, e.g. was it an improperly fitted HPD, did they remove the HPD, or did the user simply spend too much time in an area that was too loud for the given device.
1.4 Legislation and standards history
One of the earliest references (more recently translated and re-published) to occupational NIHL dates back to 1713, describing noise-induced hearing loss and tinnitus (Ramazzini et al. 1964). In the 1800’s there were documentations of blacksmiths with hearing loss. By 1933, Temkin reported that after 15 years of work in metal industry, none of the men could
hear a whisper 4m away. In 1944, McCoy published a study containing actual audiograms of shipyard workers. Subjects showed flat audiograms before starting employment, and extremely elevated threshold levels, 50 dB and more (with the highest notch at 4 kHz), after 7-hours of work. By 1950, Karl Kryter published an extensive report entitled “The Effects of Noise on Man”, where he recommended a maximum safe level of 85 dB, for any frequency or narrow band of noise (Kryter 1950).
At this time overall SPLs were expressed in decibels (dB). Although it was understood quite early on that the frequency characteristics of noise should also be considered and octave band data was desirable, due to instrumentation limitations, this was simply not manageable. Throughout the 50’s and 60’s various organizations discussed this issue, but it was not until the Intersociety Committee in 1967 that the proposal of A-weighted sound levels became common practice. A-weighting filters low frequency content to better approximate the sensitivity of the human auditory system and remains in general use in hearing damage risk criteria to this day (Johnson et al. 2010).
In 1949 the first noise exposure regulation was issued, when the U.S. Airforce specified limits for noise exposure and required the provision of HPDs and audiometric testing for personnel exposed to high noise levels. The U.S. Air Force was also the first to introduce the equal energy principle in its regulation on Hazardous Noise Exposure in 1956 as part of the Armed Forces/National Research Council Committee on Hearing and Bioacoustics (CHABA). The equal energy principle states that the permissible amount of time in loud environments is halved for every 3 dB increase in level. This exchange rate is intended to quickly allow for calculation of how much time one can safely spend in a given environment and stayed in debate for many years following the CHABA regulation. The 5 dB exchange rate attempts to account for the interruptions in noise exposure, presuming that some recovery occurs during these interruptions and was originally argued to be simpler to use in the field. In 1982 many leading investigators reviewed the available literature regarding the use of the equal energy rule and endorsed the 3 dB exchange rate as the most practical and reasonable method, this served as the basis for the international standard, ISO 1999:1990.
Today, the 3 dB exchange rate is used by NIOSH, the American Conference of Governmental Industrial Hygienists (ACGIH), is adopted by most Canadian provinces and the Canadian federal government (CSA Z107.56 2013), yet some legislation still uses the controversial 5 dB exchange rate.
In 1974, the U.S. Environmental Protection Agency (EPA) published a document entitled "levels" in which it was clearly stated:
Decisions about how much noise is too much noise for whom, for how long, and under what conditions demand consideration of economic, political and technological matters far beyond the intent of the Levels Document (EPA 1974).
The EPA established an 8-hour level of 75 dB(A) to protect "public health and welfare with an adequate margin of safety”. Much of this result was based on the work of Johnson, with the use of 4 kHz as the most sensitive indicator of hearing loss. Even though it was acknowledged that activities outside of the workplace, such as mowing the lawn or recreational activities such as listening to records could contribute to ones daily exposure the recommended exposure limit (REL) is designed for an 8-hour workday, five days per week over a 40‐year working lifetime, while the other 16-hours in the day as well as weekends are assumed to be quiet.
Figure 1.2 A 24-hour noise-exposure estimate graph from the “Condensed Version of EPA Levels Document”
Taken from EPA (1974, p.16)
Traditionally, noise exposure measurements are to be performed using a sound level meter at the ‘center of head’ location with the subject absent, although this is not universally agreed upon and the ‘hearing zone’, a hypothetical sphere of 30-cm radius enclosing the head, is also commonly used. It is expected that the measurement location used be noted.
Although the Occupational Safety and Health Administration (OSHA) and the National Institute for Occupational Safety and Health (NIOSH) were both put into place when President Nixon and Congress signed the Occupational Safety and Health Act of 1970, the
two entities have greatly different roles. The OSHA is part of the U.S. Department of Labor and is responsible for developing and enforcing workplace safety and health regulations. It carries behind it the force of law and employers in the industrial sector are bound to comply with it. NIOSH conducts research and provides information, education, training, and recommendations regarding occupational safety and health, but is not in a position to regulate or enforce them. As such, the guidelines set forth by OSHA and NIOSH differ and are in constant debate. OSHA has a REL, which is the Criterion Level for the Criterion Time, of 90 dB(A) for 8-hours with an exchange rate of 5 dB, while NIOSH has a REL of 85 dB(A) for 8-hours with a 3 dB exchange rate. These values are based on each organization’s perspective on ‘excess risk’. In 1998, NIOSH presented its revised thoughts on occupational hearing loss where the excess risk of developing occupational NIHL for a 40-year lifetime exposure at the 85 dB(A) REL was 8%, while at 90 dB(A), the permissible exposure limit currently enforced by OSHA and the Mine Safety and Health Administration (MSHA) carried a 25% excess risk (Niquette 2009).
In Canada, provincial and federal legislation set limits. Most Canadian provinces use a criterion level of 85 dB(A) with a 3 dB exchange rate (as the NIOSH recommendation) with a few exceptions, the Canadian federal noise regulation uses 87 dB(A) with a 3 dB exchange rate, while Quebec uses 90 dB(A) with an exchange rate of 5 dB, the same as OSHA (CCOSH 2015).
The effects of noise on the human auditory system have been observed dating back as far as the 1700’s. Previous instrumentation and data collection limitations, combined with high individual susceptibility, and the progressive emergence of NIHL, posed challenges in establishing direct cause and effect relationships. However, even with scientific data highly supporting that overexposure to noise leads to hearing loss, the many political aspects involved in the development of noise regulations remain.
1.5 Hearing science perspective
The study of noise induced hearing loss (NIHL) is challenging not only due to the difficulty in tracking of HPD attenuation and individual noise exposure but also because of the extreme complexity of the human auditory system. Individual susceptibility is highly variable and driven by various intrinsic biological factors of which the governing mechanisms are not entirely understood. It is beyond the scope of this thesis to describe what is known about these processes in great detail and as such the discussion that follows is designed to acquaint the reader with the basics, while detailed information can be found in Feuerstein & Chasin 2009; Kryter 1950; Dancer et al. 1992; Johnson et al. 2010. Although several methods for evaluating auditory health are in use today, pure tone audiometry remains the primary tool for NIHL assessment.
Unfortunately audiometry generally documents NIHL after damage has already occurred, at best allowing for prevention of further damage rather than prevention of damage which may not even be present on the audiogram yet. The three types of hearing changes that may occur following excessive noise exposure are noise-induced temporary threshold shift (NITTS), noise-induced permanent threshold shift (NIPTS) and acoustic trauma. NIHL is generally insidious in nature, occurring gradually and painlessly over time, making it difficult to notice before it is too late. Although, cases of acoustic trauma involving extremely intense noise, such as an explosion, can result in immediate permanent cochlear damage, rupturing of the eardrum and/or fracture of the ossicular chain.
As the name indicates, NITTS is the temporary reduction in hearing ability and is evident by elevated audiometric hearing thresholds. Studies have shown that the damage from broadband signals such as industrial noise and music, typically occurs in the octave band above the noise. Given the external ear’s natural resonance in the range of 2-3 kHz, this is consistent with the classic audiometric “noise-induced notch” at 4 kHz, often exhibited by patients with NIHL. The amount and duration of NITTS is a function of the duration and intensity of the noise exposure. The symptoms can be relatively brief, or may extend up to
several hours or days and range from a slight reduction in hearing sensitivity to as much as 40 dB. During this time there are a variety of underlying physiologic changes. The outer hair cells (OHC) of the cochlea are the first affected, they may swell and rotate, become distorted or fused, resulting in the their inability to maintain proper cell function and possible permanent loss.
Noise-induced permanent threshold shift (NIPTS) occurs when there is less than a full recovery from NITTS. This may be a fairly common occurrence, with small amounts of permanent damage taking place following each of many NITTS experiences (Feuerstein & Chasin 2009).
The effects of these very small changes may be imperceptible relative to the subjective improvement during NITTS recovery, yet this damage appears to be cumulative. Progressive damage may lead to degeneration of auditory nerve fibers and to changes within the central auditory system.
The cumulative effects of noise exposure have been revisited in recent years. Gates et al. found that audiometric hearing thresholds of older men (ages 58 to 80), who were exposed to noise earlier in their lives, increased more than men without history of previous noise exposure (Gates et al. 2000). This finding was subsequently confirmed in a population study of 70-year-olds and most recently extensively examined in controlled laboratory studies on mice. Kujawa and Liberman suggest that noise-induced damage to the ear has progressive consequences that are considerably more widespread than revealed by conventional threshold testing and that noise exposure is more dangerous than previously assumed (Kujawa & Liberman 2009).
Estimates for the risk of developing NIHL are statistically computed from population studies and are referred to as damage risk criteria. They serve as the basis for recommending noise exposure limits based on noise levels and duration of exposure, versus the percentage of people expected to develop significant hearing loss as a result of those exposures. The
definition of significant hearing loss comes into question. For instance, the environmental protection agency (EPA) considers any hearing threshold shift of more than 5 dB at 4,000 Hz to significantly impact general quality-of-life. On the other hand, occupational regulations are typically aimed at preventing the development of ‘material hearing impairment’. This occupational definition varies but is typically considered hearing loss greater than 25 dB averaged across the frequencies of 500 through 2,000 or 3,000 Hz, and sometimes only meeting this criteria if present in both ears (Niquette 2009; Johnson et al. 2010).
Further investigation of the effects of noise exposure on the human auditory system remains necessary, as understanding the underlying mechanisms is important in the further prevention of NIHL and updating standards and legislations to current best practices. Although, keeping in mind that “the setting of specific limits on exposure to noise is a political decision, with results that vary between jurisdiction depending on economic and sociological factors” (EPA 1974).
1.6 Revisiting temporary-threshold-shift studies
A set of recent studies confirmed that the magnitude of temporary threshold shift (TTS) depends on the frequency distribution and impulse content of the otherwise nearly energetically equivalent noise exposure. It was also shown that recovery from TTS in an environment of 70 dB(A) occurred slower than in silence. The results can be seen in Figure 1.3, where the first test series ‘TS I’ represents exposure to white noise 94 dB(A) Leq for 1 hour and recovery in quiet, ‘TS II’ additionally includes 900 impulses of 5 ms duration at 113 dB(A), and ‘TS III’ is the same as ‘TS I’ followed by 3 hours of white noise at 70 dB(A). In each case there was a significant change in the recovery times, but in traditional Lex calculations the impulses and 70 dB(A) do not significantly contribute to the noise exposure. Since the impulse content has a very short duration (5 ms), it has a negligible Leq contribution when ‘averaged’ over the 4 hours of the study. Similarly, the exposure to 94 dB(A) Leq for 1 hour remains dominant when the additional 3 hour 70 dB(A) Leq exposure is added (Irle et al. 1998).
Figure 1.3 TTS recovery times for three different types of noise exposure. ‘TS I’ is the recovery pattern for exposure to white noise 94 dB(A) for 1 hour ~125min. ‘TS II’ including
900 impulses at 113 dB(A), and ‘TS III’ white noise at 94 dB(A) for 1 hour followed by 70 dB(A) for 3 hours
Taken with permission from Irle et al. (1998, p.460)
The results of the study also confirmed large inter-subject variations. It was observed that (TTS2) values (TTS measured 2 min. post-noise exposure, at 4 kHz) ranged from 15-28 dB with a recovery time of 40-165 min (given the exposure to white noise stimulus of 94 dB(A) Leq for 1 hour). Even larger variations were seen with the introduction of impulse noise (TTS2 = 16-36 dB, recovery 55-240 min.) (Irle et al., 1998).
A similar study with exposure to various types of music, varying in frequency distribution and transient dynamics: Classical, Chinese and House music revealed different magnitudes of TTS, as seen in Figure 1.4 below.
Figure 1.4 Recovery times from exposure to various genres of music. European classical music, Chinese Music, and modern House music. Significantly longer recovery times were
observed after exposure to House music
Taken with permission from Strasser et al. (2008, p.413)
The authors reasoned that the ‘consistently high levels’ and lack of ‘breaks’ in the House music could be a reason for the prolonged recovery times as well as the significantly more amount of energy in the low frequency bands (Strasser et al. 2008).
The results of these TTS studies support that the frequency distribution and impulse content of the noise exposure should be considered in assessing the damage risk. The study also confirmed the importance of ensuring proper background noise levels (< 70 dB(A)) for recovery from noise exposure (Irle et al. 1998).
1.7 Psychoacoustic noise dosimeter model
A recent series of papers describe the development of a ‘psychoacoustic noise dosimeter’ (PND) model. The model takes into account the excitation of the basilar membrane occurring in the inner ear, has provisions for impulse noise using time constants for the acoustic reflex, and includes the metabolic and structural components of asymptotic threshold shift (ATS) to predict TTS as well as recovery time given a particular noise exposure (Kostek et al., 2012;
Kotus et al., 2008). The growth and decay variable for the model was selected using exponential regression on data collected from small groups (~30 subjects). The results of the model versus measured data, including standard deviation, can be seen in Figure 1.5.
Figure 1.5 Psychoacoustic noise dosimeter model prediction vs. measured TTS after exposure to 94 dB(A) of white noise for an hour
Taken with permission from Kostek et al. (2012, p.6)
The model is intended for real-time use and showed promising results in initial field studies at several dance clubs. While the model fits the average values considerably well, the inter-individual variability remains quite large.
The model predictions for 85 dB(A) for 8-hours of various noise (Pink, Brown, White) produces different degrees of TTS, as shown in Figure 1.6.
Figure 1.6 The TTS estimations of the PND model for 85 dB(A) 8-hour exposure to : White Noise + Impulses, White Noise, Pink Noise and Brown Noise
Taken with permission from Kostek et al. (2012, p.7)
This coincides with the other recent TTS studies examining the frequency distribution of noise and inclusion of impulse noises (Irle 2008).
1.8 Summary
The single-number Noise Reduction Rating (NRR) label on HPDs is notoriously misrepresentative of actual field performance. The tracking of individual noise exposure is challenging as it requires the knowledge of the HPD attenuation and the monitoring of environmental sound pressure levels (SPLs), or the direct measurement of the effective (protected) levels, i.e. behind the HPD. Traditional dosimetry equipment cannot account for proper fit or use of HPDs. Current legislations do not address 24-hour metrics, they are designed around an 8-hour workday, five days per week over a 40‐year working lifetime, while the other 16-hours in the day, as well as weekends are assumed to be quiet.
Recent studies examining the cumulative effects of noise exposure suggest that noise-induced damage to the ear has progressive consequences that are considerably more widespread than revealed by conventional threshold testing (Kujawa & Liberman 2009). Studies measuring TTS post exposure to various signals reveal sensitivity to frequency distribution of the noise, impulse content and background noise level during recovery (Irle et al. 1998). A psychoacoustic noise dosimeter model taking into account frequency distribution and impulse noise showed promising results at predicting TTS post exposure in several night clubs (Kostek et al. 2012). The author presumes one of the reasons such a promising algorithm has received poor adoption is due to the lack of tools to prototype and test it in the field.
This thesis contributes to the existing literature by addressing the following research questions:
• Is it feasible to design a device capable of monitoring comprehensive 24-hour in-ear noise dosimetry, while interfacing with personal music players (PMPs) or communication devices?
• Is it feasible to design an open framework of hardware and software to collect comprehensive field data and prototype noise dose algorithms?
CHAPTER 2 METHODOLOGY
The proposed approach relies on the tracking of individual noise exposure by combining the measurement of the effective protected levels (i.e. behind the HPD) with the measurement of the unprotected exposure levels and HPD attenuation. A digital HPD was designed for this purpose. The system consists of two main components, the earpiece instrumentation hardware and the accompanying signal processing electronics, currently contained within a belt-pack. This chapter details the methods, algorithms and tools used in the development of this system. Starting at the human interface, the in-ear electroacoustics platform (Section 2.1) consists of the ear tip and transducers embedded inside. The transducers require the measurement and application of correction factors (Section 2.2) this is followed by a description of the signal processing algorithms for continuous in-line verification of HPD attenuation (Section 2.3) and noise dose with recovery calculations (Section 2.4). The electronic hardware platform is detailed (Section 2.5) along with the development and manufacturing process (Section 2.6) and programming and debugging (Section 2.7). Finally, the Matlab toolbox is described along with the integration with mobile tools and recorded audio file analysis (Section 2.8).
2.1 In-ear electroacoustic platform
This section describes the interface with the human ear, the ear tip (Section 2.1.1) and the electroacoustic components integrated into the earpiece (Section 2.1.2).
2.1.1 Ear tip
The ear tip’s purpose is to provide maximum attenuation with a comfortable acoustic seal in the ear canal. Several types of commercially available solutions exist, two different options were selected, a custom-fit silicone and a universal fit foam.
The custom-fit silicone HPD is developed by Sonomax Technologies Inc. (Montreal, Canada). The unique feature of the SonoFitTM platform is a mass-deployable instant (5 minute) custom fit, capable of high attenuation. It is generally regarded as comfortable and very similar earpieces have been successfully used in brain plasticity research, which required them to be worn continuously for eight days (Schönwiesner et al. 2009). Unfortunately, it can suffer from fit verification problems just as traditional custom HPDs, where an impression of the ear canal is taken by an audiologist and sent to a lab for molding and assembly of the final earpiece. These traditional customs do not guarantee a perfect fit, as Brian Fligor recently concluded while verifying their performance (Fligor 2012).
Closed-cell foam provides universal fit, good comfort and is also capable of high attenuation levels but performance is greatly contingent on proper use. Berger refers to this as the ‘inadequate roll-down’ (Berger 2011). Although it is possible for an individual to reuse them several times, they are generally regarded as single-use.
2.1.2 Electroacoustic transducers
The purpose of the electroacoustics is to measure acoustic levels just outside the HPD on the faceplate of the device and in the user’s ear canal, as well as provide a speaker as in a traditional earphone for PMP playback or communication. Thus, each earpiece is to have a pair of microphones and a speaker. The goal was to place the faceplate of the device as close to the entrance of the ear canal as possible, in an effort to avoid disturbing the acoustical effects of the pinna, centering an omnidirectional microphone flush with the faceplate. The inner-microphone was placed as close as possible to the ear tip’s sound bore, facing the eardrum, to minimize the necessary tubing length.
The electroacoustic components were selected based on best performance available in the size and form-factor necessary to embed in such small earpieces. A matrix of the dimensions and acoustic specifications of all commercially available transducers was constructed. With
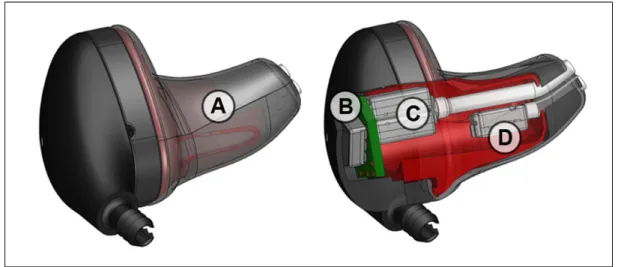
the help of a Mechanical Engineering intern, several configurations were mocked up, the final of which is shown in Figure 2.1. The universal fit option is a similar variation of this design, featuring a sound-bore nozzle that the foam ear tip is press-fit over.
Figure 2.1 CAD prototype of ARP earpieces: A. Sonomax (Montreal, Canada) SonoFitTM earpiece. B. The outer-ear microphone (OEM) Sonion (Roskilde, Denmark) 66AF31 C. Dual
balanced-armature speaker Knowles TWFK series. D. The inner-ear-microphone (IEM) Knowles (Itasca, Illinois) GA38 series
The final transducer selection consisted of miniature electret condenser microphones: Knowles GA38 for the inner-ear-microphone (IEM) and Sonion 66AF31 for the outer-ear-microphone (OEM), as well as the Knowles TWFK series balanced armature receiver. Several such prototype earpieces were hand-assembled by the author.
While much work has gone into the selection, sourcing and integration of appropriate electronics for this platform, the practical implications of such a portable system had to be taken into account. It is understood that with further technological advancements the earpieces could benefit from miniature microphones with higher dynamic range and as Sonomax refines its product lines, the earpieces themselves can also be updated.
2.2 Correction factors and signal processing algorithms
Traditional noise exposure assessment and dosimetry use free field sound pressure levels. In order for noise exposure calculations using the proposed earpiece to be compliant with existing data and legislations, correction factors are applied to estimate an equivalent free-field level.
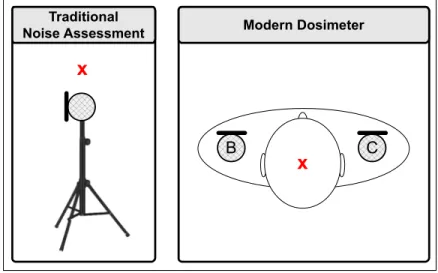
Figure 2.2 Measurement locations for traditional noise exposure assessment and modern dosimetry. A. Sound level meter at the location of center of head with subject absent. B and
C, left and right shoulder worn dosimeter
Figure 2.3 illustrates the pressure variables at different locations in the open and occluded ear (the ‘prime’ symbol is used in the latter case) and will be used as a reference throughout the next few sections.
B C
x A
x
Traditional
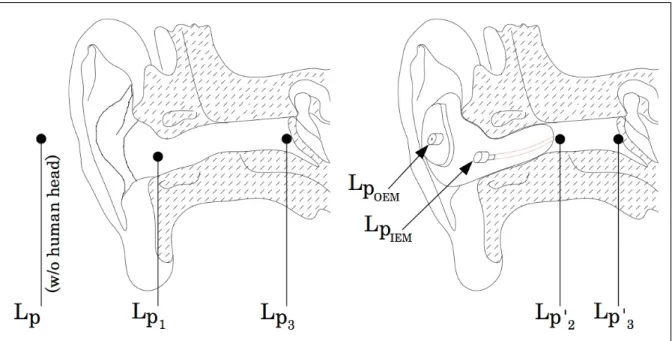
Figure 2.3 Pressure variables at different locations in the open (left) and occluded ear (right). Lp is at the center of head without subject present, Lp1 is at the entrance of the open ear canal. Lp3 is at the tympanic membrane. LpOEM is the outer-ear microphone (OEM), located
on the outer faceplate of the prototype HPD, LpIEM is the inner-ear microphone (IEM) embedded inside the prototype HPD. Lp’2 is at the tip of the mic probe tube opening and Lp’3
is at the tympanic membrane, both in the occluded condition
2.2.1 Correction for the occluded ear canal
Two correction factors are applied to the occluded ear canal IEM measurements (LpIEM) to obtain a free-field equivalent level (Lp):
1. Transfer Function of the Outer Ear (TFOE);
2. Occluded Ear Canal Resonance & Probe Tube Effect (OER).
The TFOE represents the amplification caused by the resonance in the open ear canal, which is individual and varies with the geometry of the human head, torso, pinna, and length of ear canal. ISO 11904-1 states the approximated correction factors in one-third octave bands. This Transfer Function (TF) can be measured on a human subject or approximated by measurement on a head and torso simulator (HATS) and is represented by:
TFOE = Lp3− Lp (2.1)
where Lp3 is the open tympanic SPL and Lp is the free-field sound pressure level at the ‘center of head’ location without the subject or HATS present. The OER is dependent on the length of the probe tube and the length of the residual part of the ear canal between hearing protector and eardrum. This is dependent on HPD model and on the user’s morphology and is represented by:
OER = LpIEM− Lp3' (2.2)
where LpIEM is the SPL measured inside the occluded ear canal using the IEM and Lp’3 is the
occluded-ear tympanic SPL. Incorporating the two correction factors above, the equation relating the SPL measurement in the occluded ear canal (LpIEM) to the predicted free-field equivalent is:
LpFF,IEM = LpIEM −TFOE−OER (2.3)
this computed LpFF,IEM value is A-weighted (LpA) and used in calculating the estimated
free-field equivalent level at discrete time increments:
LAeq(IEM ),T =10log 1 T ti10 LpAi/10 i=1 N
(2.4)where i is the ithincrement, N is the total number of increments, ti is the duration of the ith
increment (ex. 1 second), LpAi is the A-weighted sound level for the ith increment and T is the
2.2.2 Correction factor measurement
The correction factors involved vary according to the geometry and dimensions of the human body. In order to avoid some of these cumbersome and delicate measurements, the Bruel & Kjaer Type 4128C – Head and Torso Simulator (B&K HATS) was used as an approximation. Although this increases the uncertainty associated with the prediction, it is much more practical for field use. The validity of these measurements is discussed below.
Two measurements of the aforementioned correction factors were performed, first the transfer function of the outer ear (TFOE) and second the occluded ear canal resonance and probe tube effect (OER). The TFOE correction factor is the transfer function (TF) between the B&K HATS microphone and B&K Reference microphone. The TFOE data in Figure 2.4 is adapted from a study at the Danish Technical Institute (Snaidero et al. 2011). The OER correction is the TF between B&K HATS microphone and IEM of HPD, while fitted on the HATS.
Figure 2.4 Correction factors applied to the measurements using the in-ear microphone (IEM) of the prototype HPD earpiece. The transfer function of outer ear (TFOE), solid red curve, representing the amplification caused by the resonance in the open ear canal is adapted
from (Snaidero et al. 2011), a free-field measurement of B&K HATS Type 4128C. The Occluded Ear canal Resonance (OER) is the TF between B&K HATS microphone and IEM
The head and torso diffraction (HTD) is the transfer function between the OEM of HPD (LpOEM) while fitted on the HATS and the free-field reference microphone at the ‘center of head’ position without the HATS present (Lp). The use of the HTD correction factor should be determined based on the particular application. In diffuse field conditions dB(A) errors beteen LpOEM and Lp are expected to be minor. In the direct field the HTD will dependent on the supporting structure, sound source location and spectrum of the noise (Byrne & Reeves 2008).
The measurement of the OER reveals a peak, presumably caused by a resonance between the tip of the mic probe tube opening Lp’2 and the eardrum Lp’3. Similarly, the most distinct minimum (anti-resonance) is most likely due to a resonance between the MIRE microphone LpIEM and the tip of the mic probe tube opening Lp’2 . These resonances are a function of the length of the probe tube, and the length of the residual part of the ear canal between HPD and eardrum. Hence, they are dependent on user morphology and HPD model. Both the resonance and anti-resonance results are in agreement with Bockstael et al’s results, who compared the HATS to 19 human test subjects using a different custom HPD. This implies that the OER measured (Figure 2.4) is a good approximation of human ears having average dimensional parameters (Bockstael et al. 2010).
2.3 Continuous in-line verification of HPD attenuation
The location of the reference microphone measuring the unprotected exposure level is on the outside of the user’s HPD near the entrance of the ear canal (LpOEM). The presence of the subject in the acoustic field can be accounted for with the Head and Torso Diffraction and Pinna Effect (HTD):
HTD= LpOEM− LpFF,OEM (2.5)
LpFF,OEM = LpOEM− HTD (2.6)
where LpFF,OEM is the corrected free field level measured just outside the HPD (LpOEM). Using
both free field corrected levels an NR(FIELD) is determined at the initial fitting of the HPD by
the user. This value is a prediction of noise reduction (NR), based on a well-fitted HPD that is later used as an anchor to validate proper fit:
NR(FIELD)= LpFF,OEM− LpFF,IEM (2.7)
This NR(FIELD) value, along with the unprotected level (LpFF,OEM) is used to calculate the
predicted free-field equivalent exposure level:
LpFF= LpFF,OEM− NR(FIELD) (2.8)
This LpFF value is then A-weighted and used to calculate the predicted equivalent exposure
levels over time:
LAeq( NR),T=10log 1 T ti10 LpAi/10 i=1 N
(2.9)when the HPD is not inserted properly this predicted LAeq(NR), based on the NR(Field) value, will
largely deviate from LAeq(IEM), the estimated free-field equivalent level based on actual
measured in-ear levels, this is used to track proper fit over time and further study the relationship between predicted and actual measured levels. When the difference between these two values rises above 10 dB (experimentally selected) an ‘improper fit’ warning can be triggered, notifying the user:
2.4 Real-time dose calculation including cumulative and recovery effects
For the user’s convenience dose is calculated as a percentage. Using the traditional dose calculation (Berger 2003): D=100 Tc ti10 LAeqi−Lc /q i=1 N
(2.11)where Tc is the criterion time, Lc is the criterion level, LAeqi is the A-weighted equivalent level
for the ith interval, N is the total number of intervals, and ti is the duration of the ithinterval,
and q is the normalized exchange rate (i.e. q=Exchange Rate/log2). Exposure at the criterion level (Lc) for the duration of criterion time (Tc) will yield a 100% noise dose.
The proposed dose including auditory recovery calculation is performed in parallel:
(2.12)
where Lt is the threshold above which dose is to be accumulated, typically around 75 dB SPL,
Ls is the effective silence level, defined as the highest sound pressure level at which the ear
can still recover at its fastest rate Kr (in %/h.). qr is the recovery exchange rate. The recovery
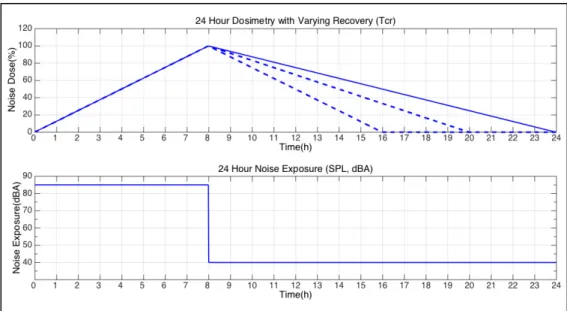
criterion time (Tcr) is defined as the amount of time (in hours) it takes to recover from a
100% exposure. Several options for this parameter are illustrated in Figure 2.5 below. Current legislation assumes the 16-hours outside of work are in relative quiet (solid blue line on graph). D=100 Tc ti10 LAeqi−Lc q , if L Aeqi ≥ Lt i=1 N
D=100 Tcr −ti* Kr*10 Ls−LAeqi qr , if L t > LAeqi > Ls i=1 N
D=100 Tcr i=1−ti* Kr, if Ls≥ LAeqi N
Figure 2.5 Effect on the noise dose of adjusting the recovery criterion time Tcr to 16, 12 and 8 hours after exposure to 85 dB(A) for 8 hours
(100% noise dose using the NIOSH dose criteria) followed by exposure to 40 dB(A) for 16 hours
In equation 2.12 above three cases are defined, when LAeqi (the A-weighted equivalent level
for theithinterval) is above threshold Lt, dose is accumulated in the traditional fashion. When
LAeqi is below Lt threshold but above the effective silence threshold (Ls), recovery takes place
at a rate inversely proportional to the energy ratio of exposure level LAeqi and the effective
silence level Ls affected by a recovery exchange rate, qr. When LAeqi is below the effective
silence level Ls, threshold, the maximum recovery rate Kr has been reached and linear
recovery takes place as a function of the time spent in silence. This proposed dosimetry algorithm is an alternative to the traditional one that assumes a complete recovery has taken place on the beginning of the next exposed work shift and forces resetting the dose back to 0%, without accounting for the effective off-work exposure. A case-study demonstrating the algorithm is presented in the results chapter (Section 3.2.2).