Effects of PFM rehabilitation on PFM function and morphology in older women
Stéphanie J. Madill,
Stéphanie Pontbriand-Drolet, An Tang,
Chantale Dumoulin
First published: 28 January 2013
Heinz Koelbl led the peer-review process as the Associate Editor responsible for the paper. Conflict of interest: none.
Abstract Aims
The purpose of this study was to examine the effect of a pelvic floor muscle (PFM) rehabilitation program on incontinence symptoms, PFM function, and morphology in older women with SUI.
Methods
Women 60 years old and older with at least weekly episodes of SUI were recruited. Participants were evaluated before and after a 12-week group PFM rehabilitation intervention. The evaluations included 3-day bladder diaries, symptom, and quality of life questionnaires, PFM function testing with dynamometry (force) and electromyography (activation) during seven tasks: rest, PFM maximum voluntary contraction (MVC), straining, rapid-repeated PFM contractions, a 60 sec sustained PFM contraction, a single cough and three repeated coughs, and sagittal MRI recorded at rest, during PFM MVCs and during straining to assess PFM morphology.
Results
Seventeen women (68.9 ± 5.5 years) participated. Following the intervention the frequency of urine leakage decreased and disease-specific quality of life improved significantly. PFM function improved significantly: the participants were able to perform more rapid-repeated PFM contractions; they activated their PFMs sooner when coughing and they were better able to maintain a PFM contraction between repeated coughs. Pelvic organ support improved significantly: the anorectal angle was decreased and the urethrovescial junction was higher at rest, during contraction and while straining.
Conclusions
This study indicated that improvements in urine leakage were produced along with improvements in PFM co-ordination (demonstrated by the increased number of rapid PFM contractions and the earlier PFM activation when coughing), motor-control, pelvic organ support.
INTRODUCTION
Stress urinary incontinence (SUI) is often regarded as an inevitable part of the aging process because its prevalence increases with age.[1] The prevalence of SUI in community-dwelling women 65 years and over is high: 25–40% of women experience some type of urinary incontinence and about half of that number experience SUI.[2] Pelvic floor muscle (PFM) rehabilitation has been shown to be effective in reducing SUI in young, middle-aged, and elderly women.[3-6] However, the underlying mechanism by which PFM rehabilitation reduces urine leakage is not fully understood.
One proposed biological rationale for the effectiveness of PFM rehabilitation for SUI is that a strong PFM contraction will clamp the urethra, increasing urethral pressure, and preventing urine leakage upon effort or exertion.[7] Another proposed mechanism is that rehabilitation leads to improved bladder neck support through increased PFM strength and tone, thereby limiting the bladder neck's downward movement during effort and exertion.[8] A third proposed mechanism is that rehabilitation improves PFM co-ordination in
preparation for increases in intra-abdominal pressure.[9] Thus, examining the effect of a PFM rehabilitation program on these three aspects of PFM function during different tasks: rest, PFM contraction, straining, and coughing, is important to better understand the role of the PFMs in urinary continence.
To the authors' knowledge, only one study has evaluated the effects of PFM exercise on multiple aspects of PFM function, and this was in middle-aged women with pelvic organ prolapse.[10] Most previous research has only examined the effect of PFM exercise on a single aspect of PFM function; therefore, this study was undertaken to investigate its effects on all three aspects of PFM function in older women with SUI; force/activation and co-ordination were measured with PFM dynamometry and electromyography (EMG), and PFM and pelvic organ support were measured with magnetic resonance imaging (MRI). The primary objective of this study was to determine the effects of a PFM rehabilitation program on PFM force, activation, and morphology at rest, during maximum voluntary PFM contractions (MVC), straining and functional activities such as coughing. We hypothesized that the program would result in improvements in PFM force and EMG activation, and in PFM and pelvic organ support during all of the tasks and that these improvements would occur with decreased SUI symptoms.
MATERIALS AND METHODS
This study employed an observational pre-test, post-test design. Participants were evaluated before and after a 12-week group PFM rehabilitation intervention. This study was exploratory; its purpose was to broadly evaluate the effects of the PFM rehabilitation program on PFM function and morphology. Therefore, no outcome measures were designated as either primary or secondary.
Participants
Women 60 years of age and older were recruited using newspaper advertisements and from participating incontinence clinics. Participants were included if they experienced at least weekly episodes of urinary incontinence over the previous 3 months and presented predominantly with SUI symptoms (≥80%) per history and the Three Incontinence Questions (3IQ).[11] To be eligible, volunteers also had to be community dwelling. Women taking hormone replacement therapy were admissible as long as their prescriptions had been stable for at least 6 months. Women were excluded if they were unable to understand either French or English, had chronic constipation (per the Rome III criteria),[12] pelvic organ prolapse ≥POP-Q II,[13] were taking medications known to affect continence, had mobility, medical, or psychological problems that would prevent them from completing the assessments or the exercise program,[14, 15] and/or had a condition or implant that contraindicated magnetic resonance imaging (MRI).
The study received ethical approval from the Comité d'éthique de la recherche de l'institut universitaire de gériatrie de Montréal, the Comité mixte d'éthique de la recherche—regroupement neuroimagerie/Québec and from the ethics committees at each of the participating hospitals. Each volunteer provided written consent prior to the initial assessment.
Intervention Protocol
The study included a 12-week PFM rehabilitation program with assessments at baseline and immediately following the intervention. At the initial assessment demographic, medical and gynecological history, and general health status (SF-12) data were collected. The participants were also individually instructed to perform PFM contractions correctly by an experienced PFM physiotherapist using vaginal palpation. The intervention involved 12 weekly, 1-hr group PFM exercise classes, lead by an experienced pelvic floor physiotherapist. Each group consisted of a maximum of eight participants. Participants were required to complete at least 10 classes to have been considered as having completed the intervention. The PFM exercise program included maximum voluntary PFM contractions (MVCs), rapid-repeated PFM contractions, flicks: maximum PFM contractions with superimposed rapid contractions, podium exercises: controlled PFM contractions to approximately 50%, 100%, 50% of her maximum PFM contraction and then relaxed and the Knack: PFM pre-contraction prior to coughing.[9] Exercises were performed in supine, four-point kneeling, sitting, and standing. The number of contractions, their intensity, and the time for which they were held were increased every 4 weeks to progressively challenge the PFMs. During the
exercise classes the participants also performed breathing exercises, gentle stretching exercises for the shoulders, trunk, hips and feet, core strengthening exercises, and balance exercises between PFM exercise sets. See Appendix.
The participants performed home PFM exercises for 15–20 min, 5 days a week, following a written program. They recorded the exercises they performed in a diary included in the PFM exercise booklet. The exercise program comprised four types of PFM exercise: PFM MVCs, rapid PFM contractions, the Knack and podium exercises. During the first 4 weeks the home exercises were performed in supine; in weeks five to eight the exercises were performed in sitting and during the last 4 weeks they were performed in standing. The number of contractions and the length of time for which they were held were also progressed every 4 weeks, from six second holds and sets of six repetitions in the first month, to eight second holds and eight repetitions in the second month, and 10 second holds and 10 repetitions in the last month of the program. Adherence to the home exercise program was monitored with a diary. The exercise program was developed based on the recommendations of the International Consultation on Incontinence.[16]
Outcome Measures
Continence
The severity and impact of the volunteers' incontinence symptoms were evaluated with a 3-day bladder diary, the Urogenital Distress Inventory (UDI) and the Incontinence Impact Questionnaire (IIQ).[17, 18] The bladder diary included questions about the number of leakage episodes, the activity engaged in at the time the leakage occurred, the number of voids, and the number of pads used. The UDI and IIQ assessed the presence of various urogenital symptoms and their effect on quality of life. They were scored as described by Shumaker et al.,[18] with lower scores indicating less bother and improved quality of life, and they have been found to be valid and reliable measures of incontinence related quality of life in women.[19-21]
PFM function: PFM palpation, dynamometry and EMG
A preliminary assessment of PFM function was performed by an experienced pelvic floor physiotherapist using palpation (SJM).[22] Then, PFM function was assessed in crook-lying simultaneously with dynamometry and electromyography (EMG) using the Montreal dynamometer[23] to which pairs of Medtronic 9013L4811 Ag-AgCl EMG electrodes were attached on each side to the condoms covering the arms of the dynamometer. The electrodes were attached so that they would be adjacent to the paravaginal PFMs when the dynamometer was inserted. The dynamometer is a custom manufactured vaginal speculum instrumented with strain gauges that record the force generated by the PFMs, in Newtons, relative to time.[24, 25] This allows for the calculation of the timing of the force onset and peak, the mean force for a given time, the slope of the force rise and fall, and the area under the force curve.
Once the dynamometer was inserted to 5 cm past the introitus, force, and EMG data were recorded during a single trial of each of seven tasks: resting with the dynamometer closed and opened to each volunteer's maximum tolerance without pain, PFM maximum voluntary contraction (MVC), straining, rapid-repeated PFM contractions, a sustained PFM contraction, a single cough, and three repeated coughs.[26] For all of the tasks after the resting conditions the dynamometer was opened to 10 mm. Verbal instructions and encouragement were given throughout each task. Two-minute rests were given between the tasks to avoid fatigue. If breath holding or compensatory muscle contractions were visible during any of the voluntary PFM contraction tasks, the trial was stopped and repeated to avoid contaminating the dynamometric or EMG data.
Dynamometric and EMG data were sampled at 1,028 Hz and were recorded simultaneously with a PC MCIA acquisition card to a personal computer. The EMG data were amplified with a JMS 484-083 four-channel amplifier (gain 1,000, band pass filter 20–450 Hz). Both the dynamometric and the EMG data were processed using a custom LabView (National Instruments, Austin, Texas) program. Dynamometric data were processed according to the procedures described by Dumoulin et al.[24] and Morin et al.[25] The root mean square (201 sample sliding window) was used to smooth the EMG data. The filtered peak EMG value was determined to be the maximum amplitude and the onset was determined to be the time at which the
filtered EMG rose and stayed above 2 SD over baseline.[27] Timing for force and EMG measures were kept as separate measures in all analyses due to the electromechanical delay.
Resting force
The resting force of the pelvic floor was recorded for 10 sec both with the dynamometer closed and with it opened as far as the participant could tolerate it, without pain. The mean force was compared before and after the intervention.
PFM MVC
The PFM MVC was recorded for 10 sec, with the instruction to squeeze the PFMs as hard as possible. The peak force and EMG amplitudes, as well as the timing of the peak EMG relative to the peak force, were compared before and after the intervention.
Straining
The straining task required the volunteer to blow, while pushing as though passing stool, into plastic tube connected to a manometer for 10 sec. The effort was standardized at 50 cmH2O pressure at the mouth. No instructions were given regarding the PFMs so that their spontaneous activity would be recorded. Peak force and EMG amplitudes were compared before and after the intervention. The timing of the force and EMG onsets relative to the onset of pressure at the mouth, and the timing of the EMG onset relative to the force onset were also compared before and after the intervention.
Rapid-repeated PFM contractions
To assess co-ordination, the volunteers performed as many rapid-repeated PFM contractions as possible in 15 sec. The number of contractions, peak force and EMG amplitudes, change in force, and EMG amplitudes from the first to the last contraction, and the ascending slope of the force of the first contraction were compared before and after the intervention.
Sustained PFM contraction
To assess endurance, the volunteers were instructed to contract their PFMs as hard as possible and to hold the contraction for 90 sec. They were instructed to re-contract their PFMs if they felt that they had lost the contraction. The peak force and EMG amplitudes, the mean force, the area under the force curve, and the change in the EMG amplitude from the 10th to the 60th sec of the contraction were compared before and after the intervention.
Single cough
The volunteers were instructed to perform a single maximum effort cough. The peak force and EMG amplitudes, the ascending and descending slopes of the force, and the timing of the force relative to the EMG for both the peak, and the onset were compared before and after the intervention.
Triple cough
The volunteers were instructed to perform a series of three maximum coughs approximately 1 sec apart. The overall peak force and EMG amplitudes, the peak force and EMG amplitudes for each cough, the mean force and EMG amplitudes of the troughs between the coughs, the ascending slope of the force of the first cough, and the timing of the EMG onset relative to the force onset were compared before and after the intervention.
Pelvic floor morphology
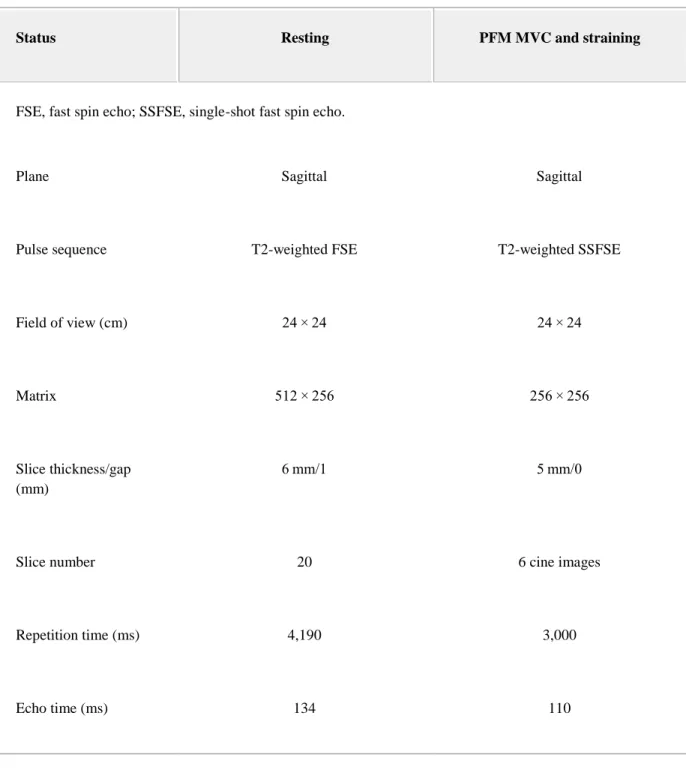
After the dynamometric assessment, pelvic floor morphology was evaluated in supine with MRI recorded using a Siemens 3.0 T Magnetom Trio with an IPAT torso/pelvis coil centered at the symphysis pubis. The resting images were acquired using T2-weighted fast spin echo sequences. See Table I for the MRI acquisition parameters. During the PFM MVC and straining, six acquisitions were made in the midsagittal plane with T2-weighted single-shot fast spin echo sequences to provide a cine view. The PFM MVC instructions were: “Contract your muscles as hard as you can, as if you were holding back urine or gas.” The instructions for straining were: “Blow into the tube and push as if you were passing stool,” effort was controlled by having the volunteer blow into a standardized (Guillarme's) tube.
Table I. MRI Acquisition Parameters
Status Resting PFM MVC and straining
1. FSE, fast spin echo; SSFSE, single-shot fast spin echo.
Plane Sagittal Sagittal
Pulse sequence T2-weighted FSE T2-weighted SSFSE
Field of view (cm) 24 × 24 24 × 24
Matrix 512 × 256 256 × 256
Slice thickness/gap (mm)
6 mm/1 5 mm/0
Slice number 20 6 cine images
Repetition time (ms) 4,190 3,000
Status Resting PFM MVC and straining
Bandwidth (Hz/pixel) 130 320
Number of excitations 1 1
Scan duration (s) 146 18
Measurements were made from the MRIs by evaluators blinded to the testing session. Measures of PFM function and pelvic organ support were made from the mid-sagittal MRI images taken at rest, during a PFM MVC and during straining. For the images recorded during the PFM MVC and straining, the images with the greatest bladder neck elevation and depression, respectively, were selected. The pubococcygeal line from the inferior symphysis pubis to the sacrococcygeal joint was used as the reference line[28] (See Fig. 1). The measures of PFM morphology were: the H-line, the M-line, the levator plate angle and the anorectal angle.[29-31] The urethrovesical junction height and the uterocervical junction height were measured to assess pelvic organ support.[32, 33] Intrarater and interrater reliability for the MRI measurements were assessed and determined to be acceptable, with intraclass correlation coefficients ≥0.8 and standard errors of the mean ≤2 mm or 2° for all measures.[28]
Figure 1.
MRI measures in the midsagittal plane. 1: Pubococcygeal line, 2: Anorectal angle, 3: H-line, 4: M-line, 5: Levator plate angle, 6: Urethrovesical junction height, and 7: Uterocervical junction height.
Sample Size and Statistical Analysis
Statistical analyses were performed with Minitab v15 (State College, PA). A priori power calculations (α = 0.05, ß = 0.80) based on our previous research were performed to determine the sample size: 14 participants were needed to detect a change in peak EMG amplitude of 2 µV and 17 participants were required to find changes of 2.4 N in peak force and 5 mm in urethrovesical junction height. To allow for dropouts, sample size was set at 20.
Given that the data were normally distributed, repeated measures analyses of variance (ANOVAs) were used to compare the outcome measures between the testing sessions. Separate ANOVAs were used for each independent data set: continence symptoms and impact, MVC force and EMG amplitudes, cough force and
EMG amplitudes, timing, endurance, and pelvic floor morphology. The time of testing, task (rest, contraction, cough, or strain), and the measure (force, EMG, MRI measurement) and all interactions were considered in the model. When differences were significant, posthoc testing was performed using the Bonferroni method to control for multiple comparisons. Data are given as mean ± standard deviation, except some demographic data which are presented as median (range).
RESULTS Sample
Seventeen women participated in this study: age 68.9 ± 5.5 years, 1 (0–4) pregnancies, 1 (0–4) total deliveries, 1 (0–4) vaginal deliveries, and BMI 26.31 ± 4.04 m2/kg. Twenty-seven women were recruited; however, nine dropped out due to family health or personal reasons and one was excluded because her vagina was too small to accommodate the dynamometer. This woman was nulliparous and had never been married. There were no significant differences between the women who participated and those who withdrew for any of the demographic characteristics examined. None of the participants reported any adverse effects from the PFM exercise program; only one who withdrew did so because of the exercises, which she reported were “too hard.”
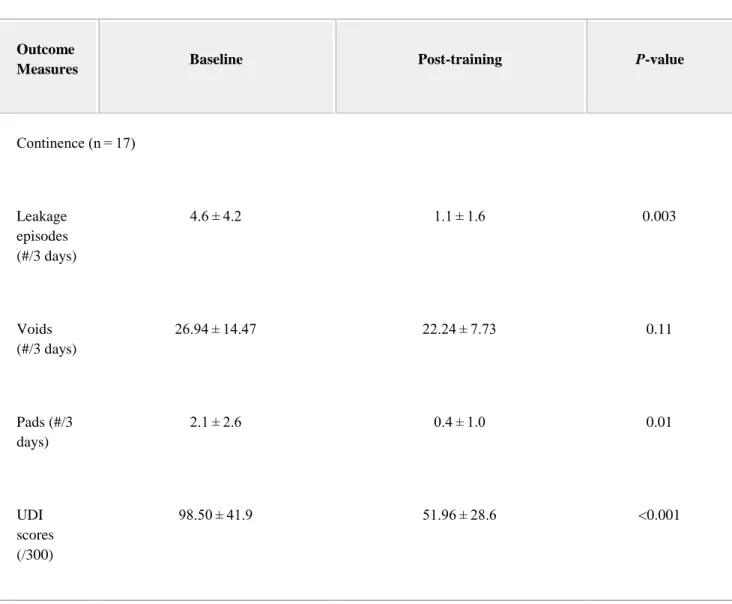
The results for the changes in continence symptoms and impact, PFM function and morphology are summarized in Table II.
Table II. Outcome Measures
Outcome
Measures Baseline Post-training P-value
Continence (n = 17) Leakage episodes (#/3 days) 4.6 ± 4.2 1.1 ± 1.6 0.003 Voids (#/3 days) 26.94 ± 14.47 22.24 ± 7.73 0.11 Pads (#/3 days) 2.1 ± 2.6 0.4 ± 1.0 0.01 UDI scores (/300) 98.50 ± 41.9 51.96 ± 28.6 <0.001
Outcome
Measures Baseline Post-training P-value
IIQ scores (/400) 39.72 ± 40.2 10.28 ± 16.8 0.002 PFM function n = 17 PFM palpation (/5) 2.7 ± 0.7 3.9 ± 0.5 <0.001 n = 16 Resting force open (N) 3.18 ± 2.39 2.40 ± 1.48 0.047 PFM MVC (n = 16) Max force (N) 4.12 ± 3.48 3.09 ± 3.36 0.92 Max EMG (µV) 23.09 ± 12.04 46.02 ± 79.50 0.92
Outcome
Measures Baseline Post-training P-value
Peak timing: EMG re F (sec) −1.96 ± 2.71 −1.15 ± 3.21 0.55 Straining (n = 12) Max force (N) 2.52 ± 2.08 2.18 ± 1.93 0.71 Max EMG (µV) 12.97 ± 9.24 13.37 ± 7.51 0.71 Onset timing: F re P (sec) −0.31 ± 0.84 −1.20 ± 1.24 1.00 Onset timing: EMG re P (sec) −0.62 ± 1.60 −1.07 ± 1.04 1.00 Onset timing: EMG re F (sec) −0.21 ± 0.41 0.10 ± 0.42 0.054 Rapid-repeated PFM contractions (n = 15)
Outcome
Measures Baseline Post-training P-value
Number (#) 5.6 ± 2.4 8.2 ± 2.7 0.01 Max force (N) 4.47 ± 4.24 2.94 ± 3.45 1.00 Force first–last (N) 1.17 ± 2.51 0.48 ± 1.27 1.00 Max EMG (µV) 28.27 ± 16.75 31.65 ± 20.03 0.81 EMG first–last (µV) 6.59 ± 7.68 2.46 ± 4.13 0.31 Slope force rise (N/sec) 8.21 ± 8.74 5.42 ± 4.93 0.72 Sustained PFM contraction (n = 14) Max force (N) 5.42 ± 4.72 4.06 ± 4.05 0.71
Outcome
Measures Baseline Post-training P-value
Mean force (N) 4.08 ± 3.68 2.38 ± 3.33 0.71 Area under the F curve (N sec) 220.60 ± 203.0 134.70 ± 170.50 0.21 Max EMG (µV) 30.35 ± 16.19 28.38 ± 14.37 0.82 EMG 10– 60 sec (µV) −0.12 ± 5.47 −0.27 ± 3.27 0.93 Single cough (n = 12) Max force (N) 4.40 ± 3.27 4.32 ± 4.07 1.00 Max EMG (µV) 33.91 ± 22.51 35.34 ± 13.16 1.00 Onset timing: EMG re F (sec) −0.045 ± 0.24 −0.209 ± 0.259 0.054
Outcome
Measures Baseline Post-training P-value
Peak timing: EMG re F (sec) −0.14 ± 0.42 −0.10 ± 0.19 1.00 Slope force rise (N/sec) 11.90 ± 10.66 5.80 ± 6.72 0.023 Triple cough (n = 12) Max force (N) 4.59 ± 3.59 4.26 ± 4.22 0.72 Max EMG (µV) 34.72 ± 23.15 26.88 ± 13.60 0.16 Mean trough force (N) 0.87 ± 1.46 1.52 ± 1.70 0.003 Mean trough EMG (µV) 4.46 ± 3.34 8.34 ± 4.67 0.001 Onset timing: EMG re F 0.089 ± 0.294 0.620 ± 1.083 0.054
Outcome
Measures Baseline Post-training P-value
(sec) Slope force Rise (N/sec) 6.77 ± 5.80 5.91 ± 5.20 0.47 Morphology (n = 17) Pubococcygeal line (mm) Rest 111.40 ± 7.04 112.40 ± 7.39 0.98 MVC 111.21 ± 6.39 112.31 ± 7.51 Straining 111.09 ± 6.94 112.39 ± 7.43 H-line (mm) Rest 57.34 ± 7.53 56.77 ± 7.73 0.16 MVC 48.04 ± 5.83 46.91 ± 8.01 Straining 55.42 ± 10.66 54.54 ± 11.33
Outcome
Measures Baseline Post-training P-value
M-line (mm)
Rest 19.88 ± 7.73 19.34 ± 6.63 0.15
MVC 9.18 ± 6.89 6.13 ± 5.21
Straining 23.07 ± 13.36 20.81 ± 11.15
Levator plate angle (°)
Rest 20.25 ± 6.60 20.08 ± 6.38 0.12 MVC 10.75 ± 7.59 7.44 ± 5.82 Straining 26.10 ± 13.63 22.45 ± 9.60 Anorectal angle (°) Rest 119.71 ± 14.28 111.30 ± 12.41 <0.001 MVC 101.31 ± 13.80 87.43 ± 6.06
Outcome
Measures Baseline Post-training P-value
Straining 116.41 ± 21.02 103.08 ± 14.19
Urethrovesical junction height (mm)
Rest 12.22 ± 6.41 13.45 ± 5.53 0.042
MVC 18.48 ± 7.92 20.42 ± 7.30
Straining 6.54 ± 9.07 9.64 ± 5.53
Uterocervical junction height (mm)
Rest 19.92 ± 9.96 20.69 ± 7.38 0.35
MVC 25.78 ± 9.44 27.54 ± 17.21
Straining 11.24 ± 12.81 13.79 ± 9.44
Continence: Incontinence symptoms improved for all of the participants following the intervention. The number of leakage episodes decreased from 4.6 ± 4.2 to 1.1 ± 1.6 (P = 0.003) in 3 days, with 10 of the participants reporting no leakage episodes after treatment. There was no change in the number of voids recorded on the diary. The number of pads used decreased from 2.1 ± 2.6 to 0.4 ± 1.0 (P = 0.01) in 3 days. The UDI scores decreased significantly, from 98.50 ± 41.9 to 51.96 ± 28.6/300 (P < 0.001). The IIQ scores also decreased significantly, from 39.72 ± 40.2 to 10.28 ± 16.8/400 (P = 0.002). The IIQ included two quality of life questions: “How much of a problem is your incontinence?” and “Please rate the effect of your incontinence on your quality of life?” They were scored separately using 10-cm visual analogue scales and both improved following treatment: from 4.4 ± 2.1 to 2.5 ± 2.5 cm (P = 0.01) and from 4.3 ± 2.3 to 1.6 ± 1.9 cm (P < 0.001), respectively.
All of the participants were able to correctly perform a PFM contraction after being taught by the physiotherapist. On palpation, their PFM strength on the modified Oxford scale increased from 3 (1–4) to 4 (3–5)/5 following the intervention, P < 0.001.
Dynamometry and EMG
The mean resting force was measured with the dynamometer closed and with it opened as far as tolerated (n = 16). In the repeated measures ANOVA the interaction between the whether the dynamometer was open or closed and the testing time (before or after the intervention) was not significant, but the main effect for testing time was (P = 0.047): the resting force decreased, both when the dynamometer was closed and when it was open, following the intervention. As a lower resting force level could have affected the measures of peak force, all analyses of peak force were done both with the absolute force and with the increase in force over baseline. There were no differences between the two measures of peak force in any of the analyses and all results presented are for the analyses using the peak increase in force over baseline.
PFM MVC (n = 16)
There were no differences produced by the intervention in either the peak force or the peak EMG generated during the MVC (time × modality interaction P = 0.17, main effect for time P = 0.92). The time of the peak EMG relative to the peak force was also not different between the testing times (P = 0.55)
Straining (n = 12)
There were no differences in the maximum force or EMG generated during straining as a result of the intervention (time × modality interaction P = 0.92, main effect for time P = 0.71). Nor were there any differences in the timing of the peak force and EMG relative to the peak pressure following the treatment (time × modality P = 0.50, main effect for time P = 0.66). The onset of EMG activity relative to the onset of the force rise was later following the intervention: pre-EMG onset 0.21 ± 0.41 sec before force onset versus post-EMG onset 0.10 ± 0.42 sec after force onset, P = 0.054 (see Fig. 2).
Figure 2.
Onset timing of EMG activity relative to force onset. Dashed line at 0 indicates the force onset time. Positive numbers indicate that the EMG activity onset was after the force onset, while negative numbers indicate that the EMG became active first. *Significantly different at P < 0.05.
Rapid-Repeated PFM Contractions (n = 15)
The volunteers were able to perform more rapid-repeated PFM contractions in 15 sec after the intervention than they could before: 8.2 ± 2.7 versus 5.6 ± 2.4, P = 0.01. The peak force and EMG amplitudes did not change (P = 1.00 and P = 0.81, respectively); nor did the maximum force and EMG amplitudes of the first contraction compared to the maximum force and EMG amplitudes of the last contraction change following the intervention (time × modality P = 0.19, main effect for time P = 0.10). The slope of the force generation did not change either, P = 0.72.
There were no changes in the peak force (P = 0.71), mean force (P = 0.19), the area under the force curve (P = 0.21), or either the peak EMG amplitude (P = 0.71) or the difference in the EMG amplitude between the 10th and the 60th sec of the contraction (P = 0.93) following the therapy intervention.
Single Cough (n = 12)
There were no differences produced by the intervention in either the peak force or EMG, or in the timing of the peak force relative to the peak EMG generated during the single cough (amplitudes: time × modality interaction P = 0.11, main effect for time P = 0.93, timing: time × modality interaction P = 0.97, main effect for time P = 0.55). There were differences in the relative timing of the EMG onset compared to the force onset, with the EMG becoming active sooner following the intervention: pre-EMG onset 0.045 ± 0.24 sec before force onset versus post-EMG onset 0.209 ± 0.259 sec before force onset, P = 0.054. There were also differences in the slope of the force rise, with a lower slope being generated following treatment: 11.90 ± 10.66 N/sec versus 5.80 ± 6.72 N/sec, P = 0.043 (see Fig. 2).
Triple Cough (n = 12)
The peak amplitudes were not significantly different among the three coughs or between the testing times (interaction P = 0.81, main effects: P = 0.16 coughs and P = 0.095 time). There were significant differences in the amplitudes of the troughs between the coughs following the intervention (time × modality interaction, P = 0.003). The amplitude of the both the EMG and the force troughs were not different between the first and second trough (P = 0.52). Both the first and second troughs had higher amplitudes following the intervention than they did beforehand, P < 0.001 for both force and EMG (see Fig. 3). As well, the EMG onset, relative to the force onset, was earlier following treatment: pre EMG onset 0.089 ± 0.294 sec before force onset versus post-EMG onset 0.620 ± 1.083 sec before force onset,P = 0.054 (see Fig. 2).
Figure 3.
Amplitudes of troughs between three coughs. *Significantly different at P < 0.05. MRI (n = 17)
In the sagittal plane, the time by task interaction was not significant for any of the measures; however, the main effect for task was significant for each measure (P < 0.001 for each) indicating that the participants were performing the PFM contraction and straining tasks correctly in the MR scanner. The main effect for time was significant for the anorectal angle, P < 0.001, and the urethrovesical junction height, P = 0.042, indicating that, for all three conditions, the anorectal angle was narrower (mean: pre 111.69 ± 17.88°, post 100.61 ± 15.01°) and the urethrovesical junction height was higher (mean: pre 12.40 ± 9.16 mm, post 14.50 ± 7.54 mm) following treatment.
DISCUSSION
This study is the first to examine both the effects of a PFM rehabilitation program on incontinence symptoms and their impact, and its effects on the function and morphology of the pelvic floor in older
women with SUI. The group intervention was effective: the volunteers' leakage improved significantly, and these effects were related to improvements in PFM co-ordination, motor control, pelvic organ support, and possibly PFM strength. It was, however, a small, uncontrolled study and it should be replicated to confirm these results and to determine the associations among them.
The rehabilitation program was designed to train PFM strength, co-ordination, contraction speed, and endurance. The breadth of the exercises makes it impossible to state that any one exercise or type of exercise produced the observed changes. However, the literature suggests that SUI results from multiple deficits that combine to produce the symptom of urine leakage under conditions of increased intra-abdominal pressure.[34-36] Therefore, the rehabilitation program was designed, based on the principles of specificity of exercise training, to address the various PFM function deficits previously identified in women with SUI.
This rehabilitation program was well tolerated by most of the participants. However, one woman did withdraw from the intervention because she found it too difficult. This woman also reported a lower level of activity during her daily activities than did the other participants, even though she met the inclusion criterion of being independently ambulatory in the community without an assistive device. Therefore, it might be advisable to screen for a higher level of daily activity in future research.
Continence
The intervention decreased the frequency with which the participants leaked urine, how bothered they were by the leakage, and the effect of the leakage on their quality of life. The participants in this study experienced, on average, a 75% decrease in the frequency of their leakage episodes with 10 of the volunteers reporting that they were completely dry at the end of treatment, which is clinically meaningful.[37] IIQ scores have been classified to correspond to quality of life, with scores under 40 indicating a good quality of life.[20] On initial testing, the mean IIQ score for these participants was 39.7; however, 11 of the individual scores were above 40, indicating that, while as a group SUI had limited impact on their quality of life, on the individual level many of the volunteers were more affected; by the post-treatment testing all of the individual IIQ scores were below 40 (mean 10.3), which suggests that they experienced a meaningful improvement in their quality of life. Barber et al.[38] established that a decrease of 11 points on the UDI and of 16 points on the IIQ were reasonable estimates of the minimum important differences in adult women with SUI. The mean decrease in UDI (46.5 points) and IIQ (29.4 points) found in this study were greater than Barber's minimum important differences and, therefore, it can be assumed that the decreases in symptoms and their respective bother were meaningful to the participants. The only symptom measure that did not change was the number of voids, which was as expected because the participants' average voiding frequency (approximately eight voids per day) was within accepted range for normal. Overall, with the majority of the participants experienced no leakage following the intervention and with both statistically significant and clinically meaningful improvements in quality of life and bother, it indicates that this program was effective in alleviating the symptoms of SUI in this group of older women.
Dynamometry and EMG
The resting force recorded with the dynamometer was lower following the intervention, both with the dynamometer closed and with it opened as far as tolerated. This suggests two possible explanations. The first is that PFM tone decreased. This, however, is unlikely as the urethrovesical junction was higher on MRI under all three conditions following the intervention. The more likely explanation is that the women either were more aware of their PFMs or were less anxious about the dynamometer following the intervention and that they were consequently better able to relax them during the testing. As this improved relaxation could have affected the strength measurements these analyses were performed with the increase in force over baseline and not the absolute force.
The participants' PFM strength increased on palpation by one full Oxford grade; however, this was not reflected in the peak PFM force or EMG recorded during the dynamometry. There are several possible explanations for this. One is that palpation with a finger is more comfortable and that, during the
dynamometry, the women did not contract to their maximum capacity because of the discomfort of the dynamometer being pushed against the urethra and the pubic bone. This is supported by the participants' improved ability to narrow the anorectal angle with a PFM contraction following the intervention, which would have also increased the compression of the urethra against the pubic bone. Indeed, six of the women reported that the dynamometer was more uncomfortable during the post-intervention evaluation. A second possibility is that palpation, dynamometry and EMG assess different aspects of PFM function, with palpation reflecting PFM function more globally. The increase in the Oxford grade may reflect improvements in PFM contraction efficiency and lift along with contractility, changes that would not be registered by either dynamometry or EMG.[39] Another possible explanation is that the duration of the intervention was insufficient to see increases in peak PFM force or EMG activation. Sherburn et al.[40] found that it took 5 months of PFM training to see changes in PFM function in 83 older women (71.8 ± 5.3 years) with SUI, even though decreases in leakage were observed earlier. It is also possible that maintaining PFM strength is a sufficient goal; although this study did not include a control group, other studies with control groups have reported that the control group lost PFM strength during the study period.[41, 42] As well, as some more recent research has suggested that PFM weakness and or lower PFM EMG activation are not the primary problem in SUI,[34-36] the improvements seen in PFM co-ordination, motor control, and support may be more clinically relevant.
PFM co-ordination did improve, as demonstrated by the improved ability to perform rapid-repeated PFM contractions, the higher force and EMG amplitudes of the troughs between the triple coughs, the delayed EMG onset time during straining, and the earlier PFM EMG onset time during the single and triple coughs. During the rapid-repeated PFM contractions, the number of contractions increased while there were no changes in the peak force and EMG amplitudes, or in the slope of the force change. This demonstrates that the volunteers were more able to quickly shift between PFM contraction and relaxation and indicates that they had better control of the contraction. Improved PFM motor control was also demonstrated by the increased mean force and EMG amplitudes of the troughs between the triple coughs. This demonstrated that the volunteers had improved their ability to sustain the PFM contraction between repeated coughs. During both the single and the triple coughs the EMG onset was earlier, relative to the force onset, following the intervention. As the skill of voluntarily pre-contracting the PFMs prior to coughing (the Knack) was specifically taught and practiced in the intervention, this demonstrates motor learning. Further evidence of motor learning is demonstrated by the difference in the EMG onset timing between straining and coughing which indicated that the women were able to use different motor activation patterns depending on the task. Previous research has shown that women with SUI demonstrate delayed PFM activation patterns compared to continent women,[27, 36, 43] and the findings of the current study suggest that PFM exercise training can change the PFM activation patterns employed by women with SUI at the same time as the exercise program decreases their incontinence symptoms.
During the 90-sec sustained contraction, there were no changes in the force, the total area under the force curve or the EMG amplitudes following the intervention. This may be due to specificity of training; while the women did train for PFM endurance, they did not hold PFM contractions during the intervention for as long as they did during the evaluation sessions. It may also be another indication of improved motor control in that the participants were able to hold the contraction with smaller fluctuations in force.
MRI
The images suggest that PFM and pelvic organ support improved following the intervention as the anorectal angle narrowed and the height of the urethrovescial angle increased. Both of these are likely due to improvements PFM function: anorectal angle directly from the looping of the puborectal portion of the PFMs behind the anorectal junction, and bladder neck height indirectly through improved PFM support to the anterior vaginal wall. Although not significant, the M-line and the levator plate angle during the PFM MVC were both smaller following the intervention suggesting that along with improved pelvic support overall, the PFMs were able to provide better lift, which is consistent with the increase in Oxford grade found in this study. The improvements in the ability to narrow the anorectal angle and the trend towards better PFM lift following the interventions provide indirect evidence for improved PFM strength. These findings are also consistent with previous work that has found that PFM exercise improves pelvic organ support and the ability of the PFMs to produce lift with a contraction.[10, 44]
The primary limitations of this study are that it did not include a control group and so it is not possible to assign causality to the intervention and that there was a small number of subjects, limiting the power of the study. In particular, some of the dynamometric measurements were not included in the analysis because the dynamometer was not inserted to the correct depth, which, combined with the high variability of the dynamometric data, may have resulted in insufficient power to find real differences. As the dynamometer was inserted to the correct depth for at least part of the session in all but one participant, and as the insertion depth was more likely to be incorrect towards the end of the session, this error is most likely due to the participants shifting their pelves to be more comfortable. Another limitation is the speed at which images are acquired using MRI limited the tasks that could be investigated to those that could be held for several seconds. However, MRI was preferred, over faster image capture modalities such as ultrasound, for this initial investigation because it provides a wider field of view, which was considered a strength as we were not able to determine a priori the measurements that would be the most sensitive to change. This study also chose not to include an objective measure of leakage (e.g., a pad test) in order to decrease the burden of participating in the study and because the citizens' juries organized by Herbison et al.[45] found that bladder diary and quality of life measures were the most important symptom measures to women with incontinence.
CONCLUSIONS
This study demonstrated that group PFM rehabilitation classes are effective in reducing SUI symptoms and improving quality of life in community dwelling, older women. It is the first study to suggest that these changes symptoms and their impact are associated with improvements in PFM co-ordination, motor-control, PFM and pelvic organ support, and possibly PFM strength.
ACKNOWLEDGMENTS
The authors would like to thank Martine Bernard, Jacques Corcos, Marie-Claude Lemieux, Lisa Merovitz, Cara Tannenbaum, and Jens-Erik Walter for their assistance with recruiting participants. We would also like to thank Janic Bergeron, Claudia Botelho, Nancy Boudreau, Marjolaine Caya, Sima Chiva-Razavi, André Cyr, Valérie Elliott, Carollyn Hurst, Muriel Jadin, Sophie Lapointe, Alexandre Prud'homme-Delage, and Rébécka Ouellette for their assistance with screening, data collection, teaching the rehabilitation program and with data entry and processing. This study could not have been completed without the financial support of the Canadian Institutes of Health Research and les Fonds de recherche en santé du Québec.
PFM Rehabilitation Program PFM exercises performed:
Maximum PFM contractions: Participants were instructed to maximally contract and hold their PFMs. They were encouraged to count the seconds out loud to prevent breath holding.
Flicks: Participants were instructed to maximally contract their PFMs and then to perform four rapid PFM contractions (flicks), superimposed on the initial contraction. They were instructed not to relax their PFMs between the rapid contractions.
“Knack”: Participants were instructed to contract their PFMs and to hold the contraction while they coughed forcefully.
Podium: Participants were instructed to contract their PFMs moderately (to approximately half of their maximum contraction), to increase the contraction to their maximum, to relax back to the moderate contraction and, finally, to relax completely. They held each level of the contraction for the same length of time. These exercises are called podium exercises because, when drawn on paper, they resemble a medal podium at
a sporting event, with the higher gold medal platform between the lower silver and bronze medal platforms.
Rapid repeated PFM contractions: Participants were instructed to maximally contract and then relax their PFMs repeatedly, taking about 1 sec to contract and 1 sec to relax. Hollowing: Participants were instructed to contract their PFMs and the transversus
abdominus together. Other movements were added to progress the exercise.
Weeks 1–4
Weeks 5–8
Weeks 9–12
Standing
Maximum PFM contractions
8 reps, 6 sec hold 10 reps, 8 sec hold
12 reps, 10 sec hold
Flicks 4 reps, 6 sec hold 4 reps, 8 sec hold
4 reps, 10 sec hold
“Knack” 3 reps 3 reps 3 reps
Sitting
Maximum PFM contractions
8 reps, 6 sec hold 10 reps, 8 sec hold
12 reps, 10 sec hold
Flicks 4 reps, 6 sec hold 4 reps, 8 sec hold
4 reps, 10 sec hold
Podium 3 reps, 6 sec holds 3 reps, 8 sec holds
Four-point kneeling
Maximum PFM contractions
8 reps, 6 sec hold 10 reps, 8 sec hold
12 reps, 10 sec hold
Flicks 4 reps, 6 sec hold 4 reps, 8 sec hold
4 reps, 10 sec hold
Hollowing 10 reps, 5 sec hold 10 reps, 5 sec hold + arm
lift
10 reps, 5 sec hold + leg lift
Crook lying
Maximum PFM contractions
8 reps, 6 sec hold 10 reps, 8 sec hold
12 reps, 10 sec hold
Hollowing 10 reps, 5 sec hold + hip extension
10 reps, 5 sec hold + curl
up
10 reps, 5 sec hold + oblique curl up
Balance exercises Marching, tip-toe walking, sideways walking, tandem walking On floor On a line drawn on the floor On exercise mats
Standing
Deep breathing with shoulder abduction and adduction: 8 reps
Trunk flexibility: anterior and posterior pelvic tilts, trunk rotation and lateral bending, trunk forward bending with knees bent, 8 reps each
Sitting
Foot and ankle stretches: inward and outward rotation, plantar and dorsiflexion, rolling a tennis ball under the sole of the foot, 4 reps each bilaterally
Piriformis stretching: 3–4 reps bilaterally
Four-point kneeling
Trunk flexibility: trunk flexion and extension, 10 reps
Crook lying
Bridging: 10 reps, 5 sec hold
Strengthening exercises
Home exercise program:
Weeks 1–4
Weeks 5–8
Weeks 9–12
Position Crook lying Sitting Standing
Maximum PFM contractions 3 sets, 10 reps, 6 sec hold
3 sets, 10 reps, 8 sec hold
3 sets, 10 reps, 10 sec hold
“Knack” 3 sets, 3 reps 3 sets, 3 reps 3 sets, 3 reps
Rapid repeated PFM contractions 3 reps, 6 contractions
3 reps, 8 contractions 3 reps, 10 contractions
Podium 3 reps, 6 sec holds 3 reps, 8 sec holds 3 reps, 10 sec holds Hip abduction with ankle weights: 10 reps, 3 sec hold
REFERENCES
1 Hannestad Y, Rortveit G, Sandvik H, et al. A community-based epidemiological survey of female urinary incontinence: The Norwegian EPICONT study. J Clin Epidemiol 2000; 53:1150–7.
2 Hunskaar S, Burgio KL, Diokno A, et al. Epidemiology and natural history of urinary incontinence. In: Abrams P, Cardozo L, et al., editors. Incontinence 2nd international consultation on incontinence. Paris: Health Publications Ltd.; 2002. 165–201.
3 Latthe P, Foon R, Khan K. Nonsurgical treatment of stress urinary incontinence (SUI): Grading of evidence in systematic reviews. British Journal of Obstetrics and Gynaecology 2008; 115:435–44. 4 Kim H, Suzuki T, Yoshida Y, et al. Effectiveness of multidimensional exercises for the treatment of stress urinary incontinence in elderly community-dwelling Japanese women: A randomized, controlled, crossover trial. J Am Geriatr Soc 2007; 55:1932–9.
5 Balmforth J, Bidmead J, Cardozo L, et al. Raising the tone: A prospective observational study evaluating the effect of pelvic floor muscle training on bladder neck mobility and associated improvement in stress urinary incontinence. Neurourol Urodyn 2004; 23:553–4.
6 Wilson PD, Bø K, Hay-Smith J, et al. Conservative treatment in women. In: Abrams P, Cardozo L, et al., editors. Incontinence, 2nd edition. Paris: Health Publications Ltd.; 2002. 571–624.
7 DeLancey JOL. Anatomy and mechanics of structures around the vesical neck: How vesical neck position might affect its closure. Neurourol Urodyn 1988; 7:161–2.
8 DeLancey JOL. Structural support of the urethra as it relates to stress urinary incontinence: The hammock hypothesis. Am J Obstet Gynecol 1994; 170:1713–23.
9 Miller JM, Ashton-Miller JA, DeLancey JOL. A pelvic muscle precontraction can reduce cough-related urine loss in selected women with mild SUI. J Am Geriatr Soc 1998; 46:870–4.
10 Braekken IH, Majida M, Engh ME, et al. Morphological changes after pelvic floor muscle training measured by 3-dimensional ultrasonography: A randomized controlled trial. Obstet Gynecol 2010; 115:317–24.
11 Brown JS, Bradley CS, Subak LL, et al. The sensitivity and specificity of a simple test to distinguish between urge and stress urinary incontinence. Ann Intern Med 2006; 144:715–23.
12 Longstreth GF, Thompson WG, Chey WD, et al. Functional bowel disorders. Gastroenterology 2006; 130:1480–91.
13 Haylen BT, de Ridder D, Freeman RM, et al. An International Urogynecological Association (IUGA)/International Continence Society (ICS) joint report on the terminology for female pelvic floor dysfunction. International Urogynecology Journal 2010; 29:4–20.
14 Koelbl H, Nitti V, Baessler K, et al. Committee 4: Pathophysiology of urinary incontinence, faecal incontinence and pelvic organ prolapse. In: Abrams P, Cardozo L, et al., editors. Incontinence, 4th edition. Paris: Health Publications Ltd.; 2009.
15 Abrams P, Cardozo L, Khoury S, et al., editors. Incontinence, 2nd edition. Paris: Health Publications Ltd.; 2002.
16 Hay-Smith J, Berghmans B, Burgio K, et al. Committee 12 adult conservative management. In: Abrams P, Cardozo L, et al., editors. Incontinence, 4th editon. Paris: Health Publications Ltd.; 2009.
17 Staskin D, Kelleher C, Avery K, et al. Committee 5A: Initial assessment of urinary and faecal
incontinence in adult male and female patients. In: Abrams P, Cardozo L, et al., editors. Incontinence, 4th edition. Paris: Health Publications Ltd.; 2009.
18 Shumaker SA, Wyman JF, Uebersax JS, et al. Health-related quality of life measures for women with urinary incontinence: The Incontinence Impact Questionnaire and the Urogenital Distress Inventory. Continence Program in Women (CPW) Research Group. Qual Life Res 1994; 3:291–306.
19 Robinson D, Pearce KF, Preisser JS, et al. Relationship between patient reports of urinary incontinence symptoms and quality of life measures. Obstet Gynecol 1998; 91:224–8.
20 Corcos J, Behlouli H, Beaulieu S. Identifying cut-off scores with neural networks for interpretation of the incontinence impact questionnaire. Neurourol Urodyn 2002; 21:198–203.
21 Hagen S, Hanley J, Capewell A. Test-retest reliability, validity and sensitivity to change of the Urogenital Distress Inventory and the Incontinence Impact Questionnaire. Neurourol Urodyn 2002; 21:534–9.
22 Laycock J, Jerwood D. Pelvic floor muscle assessment: The PERECT scheme. Physiotherapy 2001; 87:631–42.
23 Dumoulin C, Gravel D, Lemieux MC, et al. Reliability of dynamometric measurements of the pelvic floor musculature using the Montréal dynamometer. Neurourol Urodyn 2003; 23:134–42.
24 Dumoulin C, Gravel D, Bourbonnais D, et al. Reliability of dynamometric measurements of the pelvic floor musculature. Neurourol Urodyn 2004; 23:134–42.
25 Morin M, Bourbonnais D, Gravel D, et al. Pelvic floor muscle function in continent and stress urinary incontinent women using dynamometric measurements. Neurourol Urodyn 2004; 23:668–74.
26 Morin M, Dumoulin C, Gravel D, et al. Reliability of speed of contraction and endurance dynamometric measurements of the pelvic floor musculature in stress incontinent parous women. Neurourol Urodyn 2007; 26:397–403.
27 Madill SJ, Harvey MA, McLean L. Women with SUI demonstrate motor control differences during voluntary pelvic floor muscle contractions. Int Urogynecol J 2009; 20:447–59.
28 Madill S, Tang A, Pontbriand-Drolet S, et al. Comparison of two methods for measuring the
pubococcygeal line from sagittal-plane magnetic resonance imaging. Neurourol Urodyn 2011; 30:1613–9. 29 Lockhart ME, Fielding JR, Richter HE, et al. Reproducibility of dynamic MR imaging pelvic
measurements: A multi-institutional study. Radiology 2008; 249:534–40.
30 Handa VL, Lockhart ME, Kenton KS, et al. Magnetic resonance assessment of pelvic anatomy and pelvic floor disorders after childbirth. Int Urogynecol J 2009; 20:133–9.
31 Fielding JR. Practical MR imaging of female pelvic floor weakness. Radiographics 2002; 22:295–304. 32 Bombieri L, Freeman RM, Perkins EP, et al. Objective assessment of bladder neck elevation and urethral compression at colposuspension. Br J Obstet Gynaecol 2002; 109:395–401.
33 Woodfield CA, Hampton BS, Sung V, et al. Magnetic resonance imaging of pelvic organ prolapse: Comparing pubococcygeal and midpubic lines with clinical staging. Int Urogynecol J Pelvic Floor Dysfunct 2009; 20:695–701.
34 Madill SJ, McLean L. Relationship between abdominal and pelvic floor muscle activation and intravaginal pressure during pelvic floor muscle contractions in healthy continent women. Neurourol Urodyn 2006; 25:722–30.
35 Smith MD, Coppieters MW, Hodges PW. Is balance different in women with and without stress urinary incontinence. Neurourol Urodyn 2008; 27:71–8.
36 Smith MD, Coppieters MW, Hodges PW. Postural activity of the pelvic floor muscles is delayed during rapid arm movements in women with stress urinary incontinence. Int Urogynecol J 2007; 18:901–11. 37 Yalcin I, Peng G, Viktrup L, et al. Reductions in stress urinary incontinence episodes: What is clinically important for women? Neurourol Urodyn 2010; 29:344–7.
38 Barber MD, Spino C, Janz NK, et al. The minimum important differences for the urinary scales of the pelvic floor distress inventory and pelvic floor impact questionnaire. Am J Obstet Gynecol 2009; 200:580 e1–7.
39 Aukee P, Usenius J-P, Kirkinen P. An evaluation of pelvic floor anatomy and function by MRI. Eur J Obstet Gynecol Reprod Biol 2004; 112:84–8.
40 Sherburn M, Bird M, Carey M, et al. Incontinence improves in older women after intensive pelvic floor muscle training: An assessor-blinded randomized controlled trial. Neurourol Urodyn 2011; 30:317–24. 41 Sran M, Wilson P, Lieblich P, et al. Physiotherapy significantly reduces leakage in postmenopausal women with osteoporosis and urinary incontinence: results of a rondomized controlled trial. Canadian Physiotherapy Association National Congress; July 15–17; Whistler, British Columbia 2011, p. 35–6. 42 Burns PA, Pranikoff K, Nochajski T, et al. Treatment of stress incontinence with pelvic floor exercises and biofeedback. J Am Geriatr Soc 1990; 38:341–4.
43 Madill SJ, Harvey MA, McLean L. Women with stress urinary incontinence demonstrate motor control differences during coughing. J Electromyogr Kinesiol 2010; 20:804–12.
44 Dumoulin C, Peng Q, Stodkilde-Jorgensen K, et al. Changes in levator ani anatomical configuration following physiotherapy in women with stress urinary incontinence. J Urol 2007; 178:970–7.
45 Herbison P, Hay-Smith J, Paterson H, et al. Research priorities in urinary incontinence: Results from citizens' juries. BJOG 2009; 116:713–8.
This is the accepted version of the following article: Madill S, Pontbriand-Drolet S, Tang A, Dumoulin C. (2013) Effects of pelvic floor muscle rehabilitation on PFM function and morphology in older women. Neurourology and Urodynamics; 32(8):1086-1095., which has been published in final form at