Lefebvre : Corresponding author. Université du Québec à Montréal (UQAM), Department of Economics, CP 8888, Succ. Centre-Ville, Montréal, QC Canada H3C 3P8 ; and CIRPÉE
lefebvre.pierre@uqam.ca
Merrigan : Université du Québec à Montréal and CIRPÉE
The analysis is based on Statistics Canada’s National Longitudinal Survey on Children and Youth (NLSCY) restricted-access Micro Data Files, which contain anonymized data collected in the NLSCY and are available at the Québec Inter-university Centre for Social Statistics (QICSS), one of the Canadian Research Data Center Network. All computations on these micro-data were prepared by the authors who assume the responsibility for the use and interpretation of these data. This research is funded by the Fonds québécois de la recherche sur la société et la culture. We thank Mathieu Verstraete for is professional help in conducting the estimations and Clément Lemelin and participants to the 2009 Meeting of the SCSE for useful comments on a first draft of the paper.
Cahier de recherche/Working Paper 09-35
Public Subsidies to Private Schools Do Make a Difference for Achievement in Mathematics: Longitudinal Evidence from Canada
Pierre Lefebvre Philip Merrigan
Abstract:
Selection into private schools is the principal cause of bias when estimating the effect of private schooling on academic achievement. By exploiting the generous public subsidizing of private high schools in the province of Québec, the second most populous province in Canada, we identify the causal impact of attendance in a private high school on achievement in mathematics. Because the supply of highly subsidized spaces is much higher at the high school level than at the grade school level, 60% of transitions from the public to private sector occur at the end of grade school, we assume that these transitions are exogenous with respect to changes in transitory unobserved variables affecting math scores conditional on variables such as changes in income and child fixed effects. Using data from Statistics Canada’s National Longitudinal Survey on Children and Youth (NLSCY), we estimate the effect of attending a private high school on the percentile rank and a standardized math test score with different models (child fixed-effect, random-effect and a pooled OLS) and restricted samples to control for the degree of selection. The results, interpreted as a treatment on the treated effect show that the effect of changing schools, from a public grade school to a private high school, increases the percentile rank of the math score between 5 and 10 points and by between .13 to .35 of a standard deviation depending on the specifications and samples. Keywords: Test scores, private high schools, subsidies, longitudinal data
1. Introduction
Improving the performance of children in mathematics and reading is a key public policy objective in the United States as well as in Canada. Since the end of World War II, global free trade has substantially increased the level of competition between firms in wealthy industrialized nations. A well-trained work force can only improve the strategic position of these firms by increasing the level of worker productivity. It is well known that schooling has historically played a very important role training the work force. Given these facts, a tremendous amount of research on schooling choices and on the impact of these choices on earnings has been done over the last 20 years. An empirical debate on the best policy to increase the level of achievement of students has become a perennial topic of debate for both policymakers and social scientists. A recent book presenting the points of view of James Heckman and Alan Krueger (2004) on this matter is particularly revealing. Heckman refutes the claim, interpreting the evidence on this topic, that reducing class sizes is an effective policy for improving schooling achievement. Krueger argues the opposite.
In another area of research, some recent work by Hoxby (2000) has shown that a more competitive schooling market where parents have a larger set of choices can improve the academic performance of children. This paper presents new evidence supporting this claim.
Most empirical work on the impact of schooling choices made by parents for their children on academic achievement encounters the problem of spurious correlation of parental choice and achievement as unobserved variables such as parental tastes for the quality of education are correlated with both parental choice and achievement of children in school.
In the United States, abstracting from the current wave of research on whether vouchers, charter schools, and other reforms that increase choice in education improve the quality of education, many influential studies have estimated the effects of Catholic secondary schooling on test scores, high school completion rates, and college attendance. Neal (1997, 1998) reviews the long history of research in this area, and Altonji et al. (2005a, 2005b) provide an overview of the discussion and references to the literature. These schools established across the nation are the largest and most homogeneous group of schools within the private sector and are found in a variety of geographical environments (urban, suburban and rural).1 Results from multivariate regressions support the evidence that Catholic schools on average are conducive to superior gains
1 According to the Annual Data Report of the National Catholic Association, the United States had 7,498 Catholic schools in 2006-07, including 6,288 elementary schools and 1,210 secondary schools. In total there were 2,320,651 students, including 1,682,412 students in the elementary/middle schools and 638,239 in high schools.
in attainment and achievement in comparison with the relevant public counterparts. However, one can argue that despite the numerous controls included in these analyses, private schools and their students are different by some unmeasured characteristics that lead to better schooling outcomes. These unmeasured traits may explain selection into private schools and the direct effects on student’s performance. Families who dedicate some of their resources to pay for private school attendance signal a preference for education. To minimize the positive bias of selection on the estimated effects of private schools, researchers have used a variety of exclusion restrictions such as religious affiliation, geographic proximity to Catholic schools, and the interaction between them to identify private school effects using IV methods. Altonji et al. (2005b) evaluate the validity of instrumental variable strategies and conclude “that none of the candidate instruments is a useful source of identification of the Catholic school effect, at least in currently available data sets”. In another paper (2005a) they develop new estimation methods using the degree of selection on the unobserved variables to assess the effect of attending a Catholic high school on a diversity of outcomes. They find no evidence of an effect on test scores, but conclude that private schools do have positive effects on high school completion rates and college attendance decisions.
This paper addresses the issue of selection into private schools by exploiting the relatively generous public subsidizing of private high schools in the province of Québec, the second most populous province in Canada, to identify the causal impact of attendance in a private high school on achievement in mathematics without the use of instrumental variables. Because the supply of private high schools is much higher than for grade schools for historical reasons and that they are highly subsidized, 60% of transitions from the public to the private sector occur at the end of grade school, we assume that the transition from public to private schools are exogenous conditional on variables such as income and child fixed effects. Using data from Statistics Canada’s National Longitudinal Survey on Children and Youth (NLSCY), we estimate the effect of private high school attendance on the percentile rank and a standardized measure of a math test score with different models (child fixed-effect, random-effect and a pooled OLS) and restricted samples to control for the degree of selection. To the observed socio-economic covariates including a family functioning scale at different ages of the child as well as family income, we add in some regressions three behavioral scales to control for other potential confounders. The results show that the effect of attending a private school in Québec for those attending private schools in Québec (the treated) increases the percentile rank of the math score by between 5 to 10 ranks depending on the specification and samples. It remains possible that mechanisms such as Ashenfelter’s dip (1978) could be in play but, given our identification strategy and the results, we believe they are
marginal in terms of their impact on the estimated effect of private schooling on achievement in mathematics.
The structure of the paper is the following. In section 2, we trace the history of private schooling in the province of Québec and the uniqueness of the private school network among the other Canadian provinces. In section 3, we expose the econometric methodology that is used to identify the causal effect (treatment on the treated effect) of private schooling on math achievement. In sections 4 and 5, we detail the Canadian NLSCY data set used, and describe the explanatory variables in the model. We also present descriptive statistics as an introduction to Section 6 where the estimates of the effects of private school attendance are presented. The last section concludes with the policy implications of our results.
2. Québec’s private schools
This section describes the changes of Québec’s education system over time and highlights its distinctive features compared to the education system of the other Canadian provinces. We present the sources of revenues of Québec’s private schools, the evolution over time of the number of students enrolled in public and private schools, and, finally, the measured gaps in test scores between the students of these schools.
Among all the ten Canadian provinces, Québec has the most extensive sector of private schools. Table 1 shows the number of students in public and private primary and secondary schools for the school year 2003-2004 in Québec and in the four other Canadian provinces who dedicate public funds to private schools as well as total subsidies. In the other five provinces there are also private schools, but they are not subsidized and enrolments are very low (see also Table 8 below).
In Québec, the tradition of subsidizing private schools has a long history. From the 1950s to the end of the 1960s, most subsidized schools were “classical elite colleges” (the study of Latin or Greek was mandatory as well as Philosophy). The curriculum lasted 8-years following the completion of primary schooling after which graduates had access to university education and, in particular, to professional faculties such as medicine, law, dentistry, optometry, pharmacy, etc. Otherwise, graduates from public schools, after 12 years of schooling, had access to a more limited number of university programs (4-years for a university diploma). For “classical” college graduates obtaining a university degree took two years for most non-professional programs. At the end of the 1960s the Québec government substantially modernized the education system. Public
kindergarten was created; the number of grades in primary school was reduced from 7 to 6 years; the number of grades in secondary school was also changed from 6 to 5 years; most “classical private colleges” became public colleges (and new ones were created over the years).2 Québec’s colleges form a distinct schooling level compared to the schooling system in the other provinces. In Québec, high school graduates must choose between two tracks: 2-years general college programs giving access to all university programs (3-years long to obtain a first degree)3 or 3-years long professional/technical colleges programs (all the 52 public colleges offer the two tracks)4 that form skilled technicians who can also access university. Finally a new network of public universities5 was created in Montreal (the largest city) and over all the regions.
In the rest of Canada, the education system is slightly different from that of Québec: K-12 to graduate from high school (K-11 in Québec). A high school graduate can choose between a community college (1- to 4-years of study to obtain a college diploma which also gives access to university) or university (3 to 4 years for a bachelor’s diploma) whereas, in Québec, admission to university is conditional on being a college graduate. Another important difference between Québec and the other provinces concerns the tuition fees paid by students. Québec’s public colleges have no tuition fees but charge ancillary fees of the order of $2006 to $300 per year. In the other provinces, community colleges also have ancillary fees associated with their various programs but their tuition fees amount to approximately $2,500 per year, which is, on average, half of university tuition fees for most programs.
With the changes brought to the Québec’s education system, the public financing of private schools was also revised in the early 1980s. Two rules were adopted. Firstly, and abstracting from a “capital subsidy” for installations, the subsidy for operating costs7 per student given to private schools is revised each year according to the subsidy per student given to public schools by level of education (kindergarten, primary, secondary, college). Secondly, the percentage of operating costs covered by the subsidy was lowered from 80% to approximately 60% for all schooling
2 Many of these “classical” schools were run by the catholic order (brothers, sisters, priests) although most of the teachers were secular. The Catholic Church was a very important player in Québec Society until 1960. The best private high-schools were almost all catholic and a large number operated throughout the province. Therefore, because of historical reasons the supply of private high schools is relatively high in Québec.
3 Except medicine and some professional programs who all have a mandatory one-year internship. 4 There are 24 subsidized private colleges who offer mainly the general program.
5 All universities in Canada and Québec are public. In Québec, all universities receive the same subsidies per student which are related to programs of study and tuitions fees are fixed by the government. The tuitions fees in Québec are half the mean fees in the other provinces.
6 All monetary amounts throughout the text are expressed in Canadian dollars.
7The operating costs consist mainly of teachers and non-teaching salaries and other costs except the location value of premises.
levels. Table 2 presents the subsidy to private schools by schooling level. For school year 2004-2005, the subsidies per student for a kindergarten, primary, secondary school and college, are respectively, $3,006, $2,582, $3,556 and $4,757, to which the government adds respectively $93, $93, $139 and $514 per student for installations. Hence, the subsidy per student in private secondary schools is considerably larger than for private primary schools.
Evidently, the sources of revenues differ between Québec’s public and private schools. Table 3 shows the sources of revenues for public and private schools for school year 2004-2005. For private schools, almost half of the operating expenses are covered by subsidies and a third is generated by registration, admission, and school fees. Moreover, the government requires that the fees of subsidized private schools not exceed the subsidy per student. Table 4 shows the authorized maximum fee according to regulation and the actual maximum fee charged by private schools by schooling level. Very few private schools fix their fees to the maximum permitted. Administrative statistics (not shown here) for 169 subsidized private schools indicate that, on average, the fee is 68.3% of the authorized maximum fee and that this gap varies by region (from 39% to 84.3% in Montreal), which suggests that families are price sensitive and that the market is competitive.
All private schools must have a permit delivered by Québec’s Ministry of Education to operate. The Ministry treats the demands, renewals, and modifications to the permit which specifies the maximum number of students in the school’s premises. To be accredited and to receive subsidies, the curriculum must be approved. The students in grades 4 and 5 of secondary private schools must also take the standard French, English, History, Math, and Physics exams of the Ministry, as do the students of public schools. Almost all private schools are subsidized (see Table 1). They represent approximately 90% of the primary and secondary private schools. Two “types” of private schools are not subsidized. The first type consists of a few “elite” primary and secondary schools who offer enriched curricula and high levels of pedagogical supervision as well as other activities. All are in the metropolitan region of Montreal. Their schooling fees are much higher than the maximum permitted to be a subsidized school. The second type, the majority of unsubsidized private schools, consists of “commercial” schools or colleges which offer very specific low-skill training (hairdressing, secretarial skills, paramedical assistants, travel agent, etc.).8 In school year 2003-2004, private schools are distributed as follows by education level: 130 at the primary level, 140 at the secondary level, 59 at both the primary and secondary levels, 24 at the college level (16 offer both the secondary and college levels). Hence, the majority of private
8 Most of the technical skills training are also offered in public schools which all have centers of training for manual occupations.
schools are found at the secondary level of education. By comparison, there are 2,434 primary and secondary public schools, 52 public colleges, and all the 19 universities are public. Although there are only 69 more private secondary level schools than private grade schools, secondary level schools are much larger, thus explaining the much larger supply of private high-school places compared to grade school. For school year 2007-2008, there were 89,000 students enrolled in private secondary schools and 32,000 students in private primary schools; for public schools the enrolments were respectively, 395,000 (secondary level) and 446,000 (primary level).
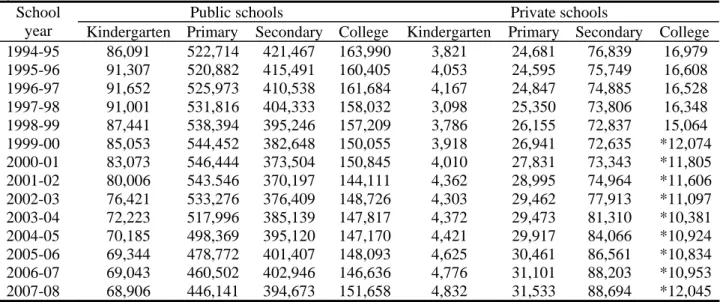
Table 5 presents the number of students enrolled in Québec’s public and private schools, by education level and for the school years 1994-95 to 2007-08. The statistics show a declining trend of total enrollment in public schools at the primary and secondary levels in Québec. This trend is similar in Canada and can be explained by the declining rates of fertility over the years. In contrast, there is an upward trend in the private sector at the primary and secondary levels, but not at the college level. The private enrollment ratio varies by province as can be seen from column 3 in Table 1 (and in Table 8). One Québec student out of ten is enrolled in the private sector. Only British Columbia has a similar rate. A rapid calculation from Montréal’s School Board statistics indicates that more than 20% of students are enrolled in private primary and secondary schools. For the purpose of this study, it is important to stress the fact that few Québec families enroll their child in a private primary school. For the school year 2004-2005, the last year of available survey data for our study, only 5.7% of Québec’s students are in a private school at the primary level. On the other hand, almost one out of five (17.5%) students is in a private school at the secondary level.
Outcomes in public and private schools
School performance can be measured by high school graduation rates, the average number of years used to obtain a high-school degree, and access to postsecondary education (college and university). Along all these dimensions, private schools do better than public schools.
Québec’s Ministry of Education administers unique exams in French and English, History, Math, and Physics, for students in grades 4 and 5 of secondary level schools. As of June 2005 and for all schools, the overall average score and pass rate in these exams were, respectively, 73.3% and 83.3%. In private schools, the overall average score was 80.8%, compared to 71.4% for public schools. The pass rate was 80.6% for public schools and 94.5% for the private schools. For the 2002 cohort, 53% of students in public schools obtained their high school diploma after 5 years (the “normal” length after primary school) compared to 83% for students in private schools. For
colleges (general or technical), a study by Riopel (2004) shows that, for the 1997 to 2002 cohorts, the graduation rates in private schools were higher, for men and women by 19.2% and 14.5% respectively. For the 2001 cohort, according to the Ministry of Education, 85% of students in private university transfer programs (general college) obtained a diploma after 4 years compared to 70% in public colleges; for the technical colleges; after 6 years the rate is 61% for private colleges compared 64% for the public colleges.9
A contentious issue in the public debate about educational choices is the role of selection, based on academic performance, into private schools. Opponents of the use of public funds to finance private schools, especially the Association of Public School Boards, argue that the higher performances of the private sector are the “natural” result of the selection of “highly skilled” students. If an important fraction of “bright students” enroll in private schools, there is a decline in both the overall quality of public school students and of the performance of the lesser-skilled students remaining in public schools (the “cream skimming effects”). Finally, opponents to the subsidization of private schools argue that an objective comparison of the academic performances of public and private schools requires comparing students from the same socio-economic backgrounds.
Private schools can and do select their students.10 In a 2006 document on admission, the Federation of private schools reports that “70.0% of students who took an admission exam for grade one of secondary school were admitted, 17.6% had their application rejected because of space limitations, and 5.4% have been turned away because the school did not have the specialized human resources to respond to the special needs of these students” (p.3). This suggests that almost 25% of the candidates have seen their applications in private schools rejected because of their results at the entrance exam. Another 2005 survey of the Federation (FEEP, 2006), shows that many institutions have a waiting list for admission to their secondary level schools. Selection is practiced when admissions are higher than available spaces. From the survey (124 respondents of the 150 institutional members), half declare that they accept all students and the other half report that they must reject applications because of space considerations.
9 The Ministry does not present separate statistics for private and public college graduates pursuing a university education. For year 2005-06, 78% of general college graduates entered a university program without interruption; the percentage for graduates in a technical college is 25%.
10 The selection process is less severe at the primary school level. The schools who offer both the primary and secondary levels generally admit to the secondary level a student that is enrolled at the primary level if she succeeds. The tradeoff for families is school fees that must be paid for many (six) years since the admission policy of these “integrated” schools favors entrance in grade 1 of primary school.
Competitive actions taken by the public schools
In the 1990s, School Boards who administer the public schools reacted more vigorously to the flight of students to private schools by offering selective and particular pedagogical projects to keep more skillful students, and more attractive programs, selective or not to, from the point of view of parents and students. The number of public schools where all the school is dedicated to a particular project is small: 16 in all; 4 with an international program; 5 with an “enriched” program; 1 with a foreign language program; 3 with an arts program; 2 “alternative” schools and 1 school for high school drop-outs. On the other hand, more schools have developed a within school particular project. For example, according to administrative data for school year 2005-2006, 93 public high schools have adopted an international program. Table 6 presents the number of students in primary and secondary public schools enrolled in particular pedagogical projects by type. Unfortunately, in our data set we cannot distinguish those students on the basis of private or public schooling. We consider the reactions of the public schools as a competitive response to the quality and diversity of programs offered in private schools.
3. Analytical framework
Endogeneity is the most important econometric problem one encounters when trying to measure the effect of private schools on children’s academic performance. In other words, nonrandom selection into private schools is an issue most studies on the subject try to tackle, in the absence of experimental data. The unobservable background characteristics of most students may thus lead parents to enroll their child into a private school. Moreover, characteristics of private and public schools are likely to influence their effectiveness.
Obviously, OLS regressions will produce a positively biased effect of private schooling on math scores or ranking, children from wealthier families being drawn to private schools. Even controlling for income, OLS estimates are biased. Children in private schools live with parents who on average place a high value on education. We will use a child fixed effect regression method to compute consistent estimates of this effect.
Our identification strategy is simple. It is based on the idea that moving from a public grade school to a private high school in the Province of Québec is uncorrelated with changes in unobserved variables during that same time period. We believe that the principal cause that explains the relatively large (compared to other jurisdictions across Canada) transitions between public grade school and private high school is the large increase in the supply of inexpensive private school places when the child transits to the high school level in Québec. Therefore, we rule
out spurious effects caused by mechanisms such as Ashenfelter’s Dip that would bias the estimated effects of private schooling using panel data and child level fixed effects.
For example, a spurious effect will be estimated with a child fixed effect method if parents from higher income households, following a potentially temporary dip in school grades reacted by sending their children to private school. A positive effect of private schooling would simply reflect a return of students to their normal levels of achievement. Without ruling out that such a mechanism is playing out in areas with high fees for attending private schools, we surmise that it plays a very small role in the case of a sample of children who are moving in a private school in Québec as they leave grade school in the sixth grade.
As we stressed in the last section, the subsidy per student of Québec’s private high-schools is more important than that of its private elementary schools and the supply of places is much higher. Moreover, this variation in the subsidy or supply of places does not depend on any unobservable characteristics of children. It is thus equivalent to an exogenous change in private schools spaces and prices. As families are price and supply sensitive, this variation explains why the percentage of students enrolled in private schools is more important in high-schools than at the elementary level. Hence, measurements of the effect of Québec’s private schools on the academic performance of Québec’s children should not suffer from simultaneity bias with a child-fixed effect estimation method.
Table 7 shows that a very large proportion of Quebec children in our sample (described in the next section) move to the private schooling sector after grade school in reaction to the large number of private schools available at the high school level as shown in the preceding section. Out of 224 children transiting from public to private school in our sample, 60% are observed transiting from grade school to public school. We assume that a sample of children composed of children observed in grade school in one cycle of the NLSCY and in high school the next will be less sensitive to Ashenfelter’s dip and will provide us with credible causal estimates of the effect of attending private school on achievement in mathematics. It is our contention that instrumental variable estimation or control function estimations are not necessary for the special case of Québec.
Our modeling strategy to capture the effect of private schools on academic performance is progressive and simple. First, we select all of the NLSCY’s children aged 7 to 15 years with at least two math scores.11 This measure of academic performance is regressed on socio-economic
11 A child’s math scores may not be consecutive scores, that is a child may drop out of the survey for one or more waves and then reappear.
covariates including a private school dummy variable and child fixed effects. Practically we estimate the parameters of the following child fixed-effect model using the panel features of the NLSCY: ia i ia ia private X e T =α* + β +μ + . (1)
Where T is child i’s percentile math score at age a; private a dummy variable equal to one if the ia child attends a private school; X the observed socio-economic covariates at age a, including ia household income and a constant; μi is the child’s fixed effect; and e the residual. The ia vectorX may be “augmented” to include three behavioral scales that measure a child’s ia hyperactivity (hyperactive-inattentive), anxiety (anxiety and emotional disorder), and aggression (conduct disorders-physical aggression). Including these behavioral scales is an additional means to control for a possible endogeneity problem that might bias our estimate of the effect of private schools on children’s academic performance.
After estimating the model with all children who have at least 2 math scores, we restrict our sample by considering only children at the end of primary school (5th and 6th grades) and at the beginning of secondary school (7th and 8th grades). The first sample should be more prone to bias due to Ashenfelter’s dip because children may change from a public to a private school after experiencing a transitory bad period in school. The second sample provides a variation in the private schooling variable that is exogenous to temporary variations in unobserved factors related to achievement levels in school.
In addition to the child fixed-effect model (1), we also estimate a random-effect model and a pooled OLS model to observe the bias present in methods that do not provide a control for selection. Because of the probable heterogeneity of the effect of attending a private school on achievement, we interpret our estimated effect of private schooling as an effect of the treatment on the treated that is the effect of private schools on children who attend private schools.
4. Data set
The data used for our empirical analysis are provided by Statistics Canada’s National Longitudinal Survey of Children and Youth (NLSCY) which is a probability survey designed to provide information about children and youth in Canada. The survey covers a comprehensive range of topics including childcare, schooling, physical development, learning and behavior as
well as data on their social environment (family, friends, schools and community). The NLSCY began in 1994-1995 and data collection occurs biennially. The unit of analysis for the NLSCY is the child or youth. Information concerning each selected child between 0 and 17 years of age and the family are provided by the person most knowledgeable (PMK) of the child. The PMK was usually the child’s mother (more than 90% of the time), but it could also be the father, a step-parent or an adoptive step-parent who lived in the same dwelling.
A sample of 22,831 children, aged 0 to 11 years was selected in Cycle 1 (1994-1995) of the survey, in each of the 10 provinces, making up the longitudinal sample. To reduce the response burden on families with several eligible children, the number of children selected was limited to two per family in Cycle 2 (1996-1997). Therefore, some children were dropped from the original sample (16,903 children remained in the longitudinal sample). The rule changed to one child per household without exception in Cycle 5 (2002-2003). Because of the design of the survey no separate analysis using longitudinal data fixed-effect sibling analysis can be conducted. The last data set available is Cycle 6 (2004-2005), where the oldest children are aged from 18 to 21 years.
The test is administered to children who were at least enrolled in their second grade school year and aged from 7 to 15 years.12 Therefore, not all children from the original longitudinal sample (1994-1995) can be used for this paper’s estimations. Moreover, since the natural age progression of a child between surveys is two years, only children aged at least 3 in the first wave were retained in our database. A child aged 3 in the 1st cycle with a “normal” age schooling progression of two years between cycles will be 5 in the 2nd cycle, 7 in the 3rd, 9 in the 4th, and so on. Because the test is taken at age 7 and for children at least in second grade school some can be observed with more than two math scores at a different schooling level.13
We use data on children aged 7 to 15 with at least two test scores.
Math scores
The CAT/2 test is a shorter version of the Mathematics Computation Test taken from the Canadian Achievement Tests, 2nd edition. The CAT/2 is designed to measure basic skills in math (addition, subtraction, multiplication and division on integers, etc.). The master files present both the CAT/2-raw and –standardized scores. The raw score is simply the number of correct answers to the test. The difficulty of the test varies with the schooling grade of the child. Thus, there are
12 All the 16- and 17-year-olds pass take once a different math test (reading comprehension, problem-solving and decision making).
13 In Cycles 2 and 3, there was both a Math and a Reading test. In Cycle 4, only the math test was administered. The reading test was removed because of time constraints. It was decided that only one test could be administered. The math test was chosen as it had been administered in all previous cycles.
different tests depending on the school-level the child is in. Statistics Canada standardizes the raw scores using a sample of Canadian children from the ten provinces which is called the normative sample. This sample was chosen by the Canadian Testing Center. The standardized scores are obtained using sub-samples (by schooling-grade) of the normative sample.
A significant proportion (approximately 35%) of children in two school grades obtained a perfect score when they passed the tests in 1994-1995 (cycle 1 of the survey). Therefore subsequent cycles added more versions of the tests. These “newer” versions of the tests were still based on the school-level of children but with a clearer distinction made between school years. For example, in 1994-1995, children in their second and third school years (who are 7 and 8 years old) took the level 2 test. Two years later, children of the same ages took two different tests: the level-2 test for children in their second school year (7 years old) and the level-3 test for children in their third school year (8 years old). Hence it is possible that children of different ages passed the same test in a particular cycle. Preliminary results with the standardized scores (presented in Table A3) showed strong negative period effects. Given Statistics Canada’s interpretation of the scores, this translates into a serious deterioration in math achievement across Canada. Because this made little sense, considering that the math mean performance of the 15-year-olds Canadians in successive OECD’s PISA’ surveys (2004, 2007) has not declined, the Hazen method was applied to calculate another dependent variable for math achievement, percentile ranks based on the standardized scores. The percentile ranks are always calculated with regard to the level of the test the child passed and for each cycle of the NLSCY used. We also use as an alternative dependent variable, because the percentile rank variable is truncated, the math score in units of a standard deviation (standardized to have a mean 0 and a standard deviation 1). Finally, we also measure the sensitivity of the results to outliers by dropping children with math scores in the first and last 5% of the distribution of scores.
We have fewer observations for cycles 1 to 3 compared to cycles 4 to 6; because of the way Statistics Canada conducted the test. The test was administered by the child’s teacher once the PMK of the child and the School Board had given consent. For cycle 1, the NLSCY received results for about 50% of eligible children; for cycle 2, the percentage was 74% and for cycle 3, it was 54%. Since cycle 4 of the NLSCY, in order to minimize the time dedicated by teachers to the survey and to avoid disturbing class activities at the end of the school year, the math test is administered at the home of the child rather than in school, and almost all eligible children are observed with a test score.
5. Control variables and descriptive statistics
Tables A1 and A2 present the means of the socio-economic control variables (characteristics of the children, PMK and families) respectively for the overall sample, and the restricted sample with children who are transiting from grade school to high school. For child characteristics, we control for age in months, gender, if repeated last grade, has a chronic condition, changed school (other than transition from public to private school), and scores on three behavioral scales constructed by Statistics Canada: child’s hyperactivity (hyperactive-inattentive), anxiety (anxiety and emotional disorder), and aggression (conduct disorders-physical aggression). For children aged 7 to 9 the behavioral scores are reported by the Person Most Knowledgeable (PMK) of the child, generally the child's mother. For children aged 10 to 15 the scores are self reported. For the PMK, we control for age, level of education, non-immigrant status, family type, age and number of siblings, size of community and family income (2001 dollars). A family functioning score is also used as a control.14 This scale provides a global assessment of family functioning and an indicator of the quality of the relationship between parents or partners. The total score varies between 0 and 36, a high score indicating family dysfunction.
6. Econometric results
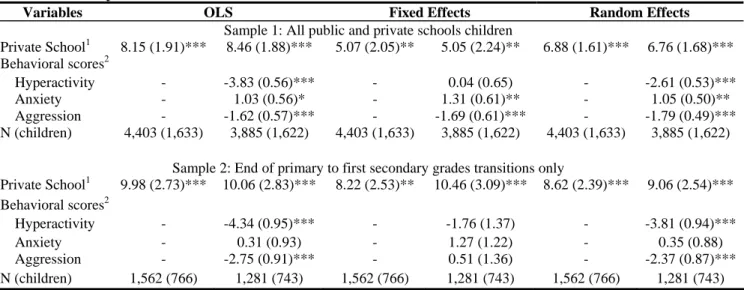
We start our analysis with the results obtained with the percentile rank of the child for the math test presented in Table 9. We present OLS, Random-effects and Fixed-effects estimates of the effect of private school attendance on rank and with two specifications (without and with behavioral scores added to the socio-economic control variables). For sample 1 (first panel) which includes all public and private school children, all estimates of the private school effect are statistically significant with the OLS estimate being the largest, as expected given that unobserved factors affecting private school choice are correlated with achievement (e.g. parental involvement in education). The child fixed effect estimate is considerably lower but shows that private schooling can make a difference for children with parents who choose private schooling as we find that the effect is approximately 5 percentile ranks.
14
As stated in the NLSCY’s user guide for the first survey (1994-1995): “This scale was administered to the Person Most Knowledgeable (PMK) of the child, generally the child’s mother, or to the spouse/partner on the Parent Questionnaire, and measures how family members relate to each to other.” More precisely: “Questions related to family functioning were developed by researchers at the Chedoke-McMaster Hospital of McMaster University and have been used widely both in Canada and abroad. This scale is used to measure various aspects of family functioning, e.g. problem solving, communications, roles, affective involvement, affective responsiveness and behavior control.”
Our second set of estimates (sample 2, second panel of Table 9) are obtained with children who are observed in either the fifth grade or sixth grade at the primary level and then in the next wave in high school. Unfortunately, there is a gap of one grade because of the children of the NLSCY are observed every two years. This sample should be the least affected by a mechanism such as Ashenfelter’s dip. Here, OLS estimates and fixed effect estimates are very similar. This occurs because very few children are in private school at the primary level. Hence, almost all the variation in the private schooling variable occurs at the secondary level. The results show a very strong effect of private schools increasing the percentile rank of children who move to a private high school by 8 to 10 ranks.
Adding the behavioral scores of the children has a very marginal impact on the estimated parameters of the private school effect. Hyperactivity and aggression are generally statistically significant variables, having a negative effect on the math scores. Whereas, anxiety has a positive impact of the percentile rank but is not significant for all cases.
It is not clear why the effects are larger for this sample compared to the other. In the other sample, possibly more children move to private schools because they are nor performing adequately in the public system. The effect of private schools on those children could be smaller because they are already in difficulty and remediation at the high school level is more difficult. It is also possible that the effect is age dependent. It could be that the younger a child makes the transition to private high schools, the better the results as the brain is more plastic at younger ages and better equipped to deal with higher standards. Finally, it is possible that the effect diminishes over time. Public schools possibly increase the supervision of students as they approach their final years where compulsory exams are taken for completion of the high school degree.
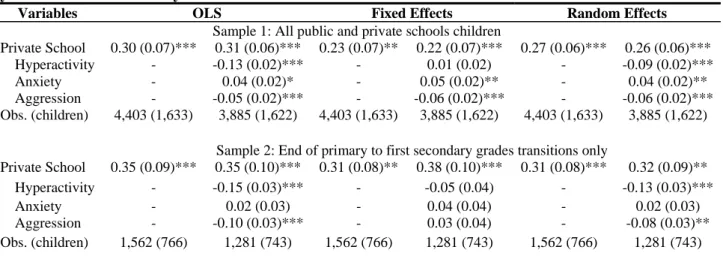
Because the percentile rank dependent variable is truncated at 0 and 100, we estimated the model using as dependent variable the number of standard deviations from the mean (for children taking the test at the same grade). It was possible in this case to perform estimations removing outliers (top and bottom 5 percent) from the sample as a test for robustness. The results are presented in Table 10. Samples referred to as samples 1, 3, 5 are the same as samples 1, 2 and 3 used to estimate the rank percentile and produce similar to the results presented in Table 9. The samples 2, 4 and 6 are more restrictive with the exclusion of outliers.
The estimated (positive) effects range from approximately 2 tenths of a standard deviation with the full sample to almost 4 tenths of a standard deviation for the most restrictive sample. When outliers are moved, the range of the effects drops to 15 percent to 30 percent of a standard deviation.
Our results show quite convincingly that private schools can considerably improve the achievement level of young teenagers. Although, we cannot affirm that randomly choosing a child in a public school and moving him to private school will improve his lot, we can affirm, given the credibility of our identifying assumptions, that parents that choose private schools are making a choice that on average will improve their children’s test scores and this at a relatively low cost for the family.
These improvements are also achieved at a low cost for the provincial government. For school year 2004-2005, at the primary and secondary schools levels, the subsidies to the private sector are $416 millions to which $457 million from fees and other revenues (see Table 3), for total revenues of $874 millions. For the same year and school levels the public sector received, $6,131 millions of public subsidies, raised $1,233 millions in school taxes and obtained $757 millions in other revenues for total revenues of $8,120 millions. The public and private sectors respectively schooled almost a million students and a little more than a hundred thousand students.
7. Conclusion
This paper demonstrates that sending a child to a private school can, ceteris paribus, improve his ranking in mathematics. More precisely, it empirically supports the hypothesis that children who attend private schools in the province of Québec benefit from their parents’ decision to send them to this type of school (a positive effect of the treatment on the treated). The effect is large as it ranges from 5 to 10 percentile ranks and 15 to 40% of a standard deviation. Estimates we suppose suffer less from possible bias are in the higher range of effects. These effects, although for only one outcome, a score on a math test, are similar to the effects estimated for American Catholic schools.
The evidence demonstrates the potential gains obtained from a competitive system of schools. For school year 2007-2008, private high schools educate 18% of high school students and 6.6% of grade school children in Québec. Table 6 shows that public schools have reacted to the flight of students to private schools by offering particular pedagogical projects mainly in urban settings. The long existence in suburban and urban settings of private schools points to the observation on outcomes that reflect long term effect of alternatives to public schools.
Our results provide some evidence that subsidizing private schools could be a wise policy to improve performance. Because we use relative measures of performance, it is difficult to ascertain whether such a policy would increase average test scores, but given that children rank better once
they move to a private school could demonstrate that they are better prepared for tests, more motivated and possibly be putting more effort in academics.
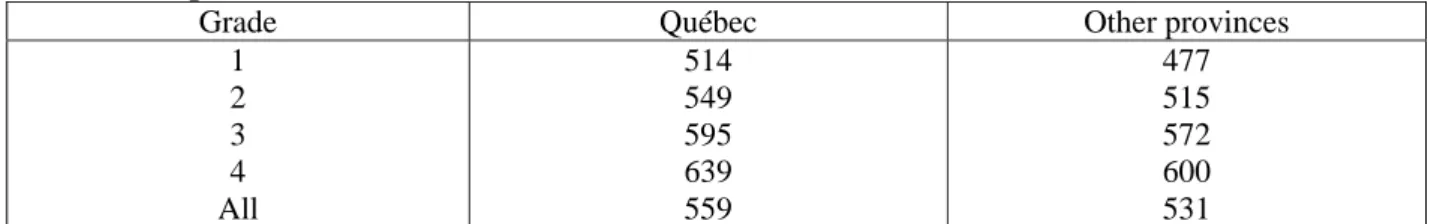
One of the main mechanisms that can justify these subsidies is the creation of a more competitive system with more choices for parents that can lift the quality of all schools. In fact, some evidence against the “cream skimming hypothesis” and for the “tide lifting all boats” hypothesis are the results presented in Table A4. When comparing the math scores for children at the same level of schooling in Québec and the Rest of Canada in public schools, we find that the children in Québec are on average doing better than those in the rest of Canada despite the fact that a much larger proportion of children are in private schools in Québec and are doing better than children in public schools. The sample of children in the Rest of Canada is much more representative of all children than the sample of children in public schools where the more talented children are underrepresented. Therefore, competition could be driving up scores in public schools. The difference between children in Québec and the rest of Canada is certainly not attributable to differences in income as the mean income of families with children in Québec is smaller than for the rest of Canada.
What do these results suggest for policy purposes? The Québec experience shows that opening up public schools to more competition; with some subsidies to private schools as well as a regulated environment for these schools is a prudent way to raise performance within and across schools (elite public schools). To provide more fact-based precise suggestions for policy we need to answer directly the question of why private schools are more effective than public schools.
References
Ashenfelter, O. (1978). “Estimating the Effect of Training Programs on Earnings,” Review of Economics
and Statistics, 6(1): 47-57.
Altonji, Joseph G., E. Todd E. Elder, and Christopher R. Taber, (2005a). “Selection on Observed and Unobserved Variables: Assessing the Effectiveness of Catholic Schools,” Journal of Political Economy, 113(1): 151-184.
Altonji, Joseph G., Todd E. Elder, and Christopher R. Taber, (2005b). “An Evaluation of Instrumental Variable Strategies for Estimating the Effects of Catholic Schooling,” Journal of Human Resources, 40(1): 1-30.
Federation of Private Schools (2006). Documentation on Private Schooling in Québec.
Heckman, James and Alan Krueger, (2004). Inequality in America: What Role for Human Capital Policies, edited by James J. Heckman and Alan B. Krueger, Cambridge, MA: MIT Press, 2004.
Higher Council of Education (2007). “The Particular Pedagogical Projects in High School: Diversity with Equity,” Advice to the minister of Education, Leisure and Sports.
Hoxby, Caroline M. (2000). “Does Competition among Public Schools Benefit Students and Taxpayers?”
American Economic Review, 90(5): 1209-1238.
Neal, Derek, (1998). “What Have We Learned about the Benefits of Private Schooling?” Federal Reserve
Bank New York Economic Policy Review, 4 (March): 79–86.
Neal, Derek, (1997). “The Effects of Catholic Secondary Schooling on Educational Attainment,” Journal of
Labor Economics 15(1), 98-123.
Massé, Denis (2005). “The Socioeconomic Status of Users of Private Schools,” Study for the Federation of Private Schools Institutions, Montreal, February.
http://recit.cadre.qc.ca/~feep/IMG/pdf/doc_prive_fevrier_2006.pdf.
Marois, J. (2005). “The State of Private Education in the Ten Canadian Provinces: Preschool, Elementary and Secondary Education,” Study for the Federation of Private Schools Institutions.
MELS (2005). Statistics of Education – 2006 Edition: Primary, Secondary, College and University Education, Annual.
MELS (2006). Indicators of Education – 2007 Edition.
OECD (2007). PISA 2006 Science Competencies for Tomorrow's World, Paris. The PISA homepage at
www.pisa.oecd.org.
OECD (2004). Learning for Tomorrow’s World – First results from PISA 2003, Paris. The PISA homepage at www.pisa.oecd.org.
Riopel, Martin (2004). “Enrollment and success in the private college network: a comparative study,” Collège Jean-de-Brébeuf, (http://www.ecs.org/clearinghouse/28/01/2801.htm).
Table 1: Number and proportion of primary/secondary level students in public and private schools in the Canadian provinces that subsidize private schools, and total subsidies, 2003-2004
Province Number in public schools Number in private (subsidized) schools Percentage in private schools (subsidized)
Subsidy per student for eligible private school
Total subsidies million $ Québec 989,838 115,200 (106,681) 10.4 (9.63) Kindergarten: $2,976 Primary: $2,578 Secondary: $3,555 Average: around 60% 397 Manitoba 188,498 14,290 (12,861) 6.51 (5.89) Kindergarten: $1,690 Primary: $3,381 Secondary: $3,381 Average: around 50% 45 Saskatchewan 174,263 2,627 (1,655) 1.36 (0.86) Primary: $0 Grade 9: $4,723 Grades 10-12: $5,045 to $5,271 8.3 Alberta 552,592 28,500 (27,209) 4.81 (4.59) Kindergarten: $2,227; 100% Primary: $2,672 $; 60% Grades 7-9: $2,672; 60% Grade 10: $3,058; 60% Grades 11-12: $4,580; 60% 75-80 British Columbia 614,671 63,321 (54,888) 9.27 (8.04) Category 1: $3,001; 50%; 72% of students in private sector Category 2 : $2,088; 35%; 15%
of students in private sector; Weighted average: $2,837
156
Source: Marois (2005).
Table 2: Public subsidy per student to Québec’s private schools by schooling level, selected years, in Canadian dollars
Year Kindergarten schools Primary schools Secondary schools College
1997-1998 2,275+82 2,092+82 2,919+122 NA 1998-1999 2,297+82 2,108+82 2,944+122 NA 2000-2001 2,496+85 2,292+85 3,179+122 NA 2002-2003 2,807+88 2,421+88 3,331+131 NA 2004-2005 3,006+93 2,582+93 3,556+139 5,271+514 2005-2006 3,064+95 2,808+95 3,612+142 NA
Note: The subsidy is based on teaching and non-teaching personel, other costs and location value of premises.
Source: Department of Education Leisure and Sports (MELS), Budgetary Rules for Schools under Agreement, annual.
Table 3: Sources of revenues of Québec’s public and private subsidized schools in percentage, by schooling level, 2004-2005
Revenues Primary and secondary
schools
Colleges Public sector
Subsidies 77 86
School taxes 14 -
Admission, registration and schooling fees - 3
Other revenues (gifts, profits from ancillary activities, etc.) 9 11 Private subsidized sector
Subsidies (including schooling ententes) 48 55
Admission, registration and schooling fees 28 30
Other revenues (gifts, profits from ancillary activities, etc.) 24 15 Source: Department of Education, Leisure and Sports (MELS), Statistics of Education, 2005, p. 231.
Table 4: Authorized and actual maximum schooling fees charged by Québec’s private schools, by education level, and school years 2003-04 and 2004-05
Level Year Maximum fee
according to regulation
Maximum fee asked
Number of schools with maximum fee
2003-2004 $2,886 $1,650 Kindergarten 2004-2005 $2,924 $1,679 1 out of 48 2003-2004 $2,488 $1,724 Primary 2004-2005 $2,518 $1,813 2 out of 72 2003-2004 $3,421 $2,122 Secondary 2004-2005 $3,464 $2,219 2 out of 142
Source: Department of Education, Leisure and Sports (MELS), Financial Reports of Subsidized Private Schools, and Budgetary Rules for Schools under Agreement, annual.
Table 5: Student enrollment in Québec’s public and private schools, by schooling level, and by school year, 1994-1995 to 2007-2008
Public schools Private schools
School
year Kindergarten Primary Secondary College Kindergarten Primary Secondary College 1994-95 1995-96 1996-97 1997-98 1998-99 1999-00 2000-01 2001-02 2002-03 2003-04 2004-05 2005-06 2006-07 2007-08 86,091 91,307 91,652 91,001 87,441 85,053 83,073 80,006 76,421 72,223 70,185 69,344 69,043 68,906 522,714 520,882 525,973 531,816 538,394 544,452 546,444 543.546 533,276 517,996 498,369 478,772 460,502 446,141 421,467 415,491 410,538 404,333 395,246 382,648 373,504 370,197 376,409 385,139 395,120 401,407 402,946 394,673 163,990 160,405 161,684 158,032 157,209 150,055 150,845 144,111 148,726 147,817 147,170 148,093 146,636 151,658 3,821 4,053 4,167 3,098 3,786 3,918 4,010 4,362 4,303 4,372 4,421 4,625 4,776 4,832 24,681 24,595 24,847 25,350 26,155 26,941 27,831 28,995 29,462 29,473 29,917 30,461 31,101 31,533 76,839 75,749 74,885 73,806 72,837 72,635 73,343 74,964 77,913 81,310 84,066 86,561 88,203 88,694 16,979 16,608 16,528 16,348 15,064 *12,074 *11,805 *11,606 *11,097 *10,381 *10,924 *10,834 *10,953 *12,045 Source: Department of Education, Leisure and Sports (MELS), Statistics of Education, annual.
Table 6: Number of students in primary and secondary public schools enrolled in particular pedagogical projects by type, 2004-2005
Type of program Number of students
Regular program with arts (designated or concentration) 12,882 Regular program with sports (designated or concentration)
International program
13,217 24,317
Regular program with computer science 2,681
Regular program with foreign languages 14,370
Regular program with sciences 2,518
Regular program with a diversified project 4,244
Alternative (non traditional) school 3,091
Total 77,320 Source: Higher Council of Education (2007) from the Department of Education, Leisure and Sports file on
students’ enrolment.
Table 7: Number of Transitions and Percentage of Total Number Transitions from Public to Private Schools, Québec, and cycles 1 to 6 of the NLSCY
Transitions by schooling level1 Number % of Total
In Primary School2,3 54 24
In Secondary School2,4 36 16
Between Primary and secondary 134 60
Total 224 100
Notes: 1 - Excludes the transitions from private to public schools (20 in all). 2 - Includes all children attending private schools for which we have no information on the type (Public/Private) of school attended in the previous school year. Otherwise the number of transitions is negligible in primary and secondary school (6 and 7 respectively). This excludes transitions from public to private schools between primary and secondary school. 3 - Primary school is defined as 2nd to 6th grade. 4 - Secondary school is defined as 7th to 10th grade.
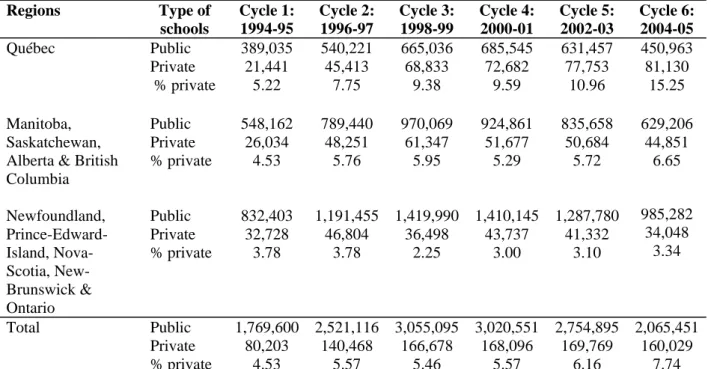
Table 8: Weighted number of primary and secondary school students in the public and private sectors by province and cycle of the NLSCY
Regions Type of schools Cycle 1: 1994-95 Cycle 2: 1996-97 Cycle 3: 1998-99 Cycle 4: 2000-01 Cycle 5: 2002-03 Cycle 6: 2004-05 Québec Public Private % private 389,035 21,441 5.22 540,221 45,413 7.75 665,036 68,833 9.38 685,545 72,682 9.59 631,457 77,753 10.96 450,963 81,130 15.25 Manitoba, Saskatchewan, Alberta & British Columbia Public Private % private 548,162 26,034 4.53 789,440 48,251 5.76 970,069 61,347 5.95 924,861 51,677 5.29 835,658 50,684 5.72 629,206 44,851 6.65 Newfoundland, Prince-Edward-Island, Nova-Scotia, New-Brunswick & Ontario Public Private % private 832,403 32,728 3.78 1,191,455 46,804 3.78 1,419,990 36,498 2.25 1,410,145 43,737 3.00 1,287,780 41,332 3.10 985,282 34,048 3.34 Total Public Private % private 1,769,600 80,203 4.53 2,521,116 140,468 5.57 3,055,095 166,678 5.46 3,020,551 168,096 5.57 2,754,895 169,769 6.16 2,065,451 160,029 7.74 Note: Students are weighted by their longitudinal weight in each cycle. Source: Author’s calculation from micro-data cycles 1 to 6 of the NLSCY.
Table 9: Estimated Effects of Private Schools on Children's Math Percentile Rank Score, 7- to 15-year-olds children from cycles 1 to 6 of the NLSCY
Variables OLS Fixed Effects Random Effects
Sample 1: All public and private schools children
Private School1 8.15 (1.91)*** 8.46 (1.88)*** 5.07 (2.05)** 5.05 (2.24)** 6.88 (1.61)*** 6.76 (1.68)*** Behavioral scores2 Hyperactivity - -3.83 (0.56)*** - 0.04 (0.65) - -2.61 (0.53)*** Anxiety - 1.03 (0.56)* - 1.31 (0.61)** - 1.05 (0.50)** Aggression - -1.62 (0.57)*** - -1.69 (0.61)*** - -1.79 (0.49)*** N (children) 4,403 (1,633) 3,885 (1,622) 4,403 (1,633) 3,885 (1,622) 4,403 (1,633) 3,885 (1,622)
Sample 2: End of primary to first secondary grades transitions only
Private School1 9.98 (2.73)*** 10.06 (2.83)*** 8.22 (2.53)** 10.46 (3.09)*** 8.62 (2.39)*** 9.06 (2.54)*** Behavioral scores2 Hyperactivity - -4.34 (0.95)*** - -1.76 (1.37) - -3.81 (0.94)*** Anxiety - 0.31 (0.93) - 1.27 (1.22) - 0.35 (0.88) Aggression - -2.75 (0.91)*** - 0.51 (1.36) - -2.37 (0.87)*** N (children) 1,562 (766) 1,281 (743) 1,562 (766) 1,281 (743) 1,562 (766) 1,281 (743) Notes: 1- Standard errors clustered on the individuals (child) in parentheses. Statistical significance: *p<0.10; **p<0.05; ***p<0.01. 2- Each behavioral score is centered on its mean and divided by its standard deviation for each cycle.
Table 10: Estimated Effects of Private Schools on Children's Math Standard Deviation Score, 7- to 15-year-olds children from cycles 1 to 6 of the NLSCY
Variables OLS Fixed Effects Random Effects
Sample 1: All public and private schools children
Private School 0.30 (0.07)*** 0.31 (0.06)*** 0.23 (0.07)** 0.22 (0.07)*** 0.27 (0.06)*** 0.26 (0.06)*** Hyperactivity - -0.13 (0.02)*** - 0.01 (0.02) - -0.09 (0.02)***
Anxiety - 0.04 (0.02)* - 0.05 (0.02)** - 0.04 (0.02)**
Aggression - -0.05 (0.02)*** - -0.06 (0.02)*** - -0.06 (0.02)*** Obs. (children) 4,403 (1,633) 3,885 (1,622) 4,403 (1,633) 3,885 (1,622) 4,403 (1,633) 3,885 (1,622)
Sample 2: End of primary to first secondary grades transitions only
Private School 0.35 (0.09)*** 0.35 (0.10)*** 0.31 (0.08)** 0.38 (0.10)*** 0.31 (0.08)*** 0.32 (0.09)** Hyperactivity - -0.15 (0.03)*** - -0.05 (0.04) - -0.13 (0.03)***
Anxiety - 0.02 (0.03) - 0.04 (0.04) - 0.02 (0.03)
Aggression - -0.10 (0.03)*** - 0.03 (0.04) - -0.08 (0.03)** Obs. (children) 1,562 (766) 1,281 (743) 1,562 (766) 1,281 (743) 1,562 (766) 1,281 (743)
Sample 3: End of primary to first secondary grades transitions less first and last 5% of the distribution
Private School 0.26 (0.08)*** 0.25 (0.08)*** 0.27 (0.11)** 0.27 (0.11)** 0.24 (0.07)*** 0.23 (0.08)** Hyperactivity - -0.10 (0.03)*** - -0.06 (0.04) - -0.10 (0.03)***
Anxiety - -0.01 (0.03) - 0.04 (0.04) - -0.01 (0.03)
Aggression - -0.07 (0.03)*** - 0.01 (0.04) - -0.07 (0.02)*** Obs. (children) 1,267 (621) 1,040 (602) 1,267 (621) 1,040 (602) 1,267 (621) 1,040 (602) Notes: 1- Standard errors clustered on the individuals (child) in parentheses. Statistical significance: *p<0.10; **p<0.05; ***p<0.01. 2- Each behavioral score is centered on its mean and divided by its standard deviation for each cycle. 3- Based on the score distribution of math scores centered on their mean and divided by their standard deviation for each test level and each cycle.
Table A1: Mean Characteristics of Children (7- to 15-year-olds), their PMK and Family by Cycle, overall sample (all children)
Characteristics Cycle 1: 1994-95 Cycle 2: 1996-97 Cycle 3: 1998-99 Cycle 4: 2000-01 Cycle 5: 2002-03 Cycle 6: 2004-05 Sample 242 531 513 1,042 1,171 904 Child Age in Months 115 ± 16 129 ± 22 137 ± 31 126 ± 28 132 ± 26 152 ± 19 Behavioral scores1 Hyperactivity 5.02 ± 3.94 4.09 ± 3.40 3.93 ± 3.33 3.63 ± 2.97 3.96 ± 2.93 3.60 ± 2.78 Anxiety 3.19 ± 2.92 3.20 ± 2.64 3.01 ± 2.60 2.94 ± 2.49 3.17 ± 2.52 3.06 ± 2.55 Aggression 1.38 ± 1.85 0.97 ± 1.67 0.97 ± 1.88 1.07 ± 1.76 1.14 ± 1.87 0.76 ± 1.46 Repeated her last grade2 0.09 [21] 0.05 [28] 0.05 [24] 0.06 [58] 0.06 [67] 0.04 [36] Changed school 0.22 [54] 0.13 [67] 0.13 [65] 0.14 [147] 0.13 [158] 0.11 [99] Is a girl 0.54 [130] 0.55 [292] 0.53 [270] 0.50 [518] 0.50 [583] 0.49 [443] Has a chronic condition 0.22 [54] 0.25 [132] 0.26 [135] 0.31 [325] 0.29 [335] 0.28 [251]
PMK 18 to 25 years old 0.23 [55] 0.22 [119] 0.24 [121] 0.21 [220] 0.22 [256] 0.21 [192] 26 to 30 years old 0.48 [115] 0.45 [237] 0.43 [221] 0.43 [448] 0.43 [500] 0.42 [383] 31 to 35 years old 0.25 [60] 0.27 [145] 0.27 [138] 0.29 [301] 0.28 [331] 0.29 [260] 36 to 40 years old 0.05 [12] 0.06 [30] 0.06 [33] 0.07 [73] 0.07 [84] 0.08 [69] Primary Education 0.21 [51] 0.20 [108] 0.17 [86] 0.13 [139] 0.13 [157] 0.13 [113] Secondary Diploma 0.24 [57] 0.21 [112] 0.18 [93] 0.20 [204] 0.20 [234] 0.20 [182] Post-secondary 0.27 [66] 0.22 [118] 0.24 [123] 0.23 [243] 0.25 [289] 0.24 [216] University Diploma 0.28 [68] 0.36 [193] 0.41 [211] 0.44 [456] 0.42 [491] 0.43 [393] Non-Immigrant 0.97 [235] 0.97 [516] 0.97 [496] 0.97 [1,012] 0.97 [1,131] 0.97 [873] Family
Family Functioning score 7.55 ± 5.49 7.63 ± 5.16 7.82 ± 4.60 8.19 ± 4.97 7.41 ± 4.94 7.26 ± 4.89 One Older Child3 0.36 [88] 0.37 [195] 0.33 [167] 0.33 [349] 0.35 [410] 0.34 [311] At least 2 Older Children 0.17 [41] 0.14 [76] 0.10 [51] 0.11 [112] 0.10 [115] 0.09 [85] At least 1 Younger Child 0.50 [121] 0.47 [247] 0.50 [259] 0.52 [546] 0.53 [622] 0.54 [491] Biological/adoptive parents 0.80 [194] 0.79 [419] 0.82 [421] 0.77 [902] 0.75 [878] 0.73 [660] Single parent 0.14 [34] 0.15 [77] 0.14 [74] 0.15 [155] 0.17 [199] 0.18 [161] Step parent 0.06 [14] 0.06 [32] 0.04 [21] 0.08 [80] 0.08 [88] 0.09 [78] Not a large City (<500 000) 0.82 [198] 0.74 [393] 0.73 [377] 0.71 [736] 0.71 [834] 0.72 [651] Family total income
(2001 $Canadian.) 52,400 ± 28,729 54,201 ± 32,832 63,717 ± 43,113 65,060 ± 42,108 64,208 ± 38,602 65,867 ± 38,942 Notes: 1- The interpretation of each behavioral score is similar: the higher the score, the more the child is afflicted by the problem the score represents. 2- Percentage of observations and number of observations in brackets. 3- Includes children of the same age.
Table A2: Mean Characteristics of Children (7- to 15-year-olds), their PMK and their Family by Cycle, restricted sample
Characteristics Cycle 1: 1994-95 Cycle 2: 1996-97 Cycle 3: 1998-99 Cycle 4: 2000-01 Cycle 5: 2002-03 Cycle 6: 2004-05 Sample 86 190 217 318 477 274 Child Age in Months 133 ± 6 145 ± 13 145 ± 15 144 ± 14 145 ± 16 163 ± 9 Behavioral scores1 Hyperactivity 4.51 ± 3.93 3.71 ± 3.01 3.53 ± 3.20 3.27 ± 2.58 3.55 ± 2.51 3.34 ± 2.50 Anxiety 3.24 ± 2.88 3.44 ± 2.89 3.22 ± 2.57 3.15 ± 2.48 2.98 ± 2.38 2.42 ± 2.27 Aggression 1.16 ± 1.55 0.91 ± 1.70 0.89 ± 1.71 0.82 ± 1.55 0.99 ± 1.80 0.54 ± 1.16 Repeated her last grade2 x3 0.05 [9] 0.04 [9] 0.06 [18] 0.07 [32] 0.05 [15] Changed school 0.21 [18] 0.11 [21] 0.11 [24] 0.13 [41] 0.13 [62] 0.07 [19] Is a girl 0.56 [48] 0.56 [106] 0.55 [119] 0.51 [161] 0.45 [217] 0.43 [119] Has a chronic condition 0.20 [17] 0.25 [48] 0.25 [55] 0.31 [99] 0.29 [137] 0.26 [71]
PMK 18 to 25 years old 0.23 [20] 0.23 [44] 0.24 [52] 0.22 [70] 0.20 [97] 0.19 [51] 26 to 30 years old 0.40 [34] 0.40 [76] 0.42 [92] 0.44 [139] 0.44 [210] 0.46 [125] 31 to 35 years old 0.30 [26] 0.29 [55] 0.28 [61] 0.30 [95] 0.29 [136] 0.27 [74] 36 to 40 years old 0.07 [6] 0.08 [15] 0.06 [12] 0.04 [14] 0.07 [34] 0.09 [24] Primary Education 0.19 [16] 0.21 [39] 0.19 [41] 0.13 [41] 0.13 [61] 0.13 [35] Secondary Diploma 0.27 [23] 0.21 [39] 0.19 [41] 0.20 [64] 0.19 [93] 0.19 [52] Post-secondary 0.27 [23] 0.25 [48] 0.25 [55] 0.24 [75] 0.25 [119] 0.26 [72] University Diploma 0.28 [24] 0.34 [64] 0.37 [80] 0.43 [138] 0.43 [204] 0.42 [115] Non-Immigrant 1.00 [86] 0.99 [189] 0.99 [214] 0.98 [312] 0.98 [467] 0.98 [268] Family
Family Functioning score 7.31 ± 5.37 8.02 ± 5.42 8.01 ± 4.30 8.12 ± 4.85 6.95 ± 4.78 7.21 ± 4.71 One Older Child4 0.36 [31] 0.35 [66] 0.34 [74] 0.35 [110] 0.33 [157] 0.33 [90] At least 2 Older Children 0.17 [15] 0.15 [28] 0.12 [26] 0.11 [34] 0.08 [38] 0.05 [15] At least 1 Younger Child 0.49 [42] 0.49 [94] 0.43 [93] 0.53 [167] 0.59 [281] 0.60 [165] Biological/Adoptive parents 0.80 [69] 0.80 [152] 0.83 [180] 0.78 [248] 0.75 [358] 0.72 [197] Single parent 0.20 [17] 0.15 [29] 0.14 [31] 0.14 [43] 0.18 [88] 0.21 [58] Step parent 0.07 [6] 0.05 [9] 0.03 [7] 0.08 [26] 0.07 [35] 0.07 [20] Not a large City (<500 000) 0.78 [67] 0.75 [143] 0.76 [165] 0.73 [232] 0.75 [356] 0.75 [206] Family total income
(2001 $Canadian) 50,063 ± 27,271 52,503 ± 29,533 63,865 ± 44,363 68,194 ± 46,337 64,337 ± 37,059 61,935 ± 34,088 Notes: 1- The interpretation of each behavioral score is similar: the higher the score, the more the child is afflicted by the problem the score represents. 2- Percentage of observations and number of observations in brackets. 3- An X corresponds to a cell with less than five observations. 4- Includes children of the same age.
Table A3: Mean Math Standardized Test Score by Age and Cycle, Québec Cycle 1: 1994-95 Cycle 2: 1996-97 Cycle 3: 1998-99 Cycle 4: 2000-01 Cycle 5: 2002-03 Cycle 6: 2004-05 Age of Children
Mean Score (Standard Deviation) [Number of observations]
7 year olds 324 (46) [35] 336 (49) [39] 313 (35) [54] 301 (40) [174] - - 8 year olds 365 (48) [59] 396 (47) [64] 368 (48) [88] 339 (52) [165] 346 (41) [194] - 9 year olds 429 (53) [47] 448 (56) [88] 395 (41) [13] 399 (59) [166] 386 (46) [244] - 10 year olds 496 (47) [53] 481 (48) [93] 474 (51) [59] 437 (54) [153] 427 (50) [175] 420 (54) [194] 11 year olds 531 (55) [48] 514 (56) [83] 498 (47) [61] 476 (55) [101] 468 (56) [168] 441 (49) [226] 12 year olds - 563 (60) [88] 527 (62) [83] 513 (52) [88] 500 (56) [141] 491 (68) [146] 13 year olds - 608 (77) [76] 535 (58) [49] 552 (73) [83] 533 (69) [95] 520 (70) [140] 14 year olds - - 640 (100) [56] 593 (102) [62] 575 (86) [80] 570 (88) [115] 15 year olds - - 669 (101) [50] 607 (92) [50] 631 (91) [74] 612 (91) [83] Source: Author’s calculation from the weighted transversal micro-data sets of the NLSCY, cycles 1 to 6.
Note: Number of observations in brackets
Table A4: Standardized math scores of high school students in public schools by grade in Québec and in the other provinces
Grade Québec Other provinces
1 2 3 4 All 514 549 595 639 559 477 515 572 600 531