HAL Id: hal-01864554
https://hal.archives-ouvertes.fr/hal-01864554
Submitted on 30 Aug 2018
HAL is a multi-disciplinary open access
archive for the deposit and dissemination of sci-entific research documents, whether they are pub-lished or not. The documents may come from teaching and research institutions in France or abroad, or from public or private research centers.
L’archive ouverte pluridisciplinaire HAL, est destinée au dépôt et à la diffusion de documents scientifiques de niveau recherche, publiés ou non, émanant des établissements d’enseignement et de recherche français ou étrangers, des laboratoires publics ou privés.
Revealing the Origins of Mechanically Induced
Fluorescence Changes in Organic Molecular Crystals
Liam Wilbraham, Marine Louis, Domenico Alberga, Arnaud Brosseau, Régis
Guillot, Fuyuki Ito, Frédéric Labat, Rémi Métivier, Clémence Allain, Ilaria
Ciofini
To cite this version:
Liam Wilbraham, Marine Louis, Domenico Alberga, Arnaud Brosseau, Régis Guillot, et al.. Revealing the Origins of Mechanically Induced Fluorescence Changes in Organic Molecular Crystals. Advanced Materials, Wiley-VCH Verlag, 2018, 30 (28), �10.1002/adma.201800817�. �hal-01864554�
1
Revealing the Origins of Mechanically-Induced Fluorescence Changes in Organic
Molecular Crystals
Liam Wilbraham,
a§Marine Louis,
b§Domenico Alberga
a, Arnaud Brosseau,
bRégis Guillot,
cFuyuki Ito,
dFrédéric Labat,
aRémi Métivier,
b*Clémence Allain,
b*Ilaria Ciofini
a*aPSL Research University, Institut de Recherche de Chimie Paris IRCP, CNRS – Chimie ParisTech, 11
rue Pierre et Marie Curie, F-75005 Paris, France
bPPSM, ENS Paris-Saclay, CNRS, Université Paris-Saclay, 94235 Cachan (France). c ICMMO, Univ. Paris-Sud, CNRS, Université Paris-Saclay, 91405 Orsay (France). d Dpt of Chemistry, Instit. Education, Shinshu University, Nagano 380-8455 (Japan).
§ Both authors contributed equally to this work: L. W. for the computational part and M. L. for the experimental part
ABSTRACT:
Mechanofluorochromic molecular materials display a change in fluorescence colour through mechanical stress. Complex structure-property relationships in both the crystalline and amorphous phases of these materials govern both the presence and strength of this behaviour, which is usually deemed the result of a mechanically-induced phase transition. However, the precise nature of the emitting species in each phase is often a matter of speculation, resulting from experimental data, which are difficult to interpret, and a lack of an acceptable theoretical model capable of capturing complex environmental effects. With a combined strategy using sophisticated experimental techniques and a new theoretical approach, here we show that the varied mechanofluorochromic behaviour of a series of difluoroboron diketonates is driven by the formation of low-energy exciton traps in the amorphous phase, with a limited number of traps giving rise to the full change in
fluorescence colour. Our results highlight intrinsic structural links between crystalline and amorphous phases, and how these may be exploited for further development of powerful mechanofluorochromic assemblies.
2 Mechanochromic materials are those in which a colour change is induced as a response to mechanical stress.[1,2] This stress may be applied through isotropic pressure, grinding, or shearing, and distinct responses to how stress is applied have been observed.[3,4] Analogous behaviour may also be observed for fluorescent materials, known as mechanofluorochromism.[5] These properties are closely tied to crystal structure, its influence on spectroscopic properties, and how these relationships change after the application of mechanical force. Although mechanofluorochromism has become an intensively studied property of molecular assemblies,[6-8] the microscopic processes that lie at its origin remain poorly understood, limiting the rational design of mechanofluorochromic molecules with properties tailored to real-world applications, such as anti-counterfeiting devices[9,10] and force sensing.[11,12]
First reported by Fraser et. al.,[13] difluoroboron diketonates (DFB, Figure 1) are among the most intensely studied classes of organic mechanofluorochromic materials.[14-18] These compounds often assume several crystalline polymorphs with distinct fluorescence properties and, in most cases, their mechanofluorochromic properties have been attributed to a phase transition between crystalline and amorphous phases.[19,20] Photophysical studies are used to uncover prevalent emitting species which, may occur from single molecules (monomers) or from two or more molecular units (excimers or aggregates).[21] Additionally, emission from either of these species may be predicated by long- or short-range energy transfer between adjacent molecules. These mechanisms are schematically represented in Figure 1a as pathways i, ii and iii, respectively. Assessing which of these is (are) the main emission pathway(s), while being the first step towards the design of new materials, remains tremendously complex if one must rely exclusively on experimental data. Structural explanations proposed for the associated fluorescence shift are based on the increased conformational freedom in the amorphous phase, which gives rise to emissive excimer species.[13,16,22] The formation of emissive multimers is also advocated to explain the fluorescence shift between molecules in solution and crystalline polymorphs.[23]
3
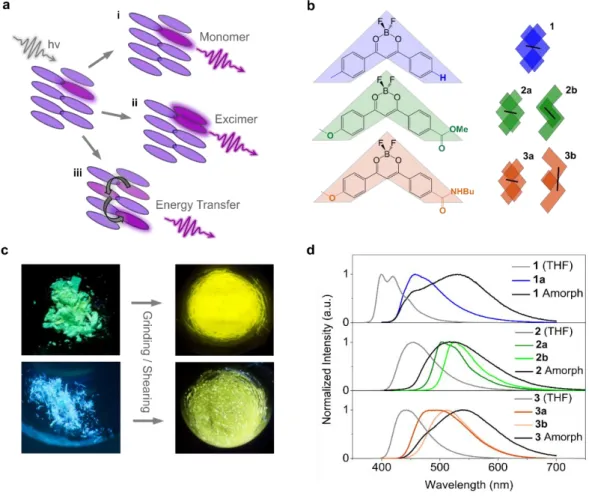
Figure 1. a) General schematic representation of potential emission mechanisms in organic molecular crystals. b) Molecular
structures of molecules 1-3 studied in this work, alongside schematic kite shapes depicting their stacking motifs present in both their respective crystalline polymorphs and dimer models used in all DFT calculations. Black lines emphasise differences in intermolecular distances. c) Photographs of crystalline powders and ground samples of 3 (top) and 1 (bottom). d) Experimental fluorescence spectra for solvated, isolated polymorphs, and amorphous phases of 1-3.
Creating pathways towards design requires insight into the highly correlated excited-state structure-property relationships that govern mechanofluorochromism. Up until this point, turning to theoretical approaches to study these connections has been impractical due to the inherent complexity associated with predicting amorphous phase properties, particularly at the excited state. Theoretical description of absorption and fluorescence requires computationally demanding quantum chemical approaches, therefore sampling a representative number of molecular configurations in the amorphous phase represents a tremendous computational investment. In this contribution, we use a dual theoretical-experimental approach that demonstrates how intelligent sampling of thermally accessible configurations in the crystalline phase leads to a remarkable reproduction of experimental amorphous-phase emission spectra. Coupled with an understanding of local order in the amorphous amorphous-phase and time-resolved optical spectroscopy, we take advantage of this computational technique to unravel complex
4 experimental results and to provide an understanding of amorphous-phase optical properties and therefore of key processes behind mechanofluorochromism.
Results and Discussion
Photophysical properties of compounds 1-3 (Figure 1b) recorded in solution (THF) are detailed in supporting information and summarized in Figure 1d.
Compound 2 assumes two different crystalline phases, as previously described:[22] one (2a) is monoclinic (P 21/n) and produces green fluorescence under 365 nm excitation and the other (2b) is
triclinic (P1̅) and produces yellow fluorescence. By contrast, for compound 1 we have only been able to isolate one polymorph with a blue-cyan fluorescence, which crystallizes in a triclinic (P1̅) space group. In the crystal, near-planar molecules are organized in anti-parallel pairs (see figure 1b and S184). The distance between two molecules (defined as the intermolecular distance between centroids) in a pair is 3.59 Å, with a strong overlap between the phenyl orbitals of stacked molecules. Concerning compound 3, the as- synthesized powder emits a green fluorescence under 365 nm excitation.
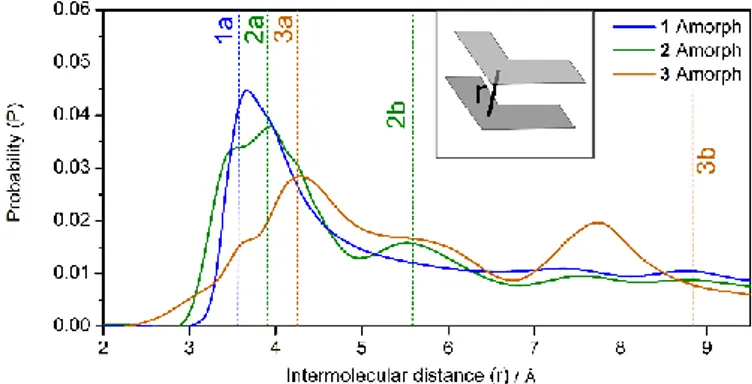
Figure 2. Computed Probability distribution of crystalline-like molecular pairs in the amorphous phase with a given
intermolecular distance r. Vertical dashed lines indicate the same value computed for each crystalline polymorph. The inset shows the intermolecular distance r, where molecules are represented by grey kite shapes.
We have been able to isolate single crystals suitable for X-Ray diffraction (space group P21/n) that emit
yellow fluorescence. Observation of the as-synthesized powder revealed that it is composed of green emitting chips in which tiny yellow emitting crystals are present (see figure S14). Manual sorting allowed us to successfully isolate enough green emitting chips to record a powder X-Ray diffractogram that confirms this green emitting phase (3a) is microcrystalline (figure S13), though space group determination was not possible . The yellow emitting crystalline polymorph (3b) shows slightly twisted
5 molecules organized in parallel pairs. The intermolecular distance between centers of mass of adjacent, π-stacked molecules is 8.80 Å, with a limited overlap between the methoxyphenyl group of one molecule and the benzamido group of the other.
Each crystalline polymorph structure was also described at the theoretical level providing structural properties similar to those observed (refer to SI for details). The amorphous phase of 1-3 was simulated using classical molecular dynamics (MD), starting with a completely random configuration of molecules to ensure its realistic representation. Specific details of the simulation are given in the supporting information. To identify common structural features between the resulting crystalline and amorphous phases, we analysed the distribution of pairs of molecules with crystalline-like structure in the amorphous phase, characterized by a given intermolecular distance (defined in the supporting information). In Figure 2, the resulting distances are plotted as a probability distribution and are compared with analogous distances computed for each of the corresponding crystalline polymorphs. It is striking that each polymorph possesses an inter-molecular distance that lies very close to the peaks of the probability distribution for the corresponding amorphous phase. Compound 1, which possesses one stable crystalline structure, produces a single distinct peak in the amorphous probability distribution while amorphous 2 and 3 yield two distinct probability peaks and each exhibit two stable crystalline polymorphs. While all of the polymorphs exhibit intermolecular π-stacking interactions, substitution of a bulkier ester group in 2 and the potential for hydrogen-bonding interactions in 3 leads to increased polymorphism and, subsequently, other distinct regions of crystalline-like local order in the amorphous phase. This indicates that a given amorphous material may inherit local structural properties from any available crystalline polymorphs, the structures of which are governed by the intermolecular interactions available to their constituent molecules. As will be discussed below, from a computational point of view, these observations have significant consequences when setting up models for the amorphous-phase photophysical properties.
The photophysical properties of 1-3 were studied in the powder state and their mechanochromic fluorescence was induced by mechanical grinding. In each case, a distinct red shift of the emission is observed after grinding (see Figure 1c and d) going from a blue (for 1) or a green (for 2 and 3) to a
6 yellow or orange emission. This corresponds to a spectral shift between 650 and 2410 cm-1, for 2 and
1, respectively. Powder X-Ray diffractograms recorded before and after grinding show that this
fluorescence shift corresponds to a crystalline to amorphous phase transition (see figure S12). In each case, fluorescence quantum yields were recorded on the crystalline powders, with values ranging from 0.38 (3) to 0.49 (1) and 0.75 (2), showing that all compounds are brightly fluorescent in the solid state.
To gain more insight, 1-3 were investigated by time-resolved fluorescence spectroscopy and by fluorescence microscopy coupled to atomic force microscopy (AFM).
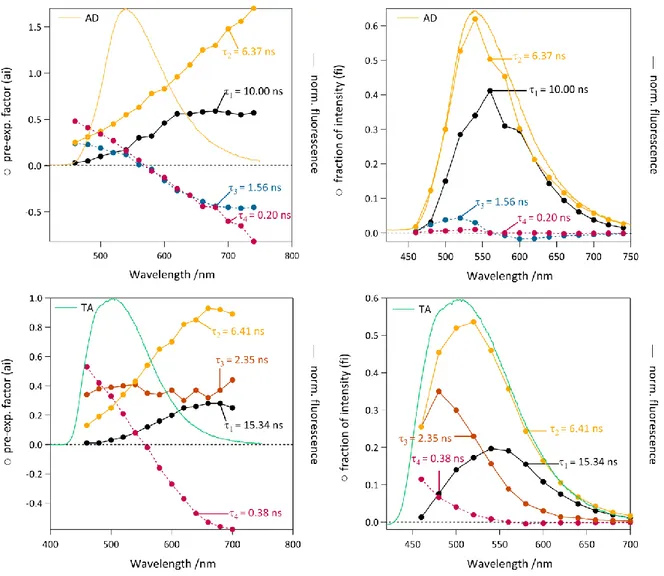
Figure 3. Four exponential decay analysis of 3 on glass, as deposited (AD, top) and after thermal annealing (TA, bottom).
Pre-exponential coefficients (left) and fraction of overall emission intensity (right) plotted as a function of emission wavelength. Each colour depicts a given contribution of a decay-time constant 1=10-15ns in black markers, 2=6.4ns in light orange markers, 3=1.6-2.4ns in grey or dark orange markers and 4=0.2-0.4ns in pink markers. Corresponding emission spectra are also shown for comparison.
Thin films were prepared on coverglass by the vacuum deposition method. After deposition, AFM images generally show that the films contain tiny crystals together with the amorphous phase and that
7 thermal annealing favours the growth of the crystals (see Figure S4 and S5 for AFM images together with Figure S2 and S3 for DSC analysis) with concomitant loss of the amorphous phase. Varying emission wavelength from 460 to 640 nm, fluorescence decays were recorded before and after thermal annealing and analysed by a global analysis procedure.
We detail here the case of compound 3. All fluorescence decays show a multiexponential behaviour (Figure 3). Four discrete exponentials were necessary to fit both AD (As Deposited) and TA (Thermally Annealed) samples: 1 (10-15 ns), 2 (6.4 ns), 3 (1.6-2.4 ns), and 4 (0.2-0.4 ns), indicative of the
inherent complexity of the analysis. The pre-exponential factor of the longest decay-time 1 increases
for the longest emission wavelengths and its contribution to the overall emission decreases after thermal annealing. It can thus be assigned to the amorphous phase. In the AD sample, this long decay-time 1
shows behaviour opposite to the intermediate decay-time 3, which is associated with positive
pre-exponential coefficients for short wavelengths but to negative pre-pre-exponential coefficients for long wavelengths (>560 nm). This evolution is characteristic of two decay-times associated to a single phase, for which an excited-state process (such as excimer formation or excitation energy transfer) occurs. The second couple of decay-time constants (2, 4) necessary to fit the decays can be similarly associated to
a single phase of the material where an excited-state process occurs. This corresponds to a crystalline phase where the excited-state process is faster than in the amorphous phase (4<3) due to better
structural organization of the molecules. This crystalline phase is marginally affected by the thermal annealing. In contrast, the contribution of the long decay-time (1=15 ns) decreases upon thermal
annealing, corresponding to the disappearance of the amorphous phase, while the intermediate decay-time 3 becomes longer (2.4 ns in the TA sample vs. 1.6 ns in the AD sample) with higher
pre-exponential coefficients all over the emission spectra. This is interpreted as the appearance of a second crystalline phase upon annealing, which can be described with a single decay-time (3 = 2.4 ns). Since
this appearance corresponds to a blue shift of the overall emission spectrum, we assign this decay-time to the green emitting crystals 3a. Analogous results have been found for 2 [22] and 1 (Figure S6). More sophisticated models, such as the use of stretched exponentials, have been tried to fit the decays by a global analysis without improvement of the quality of the fit. It is also worth noting here that due to the
8 weak spectral overlap between the absorption and emission spectra for the three compounds studied (Figure S8), reabsorption is unlikely to affect the fluorescence decays.
At this stage, the time-resolved data can be interpreted either in terms of excimer formation or in terms of excitation energy transfer between a monomer (donor) and a dimer preformed in the ground state (acceptor). To discriminate between these two processes, excitation spectra were recorded for the three compounds and proved to be similar for the three different emission wavelengths chosen (Figure S7), indicating that the same species is excited for different recorded emission signals (green or yellow). At the same time, steady-state anisotropy measurements performed on the thin films show significantly decreased anisotropy values compared to dissolved molecules in a highly viscous medium (Figure S9). Together, these observations indicate that, while direct energy transfer upon excitation does not seem to account for differences in fluorescence behaviour between phases, exciton migration between identical species (homo-FRET) cannot be excluded.
To better clarify the origin of mechanochromic fluorescence from a theoretical perspective, we must provide a means of describing fluorescence from both the crystalline and amorphous phases of a given molecular assembly. For the former, some of us recently developed a computationally affordable charge embedding scheme (SC-Ewald),[24-26] enabling the quantitative description of absorption and fluorescence behaviour in molecular crystals. This scheme approximates the electrostatic (Madelung) potential of the ground or excited state of the crystalline environment, which is then imposed onto a preselected, quantum mechanically (QM) described cluster. The quality of the Madelung potential produced by the charge fitting process is assessed at 1000 check-points randomly distributed around the cluster. In all cases, the rms difference between the direct-sum and crystalline (Ewald) potentials was less than 0.2 μV. Further reduction of this quantity yields no improvement on calculated emission properties. Details are provided in SI. Though a small benchmark was carried out for 1a, in all cases presented in the main text we used Density Functional Theory in conjunction with the range-separated hybrid functional CAM-B3LYP for the QM part due to (i) its reliable performance when modelling charge-transfer excitations and (ii) its stability with respect to the self-consistent charge adjustment procedure within SC-Ewald. Other functionals tested (ex. B3LYP or PBE0, Table S6) leads to
9 significantly underestimated emission energies. The molecular clusters investigated in this work are shown in Figure 1 and Figure S18. Due to previous reports of excimer formation in mechanofluorochromic molecular crystals,[4,13,27,28] we consider dimer clusters selected based on favourable intermolecular overlap ( stacking or hydrogen-bonding). For all crystalline polymorphs, the emissive state is a direct result of excimer formation, highlighted via the delocalisation of the exciton over two monomer units (Table S7). The formation of excimers is consistent with literature data[27,29,30] and the time-resolved fluorescence experiments described above.
Taking advantage of the local order present in the amorphous phase (Figure 2) and its similarity to crystalline structural motifs, we model fluorescence properties using a hybrid approach employing the ground-state classical MD simulations described above and excited-state calculations at ab-initio level. For the latter, we approximate the amorphous phase as a series of “defects” in the crystalline phase, inferring the probability of the presence of a given defect from MD simulations. This can be likened intuitively to an exploration of nearby higher-energy structures in the crystalline phase, which are only accessible after the application of an external force (in this case, mechanical shearing). Though one can imagine many possible crystalline defects, we limit ourselves to two degrees of freedom expected to be the most relevant for the recovery of spectroscopic properties of the amorphous phase (Figure 4d and Figure S17). We perform a geometrical scan by translating a single molecule within each polymorph along its average plane in directions parallel (Δx) and perpendicular (Δy) to its long-axis. In doing so, we obtain emission energies, intensities and stabilities of different structural defects in the crystalline phase relative to the equilibrium geometry found in each polymorph. The starting point for each scan is the excited-state equilibrium geometry of the crystalline phase. In Figure 4a-c, we show the results of this procedure via a series of surface plots that will be used to explain the origins of the colour change observed upon amorphization of 1, used to exemplify the procedure.
10
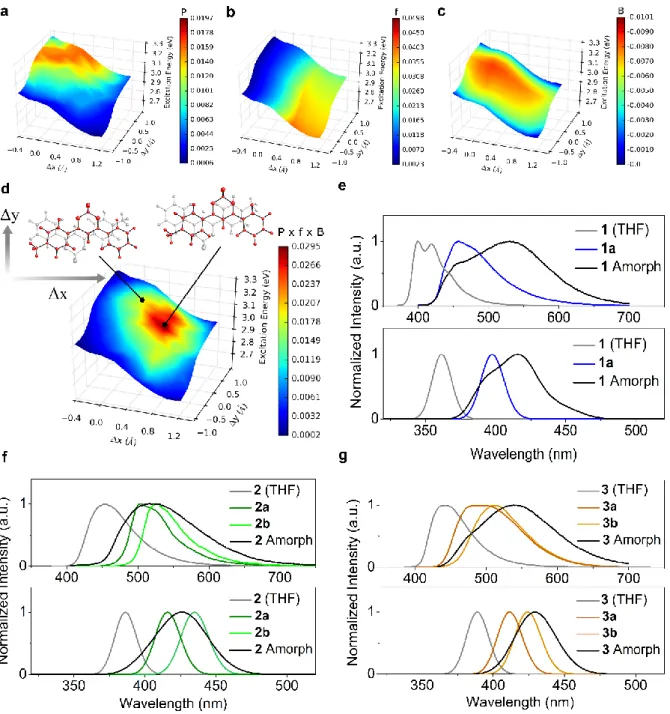
Figure 4.Surface plots of calculated emission energy of 1 with respect to the defect scan coordinates. For a given pair of molecules in the crystalline phase, one molecule (highlighted in red) is displaced along its average plane in directions parallel (Δx) and perpendicular (Δy) to its long axis. A colour scheme is mapped onto this surface, representing a) the probability to find a particular configuration in the amorphous phase, b) the oscillator strength, c) the Boltzmann factor and d) the normalized product of each of these, yielding the weighted oscillator strength. Red (blue) regions represent a greater (lesser) contribution of a given scan coordinate to the overall computed emission spectrum in the amorphous phase. Experimental (top) and computed (bottom) emission spectra for 1 (e), 2 (f) and 3 (g).
Figure 4a shows the probability of finding a pair of molecules in the amorphous phase at the same intermolecular distance r as the crystalline defect. In line with Figure 2, the highest-probability region is close to the excited-state equilibrium geometry of the crystalline phase. Figure 4b shows a similar
11 plot, where the colour map corresponds to the calculated oscillator strength, related to observed intensity, for each dimer configuration. Positive displacement along the Δx direction (long axis) results in an increased oscillator strength, attributed to the increased delocalisation of the exciton with more profound displacement. This effect is also reflected in the decreasing emission energy with increasing values of Δx. Figure 4c maps the Boltzmann factor, relative to the equilibrium crystalline geometry, of a given defect configuration at the excited state. As one might expect, the area of maximum probability surrounds the excited state equilibrium configuration in the crystal, although a distinct channel of higher-probability structures is evident along the Δx direction, indicating the presence of a slip plane. The aforementioned plots are combined to form Figure 4d, in which the product of the MD probabilities (P), oscillator strengths (f) and Boltzmann factors (B) are mapped onto the emission energy surface. In this plot, red (blue) areas indicate a large (small) contribution of a particular configuration to the overall amorphous-phase emission spectrum. Remarkably, the highest-contributing defect is not that of the excited state equilibrium configuration, but lies in a nearby region with lower emission energy. This represents the compensation of the excited-state configurations with slightly lower stability by the concomitant increase in oscillator strength of configurations with lower emission energy, resulting in a globally red-shifted emission maximum. We point to this counterintuitive effect as the reason for the drastic change in emission colour upon mechanical perturbation of the crystalline phase. These results represent the first computational evidence that weakly interacting planes can give rise to drastic mechanofluorochromic effects, in agreement with previous nanoindentation experiments performed on a similar crystal,[31] as well as the slipping of molecular columns used to explain mechanofluorochromism for inorganic molecular systems.[32]
Converting these results to spectral form and comparing with the corresponding experimental spectra reveals an impressive reproduction of the separation of the emission maxima in solution, crystalline and amorphous phases (Figure 4e). The amorphous experimental spectrum exhibits a shoulder at 396 nm that, due to its almost-perfect overlap with the crystalline emission spectrum, one might immediately attribute to leftover crystalline residue after smearing to form the amorphous phase. However, we show that the calculated emission spectrum of amorphous 1 captures this same feature, suggesting that this
12 shoulder is an intrinsic property of the amorphous phase and not a result of incomplete smearing of 1a crystals. Overall, despite the slight underestimation of the red shift and the reduced broadening of the emission spectrum compared to experiment, we are able to recover all of the salient features of the amorphous phase emission spectrum successfully. When coupled with the long rise times observed for the amorphous phase emission from time-resolved fluorescence spectroscopy, this computational evidence for small numbers crystalline-like defects giving rise to the overall amorphous phase emission properties is evocative of previous hypotheses[13] concerning the presence of low-energy emissive species, which essentially serve as exciton traps.
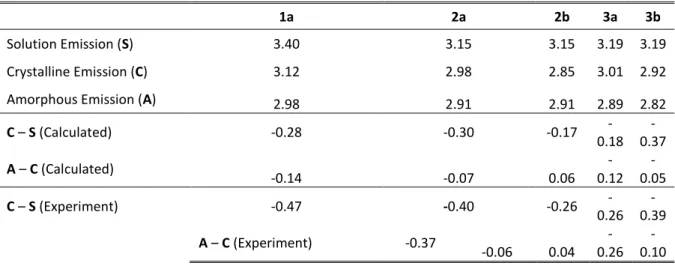
Table 1. Computed emission energies for 1-3 (in eV), comparing values obtained in solution, crystalline and simulated
amorphous phases. Shifts in emission (in eV) going from one phase to the next are also reported and are compared to corresponding experimental values.
1a 2a 2b 3a 3b
Solution Emission (S) 3.40 3.15 3.15 3.19 3.19
Crystalline Emission (C) 3.12 2.98 2.85 3.01 2.92
Amorphous Emission (A) 2.98 2.91 2.91 2.89 2.82
C – S (Calculated) -0.28 -0.30 -0.17 -0.18 -0.37 A – C (Calculated) -0.14 -0.07 0.06 -0.12 -0.05 C – S (Experiment) -0.47 -0.40 -0.26 -0.26 -0.39 A – C (Experiment) -0.37 -0.06 0.04 -0.26 -0.10
From Figure 4f-g and Table 1, the standard of the model is retained upon extension to 2 and 3. Considering the relative simplicity of the amorphous-phase model, the agreement with experimental differences between solution, crystalline and amorphous emission maxima values is of an impressive quality. For 2, modelling the amorphous phase emission appears more trivial as it represents a superposition of the two polymorph spectra. In our approach, this is the result of both an accurate evaluation of the excited-state stability of polymorph defects and their prevalence in the amorphous phase. The mechanofluorochromic behaviour of compound 3 is analogous to 1, resulting in a shift of the emission maximum to longer wavelength. The staggered stacking structure of 3 leads to a less dramatic mechanofluorochromic effect and the increased opportunity for hydrogen bonding interactions
13 in the case of 3 implies, contrary to 1, that there is an absence of weakly interacting planes, as was shown to be necessary for the more marked colour change observed for 1 via Figure 4c. Together, these results represent the first computational reproduction of the fluorescence properties of amorphous, crystalline and solvated phases of a given molecule at once.
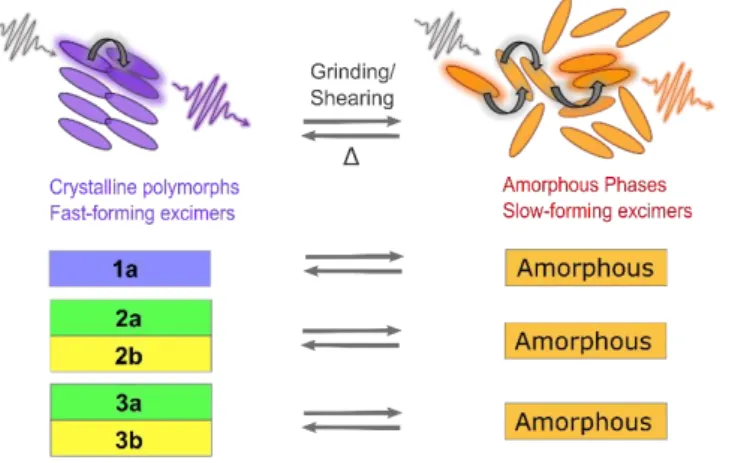
Figure 5. Fluorescence characteristics for each emitting phase of compounds 1-3. Coloured rectangles indicate the colour of
the crystalline or amorphous material. Scheme on the top outlines prevalent excited-state processes which give rise to different fluorescence wavelengths and decay-times, which ultimately result in mechanochromic behaviour.
We have presented an integrated experimental and theoretical approach for the description of mechanofluorochromic behaviour for a set of difluoroboron diketonate molecular materials. For each amorphous (crystalline) model, the reproduction of experimental behaviour arises from an understanding of the formation of low-energy excited states through excimer formation and energy transfer, as is shown schematically in Figure 5. This echoes previous experimental hypotheses suggesting that low-energy, excimer-based excited states are responsible for mechanofluorochromism,[13] although, to our knowledge, this work represents an unprecedented foundation for such a mechanism. What we observe from our model, alongside time-resolved fluorescence spectroscopy, suggests that small numbers of molecular configurations that resemble crystalline structural motifs are responsible for mechanochromic fluorescence, rather than a complete phase change to a different solid state form. Moreover, the strength of the mechanofluorochromic effect itself appears linked to the number of specific intermolecular interactions present in the solid state, with weaker slip planes bound mainly through van der Waals forces giving rise to more potent
14 mechanofluorochromic properties that are otherwise inhibited by specific intermolecular interactions such as hydrogen bonding. Naturally, this could lead to new concepts in the framework of molecular design. Indeed, combination of the present protocol with crystal engineering approaches able to target specific defects in molecular crystals [31, 33-35] may provide an innovative way to conceive new mechanofluorochromic materials.
Experimental and Computational Methods
Sample PreparationCompound 1 was synthesized with 73% overall yield by a Claisen condensation between 4-methylacetophenone and methylbenzoate followed by reaction with BF3.OEt2 in CH2Cl2. Similarly,
condensation between 4-methoxyacetophenone and dimethylterephthalate afforded 3-(4-(methoxycarbonyl)phenyl)-1-(4-methoxyphenyl)propane-1,3-dione that can be complexed with BF3.OEt2 to yield 2[22] or can undergo a saponification of the methyl ester function followed by a
peptidic coupling reaction with butylamine and a complexation with BF3.OEt2 to afford 3 (37% overall
over four steps). Full details and characterization are given in supporting information.
Optical Measurements
AFM images were acquired with a JPK AFM and controller (Nanowizard 3). The head of AFM was installed on inverted optical microscope. AFM images were recorded in the intermittent-contact (tapping) mode under ambient conditions. Silicon cantilevers (Nanosensors, PPPNCHR-20) were used with a nominal spring constant of 40 N.m−1, and a resonance frequency around 300 kHz. Image analysis was performed using the JPK software analysis. The fluorescence microscopy images were recorded on an inverted wide field fluorescence microscope (Nikon, TE 2000). The films were excited by Lumencor Spectra X lamps (working excitation wavelength 400 nm). The fluorescence signal was collected by a 60X Nikon CP objective. The fluorescence signal was separated from the excitation beam by a Semrock dichroic filter LF405 and directed to an EMCCD camera (iXon, Andor). All the images were processed through the Solis software.
Fluorescence decay curves were obtained by the time-correlated single-photon counting (TCSPC) method with a femtosecond laser excitation composed of a Titanium-Sapphire laser (Tsunami, Spectra-Physics) pumped by a doubled Nd:YVO4 laser (Millennia Xs, Spectra-Spectra-Physics). Light pulses at 780 nm
15 from the oscillator were selected by an acousto-optic crystal at a repetition rate of 4 MHz, and then doubled at 390 nm by a nonlinear crystal. Fluorescence photons were detected at 90° through a monochromator and a polarizer at magic angle by means of a Hamamatsu MCP R3809U photomultiplier, connected to a SPC-630 TCSPC module from Becker & Hickl. The fluorescence data were analyzed using the Globals software package developed at the Laboratory for Fluorescence Dynamics at the University of Illinois at Urbana−Champaign, which includes reconvolution analysis and global nonlinear least-squares minimization method.
Computation
All polymorphs of 1-3 were optimised using periodic boundary conditions using Crystal 14 and the B3LYP exchange-correlation functional. Fluorescence properties were calculated using Gaussian 09 and CAM-B3LYP exchange correlation functional in conjunction with the SC-Ewald change embedding method to model the crystalline environment. THF solvation effects were included with a conductor-like polarisable continuum model (CPCM) employed within the state-specific paradigm. Molecular Dynamics simulations were conducted using NAMD2.11, with molecules parametrised using the CGenFF force field and partial charges obtained using the restrained electrostatic potential (RESP) procedure. Further details (including relevant references) are included in the supporting information under ‘DFT calculations’.
Data availability
CCDC 1573649-1573650 contains the supplementary crystallographic data for this paper; copies of the data can be obtained free of charge from www.ccdc.cam.ac.uk/Community/Requestastructure. All the other data that support the findings of this study are available within Supplementary Information files.
Acknowledgements
The authors acknowledge financial support of this work by the European Research Council (ERC StG No 715757) and by the IDEX Paris-Saclay (Ph. D. fellowship to M.L.) I.C. received funding from the European Research Council (ERC) under the European Union’s Horizon 2020 research and innovation program (grant agreement No 648558, STRIGES CoG grant).
16
References
[1] D. A. Davis, A. Hamilton, J. Yang, L. D. Cremar, D. Van Gough, S. L. Potisek, M. T. Ong, P. V. Braun, T. J. Martínez, S. R.White, J. S. Moore, Nature 2009, 459, 68.
[2] R. W. Carpick, D. Y. Sasaki, A. R. Burns, Langmuir 2000, 16, 1270.
[3] K. Nagura, S. Saito, H. Yusa, H. Yamawaki, H. Fujihisa, H. Sato, Y. Shimoikeda, S. J.
Yamaguchi, J. Am. Chem. Soc. 2013, 135, 10322.
[4] L. Wang, K. Wang, B. Zou, K. Ye, H. Zhang, Y. Wang, Adv. Mater. 2015, 27, 2918.
[5] J. Xu, Z.Chi, Mechanochromic Fluorescent Materials: Phenomena, Materials and Applications,
The Royal Society of Chemistry 2014, p236.
[6] Z. Chi, X. Zhang, B. Xu, X. Zhou, C. Ma, Y. Zhang, S. Liu, J. Xu, Chem. Soc. Rev. 2012, 41,
3878.
[7] Y. Sagara, S. Yamane, M. Mitani, C. Weder, T. Kato, Adv. Mater. 2016, 28, 1073. [8] P. Xue, J. Ding, P. Wang, R. Lu, J. Mater. Chem. C 2016, 4, 6688.
[9] H. Sun, S. Liu, W. Lin, K. Y. Zhang, W. Lv, X. Huang, F. Huo, H. Yang, G. Jenkins, Q. Zhao,
W. Huang, Nature communications 2014, 5, 3601.
[10] X. Zhu, R. Liu, Y. Li, H. Huang, Q. Wang, D. Wang, X. Zhu, S. Liu, H. Zhu, Chem. Commun. 2014, 50, 12951.
[11] F. Cellini, S. Khapli, S. D. Peterson, M. Porfiri, Appl. Phys. Lett. 2014, 105, 061907.
[12] S. Bao, J. Li, K. I. Lee, S. Shao, J. Hao, B. Fei, J. H. Xin, ACS Appl. Mater. Interfaces 2013, 5, 4625.
[13] G. Zhang, J. Lu, M. Sabat, C. L. Fraser, J. Am. Chem. Soc. 2010, 132, 2160.
[14] N. D. Nguyen, G. Zhang, J. Lu, A. E. Sherman, C. L. Fraser, J. Mater. Chem. 2011, 21, 8409. [15] P. Galer, R. C. Korosec, M. Vidmar, B. Sket, J. Am. Chem. Soc. 2014, 136, 7383.
[16] W. A. Morris, T. Liu, C. L. Fraser, J. Mater. Chem. C 2015, 3, 352.
[17] T. Butler, W. A. Morris, J. Samonina-Kosicka, C. L. Fraser, ACS Appl. Mater. Interfaces 2016 8, 1242.
[18] S. Xu, R. E. Evans, T. Liu, G. Zhang, J. N. Demas, C. O. Trindle, C. L. Fraser, Inorg. Chem. 2013, 52, 3597.
[19] F. Ito, T. Sagawa, RSC Advances 2013, 3, 19785.
[20] T. Sagawa, F. Ito, A. Sakai, Y. Ogata, K. Tanaka, H. Ikeda, Photochem. Photobiol. Sci. 2016,
15, 420.
[21] M. Pope, C. E. Swenberg, Electronic Processes in Organic Crystals and Polymers, Oxford
University Press 1999.
[22] M. Louis, A. Brosseau, R. Guillot, F. Ito, C. Allain, R. Métivier, J. Phys. Chem. C 2017, 121, 15897.
[23] A. Sakai, E. Ohta, Y. Yoshimoto, M. Tanaka, Y. Matsui, K. Mizuno, H. Ikeda, H. Chem. Eur.
17 [24] L. Wilbraham, C. Adamo, F. Labat, I. Ciofini, J. Chem. Theory Comput. 2016, 12, 3316. [25] D. Presti, L. Wilbraham, C. Targa, F. Labat, A. Pedone, M. C. Menziani, I. Ciofini, C. Adamo,
J. Phys. Chem. C 2017, 121, 5747.
[26] S. E. Derenzo, M. K. Klintenberg, M. K., M. J. Weber, J. Chem. Phys. 2000, 112, 2074. [27] S. Guieu, J. Pinto, V. L. M. Silva, J. Rocha, A. M. S. Silva, Eur. J. Org. Chem. 2015, 3423. [28] T. Abe, T. Itakura, N. Ikeda, K. Shinozaki, Dalton Trans. 2009, 711.
[29] Q. Cao, S. Xiao, M. Mao, X. Chen, S. Wang, L. Li, K. Zou, J. Organomet. Chem. 2012, 717,
147.
[30] a) M. Koch, K. Perumal, O. Blacque, J. A. Garg, R. Saiganesh, S. Kabilan, Angew. Chem. Int.
Ed. 2014, 53, 6378. b) M. Koch, K. Perumal, O. Blacque, J. A. Garg, R. Saiganesh, S. Angew.
Chem. 2014, 126, 6496.
[31] G. Krishna, M. S. R. N. Kiran, C. L. Fraser, U. Ramamurty, C. M. Reddy, Adv. Funct. Mater.
2013, 23, 1422.
[32] H. Ito, T. Saito, N. Oshima, N. Kitamura, S. Ishizaka, Y. Hinatsu, M. Wakeshima, M. Kato, K. Tsuge, M. Sawamura, J. Am. Chem. Soc. 2008, 130, 10044.
[33] G. R. Krishna, R. Devarapalli, G. Lal, C. M. Reddy, J. Am. Chem. Soc. 2016, 138, 13561 [34] G. R. Krishna, R. Devarapalli, R. Prusty, T. Liu, C. L. Fraser, U. Ramamurty, C. M. Reddy,
IUCrJ 2015, 2, 611.
[35] S. Varughese, M.S.R.N. Kiran, U. Ramamurty, G. R. Desiraju, Angew. Chem. Int. Ed. 2013, 52, 2701.