Dielectric Spectroscopy as a probe for dynamic properties of compacted smectites
A. Cadène1, B. Rotenberg1, S. DurandVidal1, J.C. Badot2 and P. Turq11 Laboratoire Liquides Ioniques et Interfaces Chargées (UMR CNRS 7612), Université P. et M. Curie, 4 place Jussieu, 75252 Paris Cedex 05, France 2 Laboratoire de Chimie Appliquée de l'Etat Solide (UMR CNRS 7574), ENSCP, 11 rue P. et M. Curie, 75231 Paris Cedex 05, France Abstract The microdynamics of water and ions in two types of clays (montmorillonite and hectorite) was investigated with Broadband Dielectric Spectroscopy (40 Hz to 5 GHz). Four to five relaxations were observed depending on the relative humidity, the clay type and the nature of the compensating counterion (Na+ or Cs+). A tentative
assignment of the relaxations to physical mechanisms is proposed. keywords: smectite clay, ion, transport, dielectric spectroscopy Introduction Clay minerals, particularly montmorillonite, are considered as possible materials for waste storage, including the radioactive ions from the nuclear waste. The performance of the confinement critically depends on the transport properties of the ions inside the material. These properties are very sensitive to the hydration state of the clay, which is very low in the particular case (dry compacted clay). We used Broadband Dielectric Spectroscopy (BDS) in order to access the characteristic relaxation times related to ionic translation (individual or collective), and to dipolar rotation of water molecules. After presenting the systems and experimental procedures used in this study (section I), we will discuss the assignment of each relaxation frequency to
particular physical mechanisms. To achieve this assignment, we used two types of clays and two compensating counterions (no added salt), at two relative humidities (section II). Complementary informations were obtained through nonequilibrium measurements on a sample during drying (section III). The assignment of the relaxations is presented in section IV, and a conclusion is given.
I. Materials and Methods
Natural montmorillonite was obtained by purification of commercial bentonite MX80. The size fraction <2 µm was prepared by dispersion of 40g of bentonite in 1L of deionized water, followed by centrifugation at appropriate velocities in order to remove mineralogical impurities and redispersed in pH 5 water at 80°C under stirring for 12h. Na saturation of the montmorillonite suspension was carried out by dispersing the sediment in NaCl 101 mol.L1 solution, stirring for 12h (repeated twice), and repeated washing with deionized water until
complete removal of chloride anions is achieved (AgNO3 test). Cs exchanged montmorillonite was obtained by
reproducing the last steps, starting from the Na saturated clay, with CsCl instead of NaCl. Since no anions are present, no cations other than that balancing the structural charge of the clay sheets can be found in the sample. The resulting sample was then dried at 80°C for three days and crushed. The powder was then stored under dry atmosphere. The structure of the resulting material is (Sauzeat 2001): (Si7.96Al0.04)(Al3.1Mg0.56FeIII0.18FeII0.16)O20(OH)4M0.76 (with M=Na or Cs). The quality of purification was controlled
by Xray diffraction. Synthetic fluorohectorite was kindly provided by J. Breu, Inorganic Chemistry Laboratory, Bayreuth University, Germany. The structure of these clays is Si8(Mg5.2Li0.8)O20F4Na0.8 and their charge density is very close to that of natural montmorillonite (Breu 2003). The great advantage of such synthetic clays is that their charge density is very homogeneous. This results in a much better defined overall structure, especially upon hydration. Starting with a dry sample is a crucial point, since the high complexity of the smectite hydration mechanism
renders the reproducibility of the hydration step rather difficult. Indeed, the final state depends not only on the applied relative humidity (RH), but also on the initial hydration state. Berend showed that starting from the dry state (roughly one water molecule per cation), equilibration with an atmosphere of 43% RH and 85% RH leads mainly to a water monolayer and bilayer respectively (Berend 1991, Cases 1992). Dry samples were therefore introduced for 2 weeks in a closed chamber with a given RH, obtained by equilibration over a saturated solution (K2CO3 for 43% and KCl for 85%). The amounts of water adsorbed by the samples were controlled by
measuring the weight uptake. Results are summarized in table 1. The samples were then compacted to pellets with a diameter of 3mm and a thickness of 1mm, under a pressure of 700MPa. Electrical contact with the measurement cell was achieved by the presence of a thin layer of silver paint on each side of the sample; the solvent evaporates almost instantaneously, leaving a film of silver clusters (diameter approximately 50µm) on the surface of the sample. The relatively large size of the clusters together with the high evaporation rate of the solvent prevent the sample from contamination by the silver. The same cell was used for both low and high frequency measurements. The study of real and imaginary parts of the complex dielectric permittivity was performed in the frequency range of 40Hz to 5GHz with two different automatic devices (Badot 1992): ● 40Hz to 110MHz: LF impedance analyzer model Hewlett Packard HP4294A ● 45MHz to 5GHz: RF impedance analyzer model Hewlett Packard HP8510 The raw data were subsequently analyzed using an inhouse code. Deconvolution of the Argand and Bode diagrams leads to the number of relaxations and to the characteristic time and amplitude of each process. As an illustration of the deconvolution process, figure 1 shows the Argand diagram obtained with the Nahectorite sample equilibrated at 43% RH. In 1a, the whole diagram is shown, but only the slowest relaxation (R1) is visible, because of its much larger amplitude (compared to the others, see table 3). In order to distinguish the
other relaxations, one needs to proceed to the deconvolution of R1, using the ColeCole form of dielectric relaxation function (Badot 1992). The four faster relaxations are represented in 1b, together with the corresponding angular frequencies and the deconvoluted signal corresponding to each remaining relaxations (R2, R3, R4 and R5). Note the difference in scale between 1a and 1b. Although it is not obvious from figure 1a because of the scale used here, the line is a portion of circle. II. Equilibrium Measurements 1) Relative Humidity Figure 2 shows the evolution of the conductivity with frequency, for Na montmorillonite (MNa) at two relative humidities (43% and 85% RH) and for Cs montmorillonite (MCs) at 85% RH. Figure 2 reveals that conductivity increases with water content. The lowfrequency (100 Hz) conductivity is enhanced by two orders of magnitude, while at higher frequencies (GHz) the magnification factor is much smaller (approximately 2 to 10). This also holds for Na hectorite (HNa). More insight on the relation between water content and conductivity can be obtained by analyzing the frequency dependent permittivity (related to the complex conductivity through the relation iwhere w is the angular frequency) as explained in the previous section. For montmorillonite, the deconvolution process results in 5 distinct relaxations (labeled R1 to R5) whose characteristics are summarized in table 2. The results for hectorite with a similar charge density, summarized in table 3, show that for this solid only 4 relaxations are observed at 85% RH. Although it is difficult at this stage to assign each relaxation to a particular mechanism, we can make a tentative correlation between the water content and the number of observed relaxations. Indeed, structural studies (Cadène 2005) have shown that the interlayers of HNa at 43% RH consist exclusively of water monolayers, whereas only bilayers are present at 85%. Montmorillonite however is characterized by a high degree of inter
stratification, that is the simultaneous presence of mono and bilayers at 85% RH (Ferrage 2005). Therefore, we suggest that the five distinct relaxations are associated to the presence of water monolayers between the clay sheets (43% RH), while only four distinct relaxations are observed when water bilayers only are present (85% RH). We will discuss below the possible mechanisms for the relaxations, and try to explain the disappearance of one of them when going from mono to bilayer. 2) Counterion Figure 2 shows that at 85% RH, Cs montmorillonite is less conducting than its Na counterpart. This result also holds at 43% RH. Table 2 shows the influence of the counterion on the observed relaxations. For montmorillonite at 85% RH, results obtained with Na+ and Cs+ counterions are shown. Only monolayers are
present with Cs+, even at high RH. This is because the driving force for the crystalline swelling is the hydration
of the counterion, and cesium is not hydrophilic enough to induce the introduction of a second water layer between the clay sheets. Although it is known from molecular dynamics simulations and neutron diffusion experiments that the diffusion mechanism of Cs+ is very different from that of Na+ (Malikova 2005), there could
be an indirect influence of the nature of the compensating counterion on the conductivity, namely the equilibrium water content that it induces. As shown in figure 2, the conductivity of MCs at 85% RH is comparable to that of MNa at 43% RH, and both samples correspond to water monolayers.
3) Clay type
The influence of the clay type on the conductivity can be investigated by comparing the conductivity of montmorillonite and hectorite with the same counterion (Na+). As for montmorillonite, the conductivity of Na
hectorite increases with water content, and there is a clear correlation between water content and conductivity: at 43% RH HNa is slightly more conducting than MNa, while at 85% RH the conductivity of MNa is greater
than that of HNa (result not shown). Since water uptake measurements have shown that under an atmosphere with 43% RH, the water content of Na montmorillonite is slightly lower than that of Na hectorite with a similar charge density, while at 85% RH montmorillonite contains more water (table 1), we conclude that the clay type only affects the conductivity through its equilibrium water content, which in turn determines the conductivity. When the water content increases, the evolution of the first relaxation (R1) is the same for both montmorillonite and hectorite with Na counterion: its amplitude increases considerably, while its frequency hardly changes (see tables 2 and 3). The three following relaxations (R2, R3 and R4) show the opposite trend (both for montmorillonite and hectorite): their frequency increases by an average factor of 7, while their magnitude does not vary significantly (with the exception of R2 in hectorite). The uncertainties on the characteristics of the last relaxation (R5) are relatively high, for several reasons. First, from the principle of the deconvolution process, each relaxation is observed after “ substracting ” the contribution of the one occurring at lower frequencies (deconvolution). Therefore any inaccuracy affecting the latter will be transferred to the former. Second, the accessible frequency range covers only part of the frequency range associated to R5: our devices cannot produce signals beyond 5 GHz, and this shows that the frequency of R5 is larger than that (high) value. Nevertheless, this is enough to claim that R5 is likely to be related to the rotation of (polar) water molecules (see section IV). III. NonEquilibrium Measurements on a drying sample The link between the precise location of water and dielectric properties was further investigated by reproducing the previous experiments while drying a sample. A Na hectorite sample equilibrated at 85% RH was heated to 60 °C, and its dielectric response over the whole frequency range was measured at various times: first every 10 minutes, until 40 minutes after the beginning of the experiment, then every 30 minutes. The initial time t0 was taken to be 5 minutes after introduction of the sample in the measurement cell; the state of the sample at t0 is probably not that of the equilibrated sample, because in 5 minutes some water may have already evaporated.
The purpose of such a study is to follow the effect of water release on each relaxation. By maintaining a constant temperature, we discard any influence of the possible activation energies associated to the conduction mechanisms.
As expected from the equilibrium measurements (Section II), the conductivity decreases with time, that is with decreasing water content (see figure 3). The last curve is close to that obtained with a sample equilibrated at 43% RH and at 60°C, also represented on this figure. However, the decrease in the lowfrequency conductivity (< 105 Hz) is already significant from the early stages of dehydration, while the highfrequency conductivity (>
108 Hz) appears to occur only after some time (t
0+40 min). This trend is confirmed by the study of the
characteristic frequencies and amplitudes as a function of time, summarized in table 4. This table also shows that only four relaxations are observed until t0+40, but five distinct relaxations are seen for later stages of
dehydration. As was mentioned in section II, four relaxations correspond to water bilayers, and a fifth is observed when monolayers are present. Thus the present experiment speaks in favor of a two steps dehydration process: first the porewater from general pores leaves the sample, then the interstitial water is evaporated (bi to monolayer). IV.Relaxation Mechanisms Each relaxation corresponds to a particular microscopic mechanism. Possible mechanisms include (see figure 4): (i) reorientation of polar molecules (like water), (ii) formation of induced dipoles by displacements of charge carriers (like ions). In the former case, the characteristic frequency will depend mainly on the environment of the molecules, and the amplitude on the number of molecules with a given environment. In the latter case, the motion of charge carriers can occur over various length scales, and the corresponding frequencies vary accordingly. We now want to discuss the possibility of assigning a mechanism to each observed relaxation. Relevant information can be obtained by studying: (i) the orders of magnitude of the frequencies, (i) the
corresponding amplitudes, (iii) the variations with water content and with counterion. The characteristic frequency of R5 is slightly lower than that of bulk water (18 GHz, see Buchner 1999) and independent of the sample. In confined materials like clays, the rotation of water molecules is hindered, so that its characteristic frequency is expected to be lower than for “free” water. At the other extreme, the magnitude and the low frequency of R1 suggest that it is related to “grain polarization”, that is the formation of induced dipoles by the motion of counterions along the clay sheets, leading to charge separations at the hundreds of nanometers scale. Furthermore, the large increase of the magnitude with water content can be traced back to the greater mobility of cations in the interlayer at higher water content, and thus easier fluctuations of the charge density. The fact that the lowfrequency conductivity decreases when the general porewater leaves the sample, while the highfrequency conductivity hardly decreases at that stage, is consistent with that microscopic interpretation of R1. The assignment of the intermediate relaxations is more problematic. We have shown (Rotenberg 2005) that the frequency of R4 is consistent with charge fluctuations developing at the nanometer scale, that is the typical distance between ions in the interlayer (or equivalently, between the structural charges within the sheets). Indeed, that distance is roughly 0.8 nm in montmorillonite, and the diffusion coefficient of Na is approximately 5 1011 m2s1 in a water monolayer, and one order of magnitude larger in a water bilayer (Marry 2002). Thus, the time it takes for an ion to diffuse to the next charged site is typically τ ~ L2/D = 10 ns, or in terms of frequency 108 Hz, which is the correct order of magnitude. For more details, the reader can refer to (Rotenberg 2005). QuasiElastic Neutron Scattering Experiments (QENS) have shown that there are in fact two types of water in the sample, with two distinct dynamics (Cadène 2005). These two types could be either (a) water in the interlayers and water in the pores, or (b) water solvating cations and water not belonging to the cation's solvation shell. If R5 corresponds to “free” water, then the other type of water should have a lower characteristic frequency. If in addition R4 is attributed to local ionic motion, then the relaxation corresponding to the “bound”
water is either R2 or R3. An interesting feature of R3 is that it is not present in Nahectorite at high water content. Furthermore it disappears upon drying of a highly hydrated sample (table 4). Given the precision of the measurements, we cannot tell whether the physical mechanism leading to R3 is not present in that case, or if it occurs at a higher frequency, making it difficult to distinguish from R4. Therefore it is difficult to give a definitive answer for R2 and R3. A possible mechanism for explaining the remaining relaxation is the ionic adsorption/desorption exchange at the clay surface. The consequences of such an exchange on the dielectric properties were discussed in (Rotenberg 2005), but we have not enough experimental evidences to conclude that it corresponds indeed to one of the observed relaxations. Conclusion Broadband Dielectric Spectroscopy was used to study the nano and microdynamics of ions and water in clays at low water content. Mechanisms were suggested to interpret the observed dielectric relaxations, relying on results obtained by varying the clay type (montmorillonite and hectorite), the compensating counterion (Na+
and Cs+) and the relative humidity. Complementary informations were obtained with nonequilibrium
measurements on a drying sample. QuasiElastic Neutron Scattering and Molecular Dynamics simulation results from the literature were also used as a guide for interpreting the experimental results. We hope that more insight on the water dynamics will be gained from Nuclear Magnetic Resonance experiments, in order to verify the validity of the mechanisms proposed in this paper. Corresponding collaborations have been started. Acknowledgments The authors acknowledge financial support of Groupement de Recherches PARIS. B.R. acknowledges financial support of the Ecole Normale Supérieure de Paris (ENS) and the Agence Nationale pour la gestion des Déchets
Radioactifs (ANDRA). References
Badot JC, Baffier N, 1992. J. Mater. Chem. 2, 1167.
Bérend I, 1991. Les Mécanismes d'hydratation de montmorillonites homoioniques pour des pressions relatives inférieures à 0.95, Ph. D. thesis (in French), Institut National Polytechnique de Lorraine, France. Cases JM, Bérend I, Besson G, Francois M, Uriot JP, Thomas F, Poirier JE, 1992. Langmuir 8, 2730. Breu J, Seidl W, Stoll A, 2003. Zeit. Anorg. Allg. Chem. 629, 503. Buchner R, Barthel J, Stauber J, 1999. Chem. Phys. Lett. 306, 57. Cadène A, Etude expérimentale multiéchelle du transport ionique et aqueux en milieu poreux chargé: argiles, Ph. D. Thesis (in French), Université P. et M. Curie, Paris France (oct. 2005). Ferrage E, Lanson B, Malikova N, Plançon A, Sakharov BA, Drits VA, 2005. Chem. Mater. 17, 3499. Malikova N, Cadène A, Marry V, Dubois E, Turq P, Zanotti JM, Longeville S, 2005. Chem. Phys., in press. Marry V, Turq P, Cartailler T, Levesque D, 2002. J. Chem. Phys. 117, 3454. Rotenberg B, Cadène A, Dufrêche JF, DurandVidal S, Badot JC, Turq P, 2005. J. Phys. Chem. B, 109, 15548. Sauzeat E, Guillaume D, Neaman A, Peiffert C, Ruck R, Dubessy J, Cathelineau M, Villiéras F, Yvon J, 2001. MX80: Une référence méthodologique pour l'ANDRA, Note technique ANDRA (in French).
m (g H20/g dry clay)
Montmorillonite Na 43% RH
0.0458
Montmorillonite Na 85% RH
0.1656
Montmorillonite Cs 85% RH
0.1163
Hectorite Na 43% RH
0.0745
Hectorite Na 85% RH
0.1307
Table 1: Amounts of absorbed water, starting from dry samples.R1
R2
R3 R4 R5
f
∆ε
f
∆ε
f
∆ε
f
∆ε
f
∆ε
Na 43%
1.6E3 5.9E4 1.4E6 4.9E1 1.4E7 2.6E1 2.1E8 1.0E1 1.5E10 4.9E0Na 85%
1.5E3 1.4E6 7.2E6 6.6E1 8.5E7 2.6E1 3.6E8 1.4E1 8.9E9 4.3E0Cs 85%
2.9E3 8.6E4 1.7E6 3.1E1 1.6E7 1.1E1 1.5E8 3.6E0 4.0E10 5.0E0Table 2: Relaxation frequencies and amplitudes for montmorillonite, with varying relative humidity and counterion. Frequencies (f) are in Hz, and amplitudes () are dimensionless.
R1
R2
R3 R4 R5
f
∆ε
f
∆ε
f
∆ε
f
∆ε
f
∆ε
Na 43%
3.4E3 3.3E4 6.6E6 3.4E1 5.3E7 1.6E1 3.2E8 5.5E0 3.2E9 1.3E0Na 85%
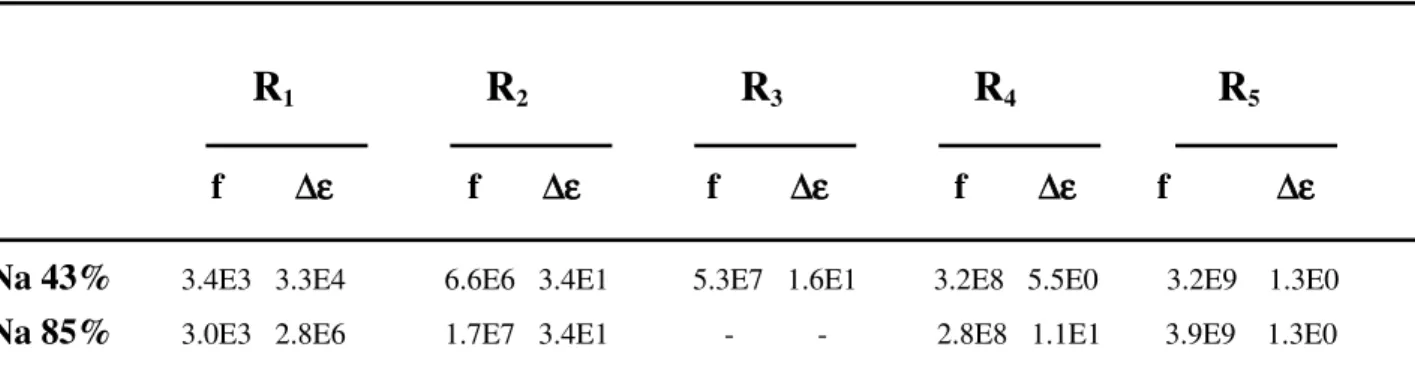
3.0E3 2.8E6 1.7E7 3.4E1 2.8E8 1.1E1 3.9E9 1.3E0Table 3: Relaxation frequencies and amplitudes for hectorite, with varying relative humidity. Frequencies (f) are in Hz, and amplitudes () are dimensionless.
R1
R2
R3
R4
R5
f
∆εf
∆ε
f
∆ε
f
∆ε
f
∆ε
t0
2.4E4 6.3E4 4.6E7 3.1E1 5.2E8 7.2E0 2.8E9 1.3E0t+10
4.4E4 4.2E4 5.3E7 3.4E1 7.7E8 6.1E0 5.3E9 6.0E1t+20
2.8E4 4.5E4 5.6E7 3.2E1 7.1E8 4.7E0 2.9E9 5.9E0t+30
2.6E4 4.1E4 5.1E7 2.9E1 5.8E8 5.9E0 3.9E9 4.9E0t+40
2.2E4 4.2E4 6.4E7 3.0E1 8.2E8 3.6E0 6.7E9 6.1E0t+70
1.6E4 4.5E4 2.4E7 4.1E1 2.1E8 4.3E0 2.8E8 1.1E1 3.0E9 1.4E0t+100
1.2E4 4.4E4 2.2E7 2.8E1 1.9E8 2.7E0 2.8E8 1.1E1 4.5E9 1.5E0 t+130 8.0E3 4.1E4 1.6E7 3.9E1 1.6E8 3.0E0 2.5E8 1.0E1 2.5E9 6.2E1 Table 4: Relaxation frequencies and amplitudes for a dehydrating Na hectorite, at various times (see text). Frequencies (f) are in Hz, and amplitudes () are dimensionless. Note that a fifth relaxation appears after t+70. CaptionsFigure 1: Argand plot (imaginary part vs. real part of the complex permittivity) for Nahectorite at 43% relative humidity: (a) on the whole experimental curve, only one relaxation (R1) is visible; (b) substraction of its contribution reveals the four remaining relaxations (note the difference in scale). Crosses denote the experimental data, and the continuous lines the contribution of each relaxation. The characteristic frequencies are also indicated (in Hz).
Figure 2: Frequencydependent conductivity for montmorillonite with varying relative humidity and counter ion.
Figure 3: Frequencydependent conductivity for a drying sample of Nahectorite at 60°C.
Figure 4: Schematic view of the proposed relaxation mechanisms. At the highest frequencies (R5)