HAL Id: hal-02444566
https://hal.archives-ouvertes.fr/hal-02444566
Submitted on 27 Apr 2021HAL is a multi-disciplinary open access archive for the deposit and dissemination of sci-entific research documents, whether they are pub-lished or not. The documents may come from teaching and research institutions in France or abroad, or from public or private research centers.
L’archive ouverte pluridisciplinaire HAL, est destinée au dépôt et à la diffusion de documents scientifiques de niveau recherche, publiés ou non, émanant des établissements d’enseignement et de recherche français ou étrangers, des laboratoires publics ou privés.
Multi-Scale Methods for the Analysis of Creep-Damage
Coupling in Concrete
Mounia Farah, Jacqueline Saliba, Frédéric Grondin, Ahmed Loukili
To cite this version:
Mounia Farah, Jacqueline Saliba, Frédéric Grondin, Ahmed Loukili. Multi-Scale Methods for the Anal-ysis of Creep-Damage Coupling in Concrete. Advances in Multi-Physics and Multi-Scale Couplings in Geo-Environmental Mechanics, Elsevier, pp.205-241, 2018, �10.1016/B978-1-78548-278-6.50007-4�. �hal-02444566�
Multi-Scale Methods for the Analysis
of Creep-Damage Coupling in Concrete
The determination of the delayed behavior of concrete structures is of major interest in structure design because creep deformations could be at the origin of cracking. In order to quantify the damage occurring in concrete under creep, the acoustic emission (AE) technique was used. Quantitative analysis of the AE data was performed and characteristics of micro-mechanisms were evaluated and associated to two clusters for basic creep and three clusters for desiccation creep. According to several studies, the viscoelastic behavior of concrete is strongly linked to the main hydrates of the cement paste which could deform under the constant load and restraint of other components. A mesoscopic model has been developed in order to describe the fracture process and the corresponding effect of concrete heterogeneities under creep. It was observed that under tensile creep, damage induced at the moment of load application increases due to strain incompatibilities between the mortar and aggregates and causes a strength decrease. Similar observations were obtained with the AE technique.
7.1. Introduction
In civil engineering, the control of creep has a major role in concrete structure design. Indeed, the viscoelasticity of concrete leads to delayed deformations which could be at the origin of cracking in structures [OMA 09]. So, these delayed strains have an impact on their safety margin and life time, especially when they are subjected to high loads. For example, underground concrete structures and other infrastructures undergo, during the construction phase, load due to soil pressure, which leads to important creep deformations.
According to several studies, the viscoelastic behavior of concrete is strongly linked to the main hydrates of the cement paste (C-S-H) which could deform under a constant load [BAZ 88]. The magnitude of these deformations is very significant in the cement paste of hardening concrete [BRI 11]. Also, some theories suggested that micro-cracks nucleate and grow when concrete is subjected to a high sustained loading [BAR 05, BAZ 97b, ROS 94], which makes the concrete weaker. Thus, it is important to understand the interaction between viscoelastic deformation and damage in order to design reliable civil engineering structures with reference to delayed strains and residual strength.
The study of tensile creep has shown different effects on the behavior of concrete with sometimes some contradiction. On one hand, creep may relax internal tensile stresses generated by restrained shrinkage, by increasing the deformation capacity to the failure and consequently reducing the risk of potential cracking in concrete [ALT 03, BIS 00]. On the other hand, the main mechanism of tensile creep is due to the micro-cracks development, which could be responsible of the decrease of the residual strength and the modification of concrete’s properties [COO 74, ROS 94]. In order to enhance the current knowledge of creep mechanisms of concrete, it is interesting to study the creep response and phenomena occurring at the component level. Concrete can be properly represented by three phases in the microstructure: cement paste, aggregate and the interfacial transition zone (ITZ) between them [XIA 13, ZIM 85].
To examine this, an experimental investigation on mortar and concrete beams has been realized to study how aggregates influence the mechanical properties and damage behavior of concrete under creep. The acoustic emission (AE) technique was applied simultaneously to monitor damage evolution during the failure flexural tests of concrete and mortar beams. This non-destructive technique proves to be very effective, especially to check and measure micro-cracking that takes place inside a structure under a mechanical loading [ALA 14, DEN 06, SAL 12a, SAL 12b, SAL 12c].
The use of classical creep models [BAZ 89, DES 99] to simulate the macroscopic viscoelastic deformation of concrete structures requires the calibration of viscoelastic parameters based on experimental measurements. This leads to select values allowing to find the measured strain. However, the part of the “hidden” damage in the experimental response is neglected. It appears therefore necessary to determine the viscoelastic parameters of concrete components by another method in order to take into account the part of damage [SAL 13]. The coupling of a linear viscoelastic model with a damage model at the mesoscopic scale may allow for the characterization of damage evolution during creep and its influence on the global behavior.
The following section presents experimental observations for flexural creep tests on concrete under high level loadings. Analyseswere made with the AE technique. Then, in section 7.3, models are presented to show the coupling between the viscoelasticity and damage at different scales. A study at early ages is performed to show the competiveness between the sustained load and the strength increase. 7.2. Experimental methods for the identification of creep-damage coupling in concrete
7.2.1. State-of-the-art of creep analysis of cementitious materials Deformation and fracture of concrete are associated with very complicated progressive failure. Creep strains are directly related to stresses and micro-cracks in concrete. Thus, understanding the behavior of concrete requires the detailed assessment of creep and the part of damage. For stress levels below 40% of the compressive strength, creep strains are proportional to stress and creep coefficients can be described using a formulation independent of the stress. It is assumed that linear visco-elasticity takes place and the instantaneous mechanical behavior of concrete remains elastic. For high stress levels, this linearity is lost and the creep coefficient is no longer independent of the stress. Micro-cracks, initiated by the local stress, develop and interact with the viscoelasticity [MAZ 02]; deviation of the linearity of the mechanical response may occur and nonlinear creep occurs [BAZ 97b, FRE 58, MAS 95, MAZ 02]. Finally, for stress levels above 70% of the maximum strength, cracks propagate quickly and lead to failure (tertiary creep). In fact, micro-cracking may initiate at the moment of load application and begins to grow to form a time-dependent crack path [BAZ 92, MEY 69]. The effects of tensile creep could be divided into beneficial and detrimental effects due on one hand to the relaxation of the stresses generated by autogenous shrinkage and thermal dilation at early ages [ALT 03, BIS 95] and on the second hand to micro-cracking [COO 74]. In most cases, structures are loaded by efforts of low intensity, relatively to material strength (<30% of the strength). For these loading levels, maintained constant, it is considered that concrete is not damaged and creep remains linear [GAR 09, RAN 13, SAL 12b]. Usually, creep mechanisms are associated with the hydrated cement paste and can be considered as material properties. Micro-cracking is an apparent creep mechanism that can also contribute to the observed deformation and is responsible of the permanent deformation.
A number of studies investigated the effects of creep loading history on the failure mechanisms, including its influence on strength, stiffness and fracture energy. Most of these studies tried to quantify the effect of creep on the behavior of concrete mainly by measuring the residual strength [CAR 97, COO 74, DEN 06, LIN 87, OMA 09, SHA 70]. Recently, in order to quantify the part of damage
occurring in concrete under creep, the AE technique was used [ROS 12, SAL 12a]. This technique is a non-destructive testing method increasingly used in the determination of structural changes in relation with local phenomena [GRA 07, HAI 05, MIH 96, OTS 00].
7.2.2. Measurement of the residual strength of concrete after creep
7.2.2.1. Case of the basic creep
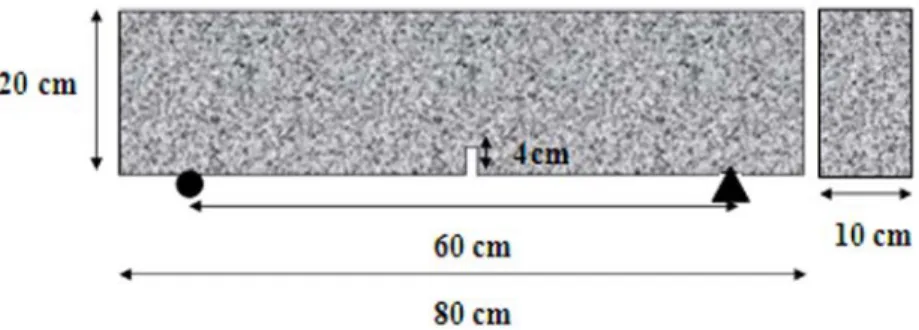
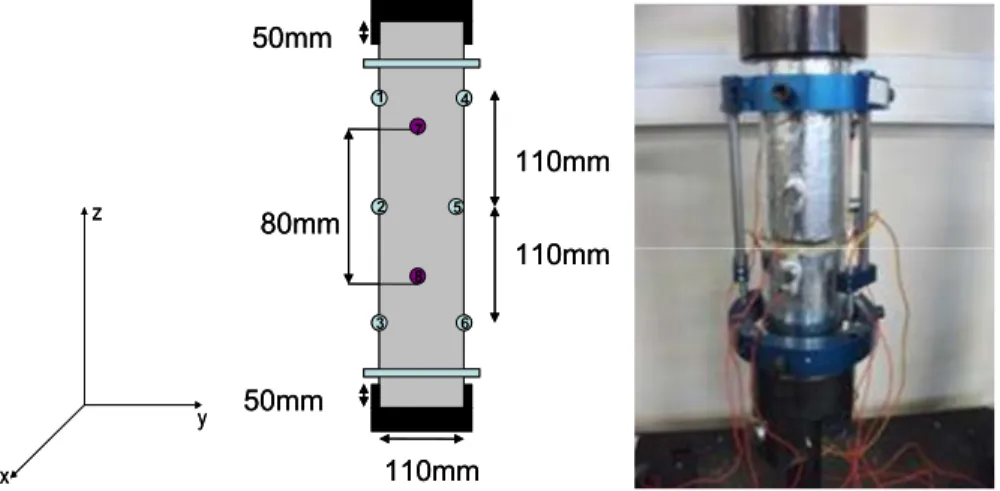
Basic creep tests were first realized on mortar and concrete beams under flexural creep loading (Figure 7.1) at high stress levels (70% and 85% of the maximal strength Fmax). Concrete specimens were mixed with Portland cement CPA-CEMII
42.5, crushed limestone aggregate distributed in fine sand, with a maximum size of 5 mm and a density of 2570 kg/m3 and crushed gravel of size 5–12.5 mm with a
density of 2620 kg/m3. A super plasticizer agent (Glenium 27) has been added for
the workability shows the mix quantities of constituent materials.
Figure 7.1. Geometry of concrete and mortar beams for flexural creep tests Components Dosage (Kg/m3)
Gravel: G5/12.5 mm 936.0 Sand: 0/5 mm 780.0 Portland Cement: CEMII 42.5 350.0
Water 219.5
Superplasticizer 1.9
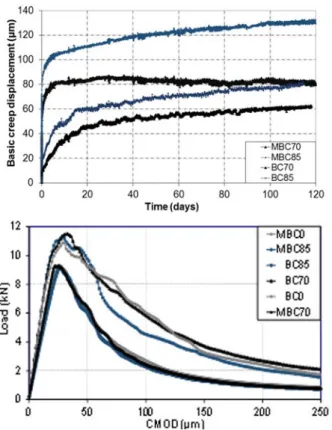
The influence of creep on the residual strength and fracture energy has been studied by submitting the beams loaded previously under flexural creep to further loadings until failure (Figure 7.2). This figure gives the results of aging and loaded concrete beams on basic creep at 70% and 85% of the maximal load (BC0, BC70 and BC85), respectively, the aging and loaded mortar beams on basic creep (MBC0, MBC70 and MBC85). Results show that basic creep displacement is more important for mortar beams; the lower displacement of concrete beams could be due to the presence of aggregates that restrained creep deformation. In fact, the aggregates follow a linear elastic behavior and do not creep. The deformation reported to the total volume is then reduced with the decrease of the relative volume of the cement paste. In addition, the larger the applied stress, the more important the kinetics and magnitude of creep displacement are.
Figure 7.2. Top: basic creep displacement at 70% and 85% of Fmax. Bottom:
load-CMOD curves for loaded and unloaded mortar and concrete beams. For a color version of the figure, see www.iste.co.uk/millet/advances.zip
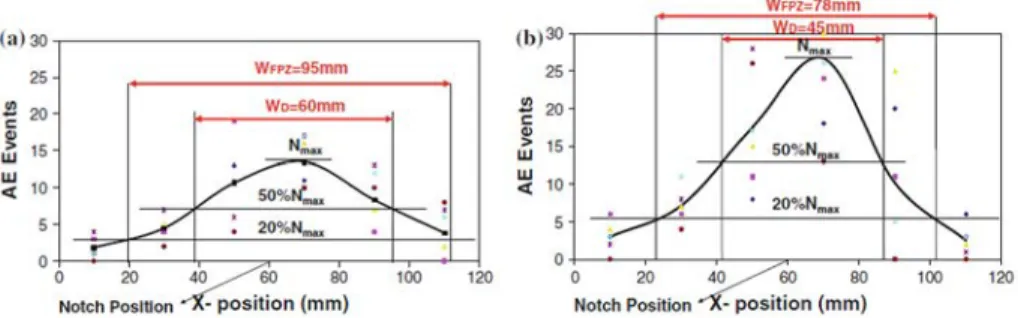
Concrete beams presented higher fracture properties than mortar beams because of the improvement in resistance to crack propagation and crack arrest mechanisms due to the presence of aggregates in concrete [ALA 14]. However, the influence of basic creep on the fracture parameters for mortar and concrete beams is not distinctly observed with those macroscopic mechanical tests. The use of an experimental technique to monitor fracture development is then necessary. The application of the AE technique has shown many differences during the different phases of the load displacement curves [RIL 10]. The AE activity is more important and the widths of the fracture process zone (WFPZ) and of damage zone (WD)
decrease, for beams subjected to creep indicating a more brittle behavior (Figure 7.3) [SAL 12a].
Figure 7.3. Evolution of cumulative events per grid: a) aging specimen, b) creep
specimen. For a color version of the figure, see www.iste.co.uk/millet/advances.zip
Even after 1 year of high rate loading, beams subjected to basic creep did not reach tertiary creep. This may be due to the limited time of loading considering the low kinetic of crack evolution. In order to deepen our knowledge of creep damage coupling on long-term and better evaluate the heterogeneities effect, the kinetic of creep was accelerated by submitting mortar and concrete beams to drying where damage was continuously assessed by the AE technique.
7.2.2.2. Case of the desiccation creep
Desiccation creep tests were realized at 50% of Fmax in order to avoid the
premature rupture of concrete (DC50). In addition, in order to quantify the rate of desiccation creep, combined basic-desiccation creep tests were realized in parallel. For that, concrete beams were loaded in basic creep for 1 month and then subjected to desiccation (BDC50). At the moment when BDC50 was exposed to drying, creep displacement increased very fast at the beginning then decreased proportionally to the rate of shrinkage to join later the creep displacement of DC50 (Figure 7.4).
Figure 7.4. Top: combined desiccation and basic-desiccation creep displacement at
50% of Fmax of concrete beams. Bottom: load-CMOD curves for loaded and unloaded beams.
The effect of desiccation creep on the evolution of the fracture properties of concrete beams has been characterized by submitting concrete beams loaded previously at 50% of Fmax and unloaded beams subjected to the same drying
conditions (DC0) to further loading up to rupture. The flexural strength of unloaded concrete beams did not seem to be affected by desiccation in comparison with BC0, however a slight decrease of the flexural modulus is observed, that can be linked to a decrease of Young’s modulus (Figures 7.2(b) and 7.4(b)). This is in agreement with the results found in the literature, where most of the authors noticed a decrease in the Young’s modulus after desiccation due to shrinkage restrained by aggregates [BUR 05]. However, the desiccation effect on the residual strength has shown many contradictions: while some researchers did not observe any direct effect [BRO 78], others have reported a decrease [HAN 68, KAN 98] and an increase of the residual strength in flexion [DEL 91]. Aditionally, a decrease in Young’s modulus, the maximal strength and the fracture energy has been observed for the beams subjected to desiccation creep indicating an important damage (Figure 7.4(b)). Thus, even with
a low level of loading, the coupling between creep and damage is more important in desiccation creep.
7.2.3. AE monitoring of creep tests for concrete and mortar beams
7.2.3.1. AE activity during desiccation creep tests
The kinetic of desiccation creep at 70% (Figure 7.4) is more important in comparison with that of basic creep (Figure 7.2). In addition, while concrete beams loaded at 70% (DC70) failed after few days, mortar beams loaded at 70% of Fmax
(MDC70) did not fail even after more than 4 months of loading showing a more important viscous behavior considering the more important amplitude and kinetic evolution. At this level another issue arises due to the influence of desiccation on the mechanical properties. In fact, the surfaces exposed to drying present a non-uniform desiccation (humidity gradient) which induces a non-uniform shrinkage and thus presents a structural effect due to tensile stresses at the surfaces that are superposed to the flexural stresses [BAZ 82, BIS 02].
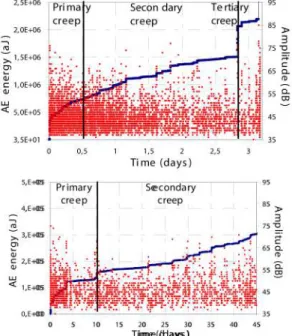
Figure 7.5. AE activity during desiccation creep tests for mortar
(top) and concrete (bottom) beams loaded at 70% of Fmax: correlation between the cumulated AE energy and the hits amplitude.
The evolution of damage under creep seems to be different in mortar and concrete beams and thus the presence of aggregates modifies the fracture behavior. The AE activity was analyzed during the distinct phases of creep, corresponding to the evolution of creep displacement into three regimes which generate different signals covering different amplitude ranges (Figure 7.5). The cumulated AE energy shows a good proportionality with creep displacement and the different phases of creep are revealed. During primary creep, the kinetic of creep displacement and AE energy decreases, with AE hits of high amplitude and an important emission of AE energy. During secondary creep, the rate of the AE activity is quasi-constant with a stable emission of AE energy. During tertiary creep in concrete beams, the AE activity increases quickly in correlation with creep displacement with the emission of high energetic signals. This phase corresponds to the coalescence and the fast propagation of micro-cracks where the events begin to concentrate in the cracking zone generating a localized crack. Due to desiccation, the neutral axis of the beam moves upward causing an additional curvature and leading to the failure of concrete beams [BAZ 85, BAZ 94].
The emission of weak amplitude signals is less important during desiccation creep in mortar beams and seems to correspond to micro-cracks at the ITZ in concrete beams. In addition, the AE activity is more important in concrete beams with a more important AE energy and high amplitude signals due to a more important damage. This may be due to the higher porosity in concrete due to the presence of aggregate which generates a more active process of humidity diffusion within concrete micro-pores and macro-pores. It could also be due to the presence of ITZ in concrete which is generally weaker than the matrix [ZIM 85] and constitutes a zone of stress concentration. In fact, this zone contains a more important part of free water in concrete responsible of the important shrinkage when it is free to escape [XIA 13]. Stress concentrations generated in those zones are accentuated by the strain incompatibility between the aggregates and the cement paste due to desiccation shrinkage [BIS 02, IDI 11, WON 09] that increases with drying, the volume and the aggregates’ diameter [GRA 10, WON 09]. The localization of micro-cracks in the ITZ controls the behavior of concrete under creep and may be responsible of fracture [SAL 12a]. In fact, micro-cracking initiated due to the applied constant load begins to growth and form a crack path leading to the failure of concrete beams [BAZ 92, NGA 81, ROS 94]. In mortar beams, stresses related to the load and shrinkage are more diffuse. Aggregates play thus an important role in the development of micro-cracks in the ITZ and increase the risk of rupture of concrete under creep due to different mechanisms of stress concentration and redistribution [SAL 13].
7.2.3.2. Assessment of damage mechanisms occurring under creep
The quantitative understanding of the physical processes and the microstructural phenomena that control the fracture behavior on the macroscopic scale under creep is poor. It appeared necessary to take the analysis further to obtain information about the physical mechanisms, the origin of the AE signatures. For this, a multi variable analysis of the recorded acoustic signals was proposed to discriminate the damage mechanisms in the material according to the typical AE signals and their apparition chronology [SAL 14].
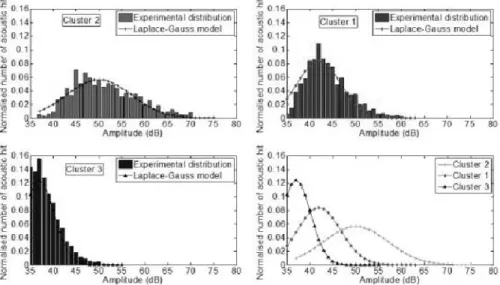
For the classification process of the monitored AE data under creep, the non-supervised method K-means associated with a principal component analysis (PCA) and the dendrogram can be used [KOS 03]. The K-means method allows for obtaining a non-supervised classification in n class representative of the n damage mechanisms in the case of multidimensional data. The PCA method is achieved in order to improve the visualization of the classification result by reducing the data dimension [OJA 89]. In the non-supervised method each signal can be associated to a pattern composed of multiple relevant features, extracted from the random AE waveforms (amplitude, energy, rising time, average frequency, etc.). Two clusters are distinguished for basic creep and three for desiccation creep. The hits number by amplitude recorded is averaged to create an AE hits amplitude distribution for each cluster and is fitted with a statistical Laplace-Gauss model. Figure 7.6 shows the experimental distribution and the corresponding statistical law of the AE hits amplitude for each class.
Figure 7.6. Experimental and statistical AE
The first cluster can be associated to micro-cracking at the matrix-aggregate interface [ROS 89]. The second class can be associated to micro-cracking in the matrix. Based on the variation of the AE parameters, the third cluster could correspond to signals due to drying as liquid transfer in concrete [CHO 06] and cavitation [LUR 09]. Note that the differences between ranges of amplitude for the classes obtained here could be different for others specimen geometries and recording system parameters. The ranges have to be considered as relative differences.
7.2.4. Summary
The experimental tests showed that these deformations, restrained by the presence of aggregates, lead to the creation of micro-cracking in the cement paste, which could be detrimental for the mechanical behavior [SAL 12a]. The experimental methods for the characterization of micro-mechanisms at this scale is limited to the use of the acoustic emission technique [SAL 12a, SAL 13]. The multi-scale modeling from the hydrates multi-scale to the structure multi-scale seems to be relevant for this characterization.
7.3. Numerical methods for the analysis of damage during creep 7.3.1. State-of-the-art of the creep modeling of cement-based materials
Several creep-damage theoretical models have been proposed in the literature. The modeling of the interaction between the viscoelasticity and damage has been performed by coupling linear creep models with damage models [BEN 08, CHA 05, MAZ 03, OMA 04, OZB 01, REV 07, TOR 08], or by using plasticity [RUI 07] and viscoelastic-viscoplastic [BER 03] models in series in order to reproduce the nonlinear behavior of concrete. These approaches are interesting because they allow us to directly define the damage threshold by taking into account the influence of the viscoelastic behavior. These models suggest an extension for the writing of the equivalent strain to obtain a triaxial state by equivalence to a uniaxial state and are defined by the positive eigenvalues of the strain tensor. The creep strains are a part of the total strains and they are weighted by introducing an intensity factor β in the equivalent strain [MAZ 03]:
ε = 〈 ̿ 〉 : 〈 ̿ 〉 + 〈 ̿ 〉 : 〈 ̿ 〉 [7.1]
where .+represents the positive part of the strains fields, e
ε the elastic strain tensor and v
viscoelastic effects on the damage of the matrix and can be characterized by experimental creep tests.
However, most of these models are based on empirical relations applied at the macroscopic scale. Coupling between creep and damage is mostly realized by adding some parameters to take into account the microstructure effects. With the same idea of introducing damage due to creep, some models were developed by considering the effect of creep on crack opening and softening mechanisms. Three approaches were considered: the concept of activation energy [BAZ 97b], the introduction of creep models in a cohesive model to control the crack width [BAR 05, CAR 97] and finally the combination of micromechanical models for the softening behavior of concrete and creep models [BAR 04]. However, Le et al. [LE 07] have shown how the microscopic retardation and relaxation times of the viscoelastic matrix of a heterogeneous material control the creep behavior of the homogenized material.
Most of the macroscopic models require the calibration of a large number of parameters or the use of artificial parameters for weighting the viscoelasticity proportion in the damage evolution. Artificial parameters are generally used to take into account implicitly the interaction between the phases of concrete under loading. This interaction can be modeled with a good consideration of the microstructure and a good approach to creep mechanisms involved. Mesoscopic modeling for concrete has shown a particular interest in the analysis of interactions between the cementitious matrix (cement paste, mortar) and aggregates [DUP 09, GRA 10, GRO 07, LOP 08, NGU 11]. The multi-scales approach was found to be very useful for the evaluation of material characteristics affected by the components’ material characteristics. Thus, the mesoscale modeling presents many advantages in the understanding of the fracture process and the corresponding effect of concrete heterogeneities. The behavior of concrete is modeled at the mesoscopic scale by coupling a linear viscoelastic model, defined by Kelvin chains and a damage model [SAL 13].
In addition, several researchers have developed models coupling the viscoelastic behavior and the hydration degree of cementitious materials [BRI 12, DES 99, DES 00, ROS 93]. These models have been developed to simulate the behavior of structures taking into account the implicit effects of the microstructure; which needs the calibration of several parameters. The development of new modeling techniques has allowed evolving the solidification theory into an explicit representation of creep-hydration coupling. Pichler and Lackner [PIC 08] showed that it is possible to assimilate the creep compliance to the mean effective compliance of the phases constituting the material. This result has been confirmed further using a numerical approach [TRA 11].
The study of cement paste morphology is therefore of particular interest in the evaluation of concrete creep [SAN 09]. In addition, the explicit description of the microstructure with inclusions generated randomly allows to localize the mechanical fields and reduces the number of empirical relations [GRO 07, GRO 11]
.
7.3.2. Creep-damage modeling
7.3.2.1. Problem formulation of the coupling between creep and damage
A volume V of concrete is formed by two media: a matrix defined by the medium Vm and inclusions defined by the medium Vi. With the objective to model
the damage due to creep of concrete, phases have a damage viscoelastic behavior law. A constant load F is applied on one of the surface boundary of V( )Γ1 with the
unit normal vector . This load implies local displacements fields ( ), local strain fields ̿( ) and local stress fields ( ) in each point of V. The non-linear viscoelastic problem is written as follow:
( ) = 0 ∀ ∈ [7.2]
( ) = , ̿( ) ∶ ̿( ) − ̿ ( ) ∀ ∈ [7.3]
ε( ) = (∇ ( ) + ∇ ( ) ∀ ∈ [7.4]
F = . ∀ ∈Γy 1 [7.5]
u = ∀ ∈ Γy 2 [7.6]
where C( , ̿( )) is the secant stiffness tensor depending on the local strains and damage, ̿ ( ) the local viscoelastic strain fields and Γ2the boundary of V on which
macroscopic displacements conditions are applied.
The chosen damage model is the isotropic model developed by Fichant, Pijaudier-Cabot and La Borderie [FIC 97]. It allows to represent the unilateral effect and to obtain objective results independently of the length of the finite elements by controlling the fracture energy. This model is a simplified version of the microplane model of Bazant and Ozbolt [BAZ 90] and is based on the relation between the total stress and the effective stress σ ( ) of the material defined by:
where C ( ) is the initial stiffness of the material phases considered isotropic and linear elastic and C ( , ̿( ) the stiffness of the damaged material. For the isotropic version of the model, the relation between the effective stress and the total stress is given by Fichant, La Borderie.and Pijaudier-Cabot [FIC 99]:
σ = (1 − ) [7.8]
where d is the scalar value of the isotropic damage that depends only on the
equivalent strain calculated according to the elastic strain tensor ε = ( ̿( ) − ̿ ( ))
ε = ̿ : ̿ [7.9]
The evolution of the damage variable, due to external mechanical loads, is an exponential form:
(
)
0 0 1 d exp t d eq eq d ε B ε ε ε = − − [7.10]whereBtrepresents a damage parameter to control the slope of the strain softening
constitutive relation in function of the width h of the element and εd0the strain
threshold. Damage increases when the equivalent strain εeqis higher than the
threshold strainεd0 linked to the fracture energy Gf as follow [MAT 10]: 0 2 f t d t t G f f h B ε = + [7.11]
where his the element size and ft the tensile strength.
The viscoelastic strain is defined by several Kelvin chains. With those elements, the stress history does not have to be stored for the calculation of creep strain [BEN 08]. For a Kelvin unit i, the basic strain evolution is given by:
η ̿ ( ) + ̿ ( ) = ( ) [7.12]
where ( )v t
ε represents the derivative of the elementary basic creep strains, v
k the
The creep process occurs only in the undamaged part of the material and the effective stresses are linearized for each time step. The local total viscoelastic strains are obtained by solving analytically the differential equations and are expressed as:
̅ = ̅ − ̅ = ̅ + + [7.13]
where ̅ is the viscoelastic strain vector at time-step number n and a b cv, ,v v depend
upon material parameters [REV 07]. The total viscoelastic strain is deduced from the sum of all the elementary viscoelastic strains.
E( ) = ∑ ̿ ( ) [7.14]
The material volume is modeled by a digital concrete model which takes into account the “real” aggregate size distribution of concrete [GRO 07, MOU 02]. The volume of concrete is defined by a matrix, consisting of the mortar, in which aggregates of different diameters are placed, from the largest to the smallest, according to a random process. Details are given in Grondin et al. [GRO 07]. This approach requires defining two behavior laws for the mortar and aggregates. Each phase is characterized by a set of physical and geometrical parameters: the volume fraction, the unit size and physico-mechanical properties. A specific algorithm has been developed to make a spatial and random distribution of these phases on the basis of a finite element grid.
7.3.2.2. Simulation of tensile creep of concrete
Concrete is modeled by a two-phase material consisting of aggregates embedded in the mortar matrix. So, the mechanical properties of mortar and aggregates have to be determined separately. Creep strain for aggregates is considered equal to zero and the mechanical characteristics are obtained from the literature. The parameters (failure and creep properties) adopted for the simulations are identified by experimental direct tensile tests on mortar and concrete (Figure 7.7). Tensile tests
are conducted first and then mortar and concrete specimens are loaded in creep at 70% and 85% of their maximum load. Concrete and mortar specimens with the same constituents and the same water-to-cement ratio should be used. In order to quantify the damage occurring in concrete under creep, the AE technique is also used to assess the state of the material during loading and thus could be used to validate numerical models.
The considered mesoscale for modeling the behavior of concrete is the scale at which the material can be observed as a set of coarse aggregates embedded in a mortar matrix. Here, coarse aggregates are inclusions of a size greater than 5 mm following the experimental aggregate size distribution while mortar matrix is a mixture of finer aggregates and the cement paste. The aggregates’ volume represents
37% of the total volume of concrete. The stability of results depending on the size of the specimen and the maximal diameter of the inclusion was demonstrated in a recent study [GRO 07] and was respected here with dimensions equal to 4 times the highest inclusion diameter (L/Dmax > 4) and finite element size equal to 0.8 times the smallest inclusion diameter.
Figure 7.7. AE transducers location on the concrete specimen in the tensile tests
Figure 7.8 shows a good correlation between the calculated load-displacement evolution and the experimental measurements. The comparison is made only pre-peak because the tensile tests were performed by the force control and did not allow post-peak part.
These results show that the mechanical parameters selected for mortar and aggregates are valid and that the mesoscopic modeling can reproduce well the concrete failure. The tensile strength varies slightly with the random distribution of the aggregates. However, no effect was observed on the pre-peak part of the load-displacement curves where specimens were loaded in creep.
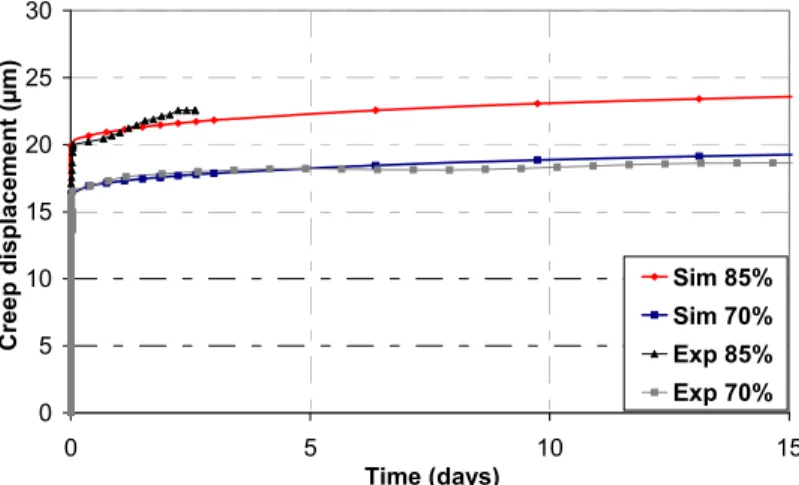
The imposed constant load is equal to 70% and 85% of the maximal strength of concrete determined by the fracture tests. Numerical simulations reproduce well the experimental creep tests (Figure 7.9). The numerical creep displacement obtained with the digital concrete model is lower than creep displacement for mortar specimens which is expected as the aggregates do not creep and restrain the viscoelastic strain of the matrix. In experiments, specimens loaded at 85% fail after a few days. However, the crack is localized at the end of the specimen which may be due to stress concentration at both extremities (Figure 7.10). In addition, while concrete specimens failed, mortar specimens did not show any damage. Thus, the
x y z x y z 110mm 110mm 50mm 80mm 1 2 3 4 5 6 7 8 50mm 110mm 110mm 110mm 50mm 80mm 1 2 3 4 5 6 7 8 50mm 110mm
failure can be associated with the presence of the ITZ which is characterized by weak mechanical properties [GRO 14].
Figure 7.8. Comparison between the calculated and measured load-
displacement of concrete in tension. For a color version of the figure, see www.iste.co.uk/millet/advances.zip
Figure 7.9. Comparison between experimental and numerical tensile creep
displacement of concrete specimens loaded at 70% and 85% of their flexural strength. 0 5 10 15 20 25 30 0 5 10 15 20 25 30 35 Displacement (µm) Lo ad (KN) Sim 3 Sim 2 Sim 1 Exp 1 Exp 2 Exp 3 0 5 10 15 20 25 30 0 5 10 15 Time (days) Creep displ acement (µm) Sim 85% Sim 70% Exp 85% Exp 70%
Figure 7.10. Localization of the macro-crack in the
concrete specimen under 85% traction creep
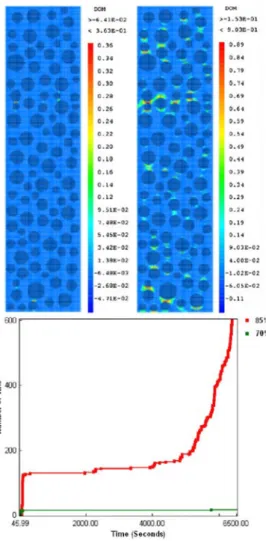
Figure 7.11 shows the damage localization in concrete specimens loaded at 70% and 85% after 15 days. Specimens loaded at 70% show little damage localized at the mortar-aggregates interface. The same result is obtained for the specimen loaded at 85%, however the damage intensity is more important. This damage is due to the load application at the beginning and the increase with creep. These results are confirmed by the AE measurements. The number of hits increases sharply during the first period which corresponds to the instantaneous deformation in correlation with the load application. Then, the number of hits increases slightly with time for the specimen loaded at 70% of the maximal strength during secondary creep. For the specimen loaded at 85%, an exponential increase of the number of AE hits is observed during tertiary creep, reached due to the high initial damage at loading.
AE hits are related to the release of elastic energy similarly to the strain energies released by damaged elements. So, it could be reasonable to assume, as an approximation, that the number of AE hits is proportional to the number of damaged elements [GRE 15, SAL 16, ZHU 02, ZHU 10].
Figure 7.11. Damage localization after 15 days and acoustic emission activity in
concrete specimens loaded at 70% and 85% of the maximal strength. For a color version of the figure, see www.iste.co.uk/millet/advances.zip
7.3.2.3. Simulation of the flexural creep tests of concrete
Numerical simulations are also performed on concrete submitted to a three-point bending test and compared to experimental results analysed in the previous section [SAL 12a]. The loading is applied as an incremental vertical displacement of a rigid plate (linear elastic law) fixed at the middle of the top of the beam (Figure 7.12). A regular mesoscopic mesh related to the middle part of the concrete specimen is generated and two homogeneous concrete blocks are attached to the left and right
end of the beam with progressively larger mesh to avoid stress concentration. The numerical simulations were conducted under plane stress conditions. The parameters determined by the direct tensile tests are used for the mesoscopic mesh. For the homogeneous part, the parameters are determined by the direct tensile tests on concrete specimens. A fracture test is performed to determine the maximal flexural strength and to validate the choice of the mechanical properties defined for mortar and aggregates (Figure 7.13). The results reproduced well the experimental load-CMOD curves.
Figure 7.12. Meso-macro meshing and boundary conditions of concrete beams for
the three-point bending test simulation. For a color version of the figure, see www.iste.co.uk/millet/advances.zip
Figure 7.13. Load-CMOD relationship in flexion
and comparison with experimental results
The proposed model is also suitable for the computation of creep damage in bending. Creep compliance is assumed to be equal in compression and in tension which is in accordance with experimental evidence for mature concrete [BRO 78]. A constant load is applied to the plate at 70% and 85% of the maximal strength. Deflection-time curves are plotted in Figure 7.13 and exhibit good agreement with the experimental data.
0 2 4 6 8 10 12 0 50 100 150 200 250 300 CMOD (µm) Lo ad (kN) Sim Exp
Figure 7.14. Deflection-time curves of concrete beams in flexion at
70% and 85% of the maximal strength.
The macroscopic behavior of concrete under creep loading is characterized by a progressive degradation of the material stiffness. This behavior is caused by the growth and coalescence of micro-cracks at the mortar-aggregates interfaces due to strain incompatibilities (Figure 7.15). That means that the mechanical properties of concrete are gradually and locally degraded under creep. Further, it is assumed that the concrete specimen collapses when a long continuous crack develops at the bottom of the specimen and at the same time the maximum axial strains of the elements along the main crack are higher than the corresponding ultimate strain.
Figure 7.15. Damage and crack opening of concrete beams in flexion at 70% and
85% of the maximal strength.
0 10 20 30 40 50 60 70 80 90 100 0 20 40 60 80 100 120 C re ep displa ceme nt (µ m) Time (days) Sim 70% Sim 85% Exp 70% Exp 85%
7.3.3. A predictive creep modeling
7.3.3.1. The multi-scale approach
For modeling the creep behavior of concrete, three scales have been considered: microscopic, mesoscopic and macroscopic (Figure 7.16).
Figure 7.16. Three observation scales of concrete
The simulation of the creep of concrete needs the knowledge of the compliance of its matrix (mortar); at a lower scale, the knowledge of the compliance of the mortar’s matrix (cement paste); and at the lowest scale, the knowledge of the cement paste’s matrix. The compliance of these matrices are calculated by a homogenization approach by solving the viscoelastic problem presented in the next section. At the lowest scale, the viscoelasticity of the cement paste is considered strictly dependent on that of its matrix. The cement paste is formed by a matrix constituted of C-S-H, pores and inclusions formed by the other hydrated phases (Vhyd = [CH, Ettringite,
gypsum, C3AH6, FH3]) and the residual cement clinkers ([C3S, C2S, C3A, C4AF]).
With the advancement of the hydration process, the clinker volume fraction decreases while the main hydrate’s (C-S-H) and Vhyd volume fractions increase
significantly. The hydration process which determines the component’s volume in the microstructure is based on the Arrhenius’ law:
= ( ) [7.15]
where and Ti represent the normalized affinity and the characteristic hydration
time, respectively, and the hydration coefficient of the clinker i. The hydration process leads to the dissolution of clinkers and to the formation of hydrates with a volume defined by Berthollet [BER 03] and [GRO 10]:
( ) = ∑ ( ) = 1, [7.16]
where represents the residual clinkers volume in the cement paste, ( ) the new formed hydrates volume, M the molar mass [g.mol−1], ρ the mass density [g.cm−3]
Macro Meso Micro
and n the mole. The index k represents the products (clinkers), l the reactants and c the cement. Along the hydration process, the volume fraction of the main hydrates increases and that of the pores into the cement paste’s matrix (fp) decreases (water is
consumed and the voids are filled with formed hydrates). The calculated evolutions of the C-S-H and fp for three w/c ratios (0.4, 0.5 and 0.57) are given in Figure 7.17. We observe that the evolution of the sum of the residual clinkers and the other hydrates is not important during the hydration process from 24h.
So, in accordance with the assumption of the restraining effect of the elastic phases on the C-S-H, the modeling at this scale was simplified by considering only one type of particle with a unique size for the inclusions. Their elastic characteristics are then calculated by applying the self-consistent scheme [GRO 10] with the intrinsic elastic characteristics of the different hydrates (Vhyd) and clinkers
[BER 03].
Figure 7.17. Left: porosity and C-S-H hydrate evolution with age for different w/c
ratios (black: porosity; grey: C-S-H). Right: evolution of hydration degree and Vhyd -clinker with age (black: Vhyd-clinker; grey: hydration degree)
The choice of scales is made based on the definition of the representative elementary volume (REV). Theoretically, the REV must be large enough to represent the specimen or structure and small enough to take into account the effects of heterogeneities. In the finite elements methods, the dimensions of the REV must take in consideration the independence of the calculated effective values regarding the chosen mesh. To ensure this independence as well as the volume stability, the REV dimensions must be greater than or equal to four times the diameter of the largest inclusions and the elements dimensions must be less than or equal to 0.8 times the smaller diameter inclusions [GRO 07].
7.3.3.2. The homogenization problem
The creep model allows the calculation of the average elementary strain 〈 ̿ ( , )〉 and the average stress 〈 ( , )〉 at each step tp of the time
discretization interval {t0=0, t1, tp., tn=tmax}. At each time t’, the resolution of the
problem is equivalent to solving an elastic homogenization problem on the biphasic REV. The tensor connecting the two fields is constant at the time (tp) of the
calculation, such as:
〈 ̿ ( , )〉 = ̿̿ ( ): 〈 ( , )〉 [7.17]
The integral over timeJ̿̿ (t ) gives the final shape of the creep compliance. Considering only the time-dependent stress, the applied stress is expressed by the following relationship:
〈σ(t, y)〉 = H(t)〈σ 〉 [7.18]
with H(t)the Heaviside function as: H(t) = 0 si t = 0
H(t) = 1 si t > 0
Summing over time the components of constant elementary tensors, the formula [7.17] becomes:
∑ 〈ε (t , y)〉 = ∑ J (t ) 〈σ (t )〉 [7.19]
By replacing 〈σ (t )〉 by its expression, the formula [7.19] can be written in this form:
∑ 〈ε (t , y)〉 = ∑ J (t ) H(t )〈σ 〉 [7.20]
By replacing H(t ) by its expression and considering that the strain is zero at t=0 we obtain:
〈ε (t, y)〉 = J (t)〈σ (t)〉 [7.21]
The relation [7.21] can be written in tensor form as follows:
〈ε (t, y)〉 = J̿̿ (t): 〈σ(t, y)〉 [7.22]
The viscoelastic strain is modeled by a generalized Kelvin model with three chains (Figure 7.18), thus the creep compliance can be written as a function of the model parameters:
J (t) = ( )+ ∑ ( )(1 − e ) [7.23]
Figure 7.18. Generalized Kelvin model
The creep compliance of the matrix at the cement paste scale is noted J (t). The calculation by homogenization gives the effective creep compliance of the cement paste J . At the mortar scale, the viscoelastic coefficients of the matrix J (t) are deduced from J according to the formula [7.23]. By adding the sand grains in the volume, the homogenization method allows the calculation of the effective creep compliance of mortar J . At the concrete scale, the viscoelastic parameters of the matrix J (t) are deduced from J according to the relation [7.23]. By adding aggregates to volume, the displacement of concrete under creep can be calculated. The scheme of the homogenization method is shown in Figure 7.19.
This approach is based on the knowledge of the viscoelastic coefficients giving Jh(t). For this, it is necessary to calculate these coefficients from the properties of
C-S-H in the presence of porosity; however, this latter evolves with age. A first calculation is then proposed to define the viscoelastic coefficients Jh(t).
7.3.3.3. Simulation of tensile creep of concrete at early ages
Concrete structures are brittle in tension so the tensile behavior of concrete has to be characterized as a priority. Constant tensile loads were applied and only the effective part of the compliance in the loading axis was considered, which gives the predominant deformation for the tensile load. The other components showed negligible values. So, the homogenization calculations were performed only in 2D. At the concrete scale, the calculations were performed on slim cylindrical concrete specimens (11 x 45 cm2) and the plane stresses (2D) conditions were retained.
By considering that in mature concrete the evolution of the capillary porosity does not influence the creep deformation, the viscoelastic properties of the concrete components can be assessed for a constant capillary porosity. Therefore, an inverse approach was applied to calculate the intrinsic creep parameters of the cement paste matrix. A creep displacement measured on a mature concrete [SAL 13] with a w/c ratio of 0.57 has been fitted. First of all, the hydration model has been validated by comparing the calculated and the measured hydration degree of the cement paste used in the concrete mixture. At each scale, the viscoelastic coefficients of the matrices were calibrated to adjust the homogenized compliance of the material. At the first step, the viscoelastic coefficients of mortar Jm(t) were adjusted from
experimental results on the tensile creep compliance of concrete [SAL 13] to obtain the best fitting compliance of concrete given by Jchom (Figure 7.20). In order to limit
the number of calibrated parameters, some of the elastic parameters were calculated by the hydration model. The parameters used at the three scales are summarized in [FAR 14].
For the calculation of the viscoelastic parameters of the cement paste matrix ( ) the formula of Ricaud and Masson [RIC 09] was used to link the viscoelastic bulk coefficients of C-S-H ( ) with the pores content:
k = k ( ) [7.24]
For a mature concrete, the calculation of hydration gives a pore volume fraction equal to 27% in the cement paste which corresponds to 36% in the cement paste matrix. So we obtained: = 63.3 , = 33.8 , = 27.4 .
Figure 7.20. Above: comparison between the measured compliance of concrete and
that calculated with the calibrated viscoelastic coefficients of mortar (Jc(hom)). Below: comparison between the measured hydration degree and that calculated for a
cement paste with a w/c ratio of 0.57
For the simulation of aging creep, the evolution of Vhyd and the residual clinker
volume fraction with hydration have been taken into account in the generation of the inclusions in the mesh at the cement paste scale. The percentage of inclusions decreases along the hydration process to transform into the matrix. Thus, the evolution of the microstructure has been taken into account in the calculation by attributing the matrix properties to the transformed inclusions. This finite element method gives an approximation of the evolution of the microstructure in order to take into account explicitly the interactions between the matrix (C-S-H + pores) and inclusions during creep tests.
At the cement paste scale, the inverse of the relation [7.24] has been applied to calculate the viscoelastic parameters of the matrix to define Jh(t). The more the
creeps; when the age increases, the porosity decreases and the bulk coefficients increase showing the solidification of the material.
In order to avoid the damage risk in the cement paste and in the mortar, the applied load is kept constant throughout the creep test. In this paper, a constant load of 30% of the tensile strength has been applied at the age of 24h during 28 days. The tensile strengths of the cement paste and mortar at the loading age have been calculated by solving the problem in which the viscoelastic strain is maintained equal to zero and for a monotonic load applied on the bottom of the specimen until the failure. The tensile strengths and the constant load applied are presented in Table 7.2.
w/c 0.4 0.5 0.57 Stress (MPa)
Cement paste 0.45 0.135 0.38 0.114 0.35 0.105 Mortar 0.97 0.291 0.7 0.21 0.6 0.18
Table 7.2. Tensile strengths of cement pastes and mortars and applied creep
stresses
Based on the evolution of the viscoelastic parameters of the cement pastes’ matrices, the effective tensile creep compliances of the cement pastes have been calculated by homogenization for different w/c ratios. Then, the effective compliances of the cement pastes were defined as viscoelastic parameters of the mortars’ matrices for the calculation of the creep at the mortar scale (Figure 7.21). Finally, the effective compliances of mortars were defined as viscoelastic parameters of the concretes’ matrices for the calculation of creep at the concrete scale (Figure 7.19).
Figure 7.21. Evolution of the of the cement pastes (left) and mortars (right) with age for different w/c ratios.
At the concrete scale, creep-damage coupling is taken into account by solving the nonlinear viscoelastic problem. The tensile strengths of concretes at 24h calculated for a monotonic loading for the w/c ratios of 0.4, 0.5 and 0.57 are equal to: 1.06 MPa, 1.05 MPa and 1 Mpa (respectively). Five creep loads have been simulated: tensile creep tests with 30%, 70% and 90% of ft and compressive creep tests with 70% and 90% offc (Figure 7.22).
Figure 7.22. Evolution of creep compliances of concrete submitted to different loads
For a stress-to-strength ratio of 30% (Figure 7.23), the most important strains are localized at the interface between the aggregates and the matrix. In these areas, the strains are important but remain smaller than the threshold strain and concrete does not damage. If equivalent loads are applied on mortars and cement pastes, the damage appears. Thus, on one hand, the aggregates result in deformations of mortar at the concrete scale and, on the other hand, they support some of the applied creep load and contribute to minimizing the effect of the latter on the deformations of mortar.
It is admitted that the matrix-aggregates interaction can lead to damage and increase the apparent deformation. At the concrete scale, the results show that the deformation of the matrix (mortar) does not lead to damage because it is restrained by aggregates and the interactions are not sufficient to create damage at their interfaces. At the cement paste and mortar scales, the deformations are not restrained by aggregates. This is the reason that the deformations are so high at these scales compared to those observed at the concrete scale (Figure 7.21).
The calculations at the cement paste and mortar scales have to be used only for the determination of the viscoelastic properties without any damage. If damage is considered at these scales, the effective creep compliance will not give the real deformation at the concrete scale. So, these results validate the choice of a linear viscoelastic problem for the calculation of the effective viscoelastic properties of the concrete’s components. The compliances are the same for the two compressive tests and equal to that obtained for the tensile test at 70% of ft (Figure 24). The damage fields are similar for the two compressive tests, with a little difference in the highest values (0.85 for 90% and 0.72 for70%), but very different from the tensile test at 70%. It can be explained by the values of the compressive loads: for the test at 70%, respectively 90%, the compressive load applied at 24h is equal to 3.01 MPa, respectively 3.87 MPa. By considering a linear approximation of the Poisson effect at 24h, the tensile stress response in the perpendicular axis of the load axis is equal to 0.75 MPa for 70%, respectively 0.97 MPa for 90%. So, these stresses represent 75% and 97% of ft which is equal to 1 MPa at 24h. The tensile test performed with a load of 90% of ft confirms this analysis with a damage reaching locally the value of 0.98. The difference in the compliance for this test is due to a high damage since 24h. In the compressive tests, the material absorbs a part of the stress energy before a restitution into a tensile strain. That is why in the compressive tests the damage is lower than in the tensile test at 90%. These results show the relevance of calculating the compressive and the tensile creep independently for the case of high loading.
Figure 7.23. Localization zones of deformations after creep loading in concrete:
Figure 7.24. Damage in concrete for different loads: compressive load at 70% of fc, compressive load at 90% of fc, tensile load at 70% of ft, tensile load at 90% of ft.
7.4. Conclusion
Using the AE method to characterize local damage and to analyze the physical mechanisms underlying the creep of concrete seems to be a relevant method. A good correlation was observed between creep displacement and the variation of the AE parameters. As a part of the investigation, quantitative analysis of the acoustic emission data was applied and characteristics of individual micro-mechanisms were evaluated and associated to two clusters for basic creep and three clusters for desiccation creep. In order to better understand the micro-cracking during creep, a mesoscopic model was first developed. It was based on the coupling between a viscoelastic behavior and damage. The model needs parameters which can be characterized experimentally by calibration. The influence of the microstructure was taken into account by explicit interactions between the concrete matrix and inclusions. This model allows us to understand the physical mechanisms behind the failure of concrete under constant loading. Under tensile creep, damage induced at the moment of load application increases due to strain incompatibilities between mortars and aggregates and causes a strength decrease. Similar observations were obtained with the acoustic emission technique. In the case of low loading, damage can also increased without any influence of the load application amplitude, but it is due to the viscoelastic strain which reaches threshold damage. It was shown by the multi-scale model.
7.5. Bibliography
[ALA 14] ALAM S.Y., SALIBA J., LOUKILI A., “Fracture examination in concrete through
combined digital image correlation and acoustic emission techniques”, Construction and
Building Materials, vol. 69, pp. 232–242, 2014.
[ALT 03] ALTOUBAT S.A., LANGE D.A., “A new look at tensile creep of fiber reinforced
concrete”, in BANTHIA N. (ed.), ACI Special Publication on Fiber Reinforced Concrete,
American Concrete Institute, 2003.
[BAR 04] BARPI F.,VALENTE S., “A fractional order rate approach for modeling concrete
structures subjected to creep and fracture”, International Journal of Solids and Structures, vol. 41, pp. 2607–2621, 2004.
[BAR 05]BARPI F.,VALENTE S., “Lifetime evaluation of concrete structures under sustained
post-peak loading”, Engineering Fracture Mechanics, vol. 72, no. 16, pp. 2427–2443, 2005.
[BAZ 82] BAZANT Z.P., RAFTSHOL W.J., “Effect of cracking in drying and shrinkage
specimens”, Cement and Concrete Research, vol. 12, pp. 209–226, 1982.
[BAZ 85] BAZANT Z.P.,CHERN J.C., “Concrete creep at variable humidity: constitutive law
and mechanism”, Matériaux et Constructions, vol. 18, no. 103, pp. 1–20, 1985.
[BAZ 88] BAZANT Z.P.,PRASANNAN S., “Solidification theory for aging creep”, Cement and
Concrete Research, vol. 18, no. 2, pp. 923–932, 1988.
[BAZ 89] BAZANT Z.P., PRASANNAN S., “Solidification theory for concrete creep: I.
formulation”, Journal of Engineering Mechanics, vol. 115, no. 8, pp. 1691–1703, 1989. [BAZ 90] BAZANT Z.P.,OZBOLT J., “Nonlocal microplane model for fracture, damage, and
size effect in structures”, ASCE Journal of Engineering Mechanics, vol. 116, pp. 2485– 2505, 1990.
[BAZ 92] BAZANT Z.P.,GETTU R., “Rate effects and load relaxation in static fracture of
concrete”, ACI Materials Journal, vol. 89, no. 5, pp. 456–468, 1992.
[BAZ 94] BAZANT Z.P.,YUNPING X., “Drying creep of concrete: constitutive model and new
experiments separating its mechanisms”, Materials and Structures, vol. 27, pp. 3–14, 1994.
[BAZ 97a] BAZANT Z.P.,HAUGGAARD A.,BAWEJA S. et al., “Micro prestress-solidification
theory for concrete creep. I: aging and drying effects”, ASCE Journal of Engineering
Mechanics, vol. 123, no. 11, pp. 1188–1194, 1997.
[BAZ 97b] BAZANT Z.P., LI Y., “Cohesive crack with rate-dependent opening and
viscoelasticity: I. mathematical model and scaling”, International Journal of Fracture, vol. 86, pp. 247–265, 1997.
[BEN 08] BENBOUDJEMA F., TORRENTI J.M., “Early age behaviour of concrete nuclear
[BER 03] BERTHOLLET A., Contribution à la modélisation du béton vis-à-vis du vieillissement
et de la durabilité: interaction des déformations de fluage et du comportement non-linéaire du matériau, PhD Thesis, Institut National des Sciences Appliquées de Lyon, 2003. [BIS 95] BISSONNETTE B.,PIGEON M., “Tensile creep at early ages of ordinary, silica fume
and fiber reinforced concretes”, Cement and Concrete Research, vol. 25, no. 5, pp. 1075– 1085, 1995.
[BIS 00] BISSONNETTE B.,PIGEON M., “Le comportement viscoélastique du béton en traction
et la compatibilité déformationnelle des réparations”, Materials and Structures, vol. 33, pp. 108–118, 2000.
[BIS 02] BISSCHOP J.,VAN MIER J.G.M., “How to study drying shrinkage microcracking in
cement-based materials using optical and scanning electron microscopy?”, Cement and
Concrete Research, vol. 32, pp. 279–287, 2002.
[BRI 11] BRIFFAUT M,BENBOUDJEMA F,TORRENTI J.M. et al., “Numerical analysis of the
thermal active restrained shrinkage ring test to study the early age behavior of massive concrete structures”, Engineering Structures, vol. 33, no. 4, pp. 1390–1401, 2011. [BRI 12] BRIFFAUT M.,BENBOUDJEMAF.,TORRENTI J.-M. et al., “Concrete early age basic
creep: experiments and test of rheological modelling approaches”, Construction and
Building Materials, vol. 36, pp. 373–380, 2012.
[BRO 78] BROOKS J.J.,NEVILLE A.M.,HAQUE M.N., “A comparison of creep, elasticity and
strength of concrete in tension and in compression”, Magazine of Concrete Research, vol. 30, p. 104, 1978.
[BUR 05] BURLION N., BOURGEOIS F., SHAO J-F., “Effects of desiccation on mechanical
behaviour of concrete”, Cement and Concrete Composites, vol. 27, pp. 367–379, 2005. [CAR 97] CARPINTERI A.,VALENTEN S.,ZHOU F.P. et al., “Tensile and flexural creep rupture
tests on partially-damaged concrete specimens”, Materials and Structures, vol. 30, pp. 269–276, 1997.
[CHA 05] CHALLAMEL N.,LANOS C.,CASANDJIAN C., “Creep damage modelling for
quasi-brittle materials”, European Journal of Mechanics A-Solid, vol. 24, pp. 593–613, 2005. [COO 74] COOK D.J.,HAQUE M.N.,“The tensile creep and fracture of desiccated concrete and
mortar on water sorption”, Materials and Structures, vol. 7, no. 3, pp. 191–196, 1974. [DEL 91] DE LARRARD F.,BOSTVIRONNOIS J.L., “On the long-term strength losses of silica
fume high-strength concretes”, Magazine of Concrete research, vol. 43, no. 155, pp. 109– 120, 1991.
[DEN 06] DENARIÉ E., CÉCOT C., HUET C., “Characterization of creep and crack growth
interactions in the fracture behaviour of concrete”, Cement and Concrete Research, vol. 36, pp. 571–575, 2006.
[DES 99] DE SCHUTTER G., “Degree of hydration based Kelvin model for the basic creep of
[DES 00] DE SCHUTTER G.D.,TAERWE L., “Fictitious degree of hydration method for the
basic creep of early age concrete”, Stress: The International Journal on the Biology of
Stress, vol. 33, pp. 370–380, 2000.
[DUP 09] DUPRAY F.,MALECOT Y.,DAUDEVILLE L. et al., “A mesoscopic model for the
behaviour of concrete under high confinement”, International Journal for Numerical and
Analytical Methods in Geomechanics, vol. 33, pp. 1407–1423, 2009.
[FAR 14] FARAH M., GRONDIN F., MATALLAH M. et al., “Multi-scales computation of creep
deformation of concrete at very early-age”, EURO-C: Computational modelling of
concrete structures, St Anton am Arlberg, Austria, 24–27 March, 2014.
[FIC 97] FICHANT S.,PIJAUDIER-CABOT G.,LA BORDERIE C., “Contiuum damage modeling:
approximation of crack induced anisotropy”, Mechanics Research Communications, vol. 24, no. 2, pp. 109–114, 1997.
[FIC 99] FICHANT S., LA BORDERIE C., PIJAUDIER-CABOT G., “Isotropic and anisotropic
descriptions of damage in concrete structures”, Mechanics of Cohesive-Frictional
Materials, vol. 4, no. 4, pp. 339–359, 1999.
[FRE 58] FREUDENTHALT A.M., ROLL F., “Creep and creep recovery of concrete under high
compressive stress”, Journal of the American Concrete Institute, vol. 29, no. 12, pp. 1111–1142, 1958.
[GAR 09] GARAS V.Y., Multi-scale investigation of tensile creep of ultrahigh performance
concrete for bridge applications, PhD Thesis, Georgia Institute of Technology, 2009. [GRA 07] GRANGER S., LOUKILI A., PIJAUDIER-CABOT G. et al., “Experimental
characterization of the self-healing of cracks in an ultra high performance cementitious material: Mechanical tests and acoustic emission analysis”, Cement and Concrete
Research, vol. 37, pp. 519–527, 2007.
[GRA 10] GRASSL P.,JIRASEK M., “Meso-scale approach to modelling the fracture process
zone of concrete subjected to uniaxial tension”, International Journal of Solids and
Structures, vol. 47, pp. 957–968, 2010.
[GRE 15] GREGOIRE D.,VERDON L.,LEFORT V. et al., “Mesoscale analysis of failure in
quasi-brittle materials: comparison between lattice model and acoustic emission data”,
International Journal for Numerical and Analytical Methods in Geomechanics, 2015.
[GRO 07] GRONDIN F.,DUMONTET H.,BEN HAMIDA A. et al., “Multi-scales modelling for the
behaviour of damaged concrete”, Cement and Concrete Research, vol. 37, pp. 1453– 1462, 2007.
[GRO 10] GRONDIN F., BOUASKER M., MOUNANGA P. et al., “Physico-chemical deformations
of solidifying cementitious systems: multiscale modelling”, Materials and Structures, vol. 43, nos. 1–2, pp. 151–165, 2010.
[GRO 11] GRONDIN F.,DUMONTET H.,BEN HAMIDA A. et al., “Micromechanical contributions
to the behaviour of cement-based materials: two-scale modelling of cement paste and concrete in tension at high temperatures”, Cement and Concrete Composites, vol. 33, no. 3, pp. 424–435, 2011.
[GRO 14] GRONDIN F., MATALLAH M., “How to consider the Interfacial Transition Zones in
the finite element modelling of concrete?”, Cement and Concrete Research, vol. 58, pp. 67–75, 2014.
[HAI 05] HAIDAR K.,PIJAUDIER-CABOT G.,DUBÉ J.F. et al., “Correlation between the internal
length, the fracture process zone and size effect in model materials”, Materials and
Structures, vol. 38, pp. 201–210, 2005.
[HAN 68] HANSON J.A., “Effects of curing and drying environments on splitting tensile
strength of concrete”, ACI Materials Journals, vol. 65, no. 7, pp. 535–543, 1968.
[IDI 11] IDIART A.E., LOPEZ C.M., CAROL I., “Chemo-mechanical analysis of concrete
cracking and degradation due to external sulfate attack: a meso-scale model”, Cement &
Concrete Composites, vol. 33, pp. 411–423, 2011.
[KAN 98] KANNA V.,OLSON R.A.,JENNINGS H.M., “Effect of shrinkage and moisture content
on the physical characteristics of blended cement mortars”, Cement and Concrete
Research, vol. 28, no. 10, pp. 1467–1477, 1998.
[KOS 03] KOSTOPOULOS V., LOUTAS T.H., KONTSOS A. et al., “On the indentification of the
failure mechanisms in oxide/oxide composites using acoustic emission”, NDT&E
International, vol. 36, pp. 571–580, 2003.
[LE 07] LE Q.V., MEFTAH F., HE Q.-C. et al., “Creep and relaxation functions of a
heterogeneous viscoelastic porous medium using the Mori-Tanaka homogenization scheme and a discrete microscopic retardation spectrum”, Mechanics of Time-Dependent
Materials, vol. 11, pp. 309–331, 2007.
[LIN 87] LINIERS A.D., “Microcracking of concrete under compression and its influence on
tensile strength”, Materials and structues, vol. 20, pp. 111–116, 1987.
[LOP 08] LOPEZ C.M.,CAROL I.,AGUADO A., “Meso-structural study of concrete fracture
using interface elements. I: numerical model and tensile behaviour”, Materials and
Structures, vol. 41, pp. 583–599, 2008.
[MAT 10] MATALLAH M.,LA BORDERIE C.,MAUREL O., “A practical method to estimate
crack openings in concrete structures”, International Journal for Numerical and
Analytical Methods in Geomechanics, vol. 34, pp. 1615–1633, 2010.
[MAZ 02] MAZZOTTI C.,SAVOIA M., “Nonlinear creep, Poisson’s ration, and creep-damage
interaction of concrete in compression”, ACI Materials Journal, vol. 99, no. 5, pp. 450– 457, 2002.
[MIH 96] MIHASHI H.,NOMURA N., “Correlation between characteristics of fracture process
zone and tension-softening properties of concrete”, Nuclear Engineering Design, vol. 65, pp. 359–376, 1996.
[MOU 02] MOUNAJED G., “Exploitation du nouveau modèle Béton Numérique dans
symphonie: Concept, homogénéisation du comportement thermomécanique des BHP et simulation de l’endommagement thermique”, Cahiers du Centre Scientifique et Technique