Open Archive TOULOUSE Archive Ouverte (OATAO)
OATAO is an open access repository that collects the work of Toulouse researchers and
makes it freely available over the web where possible.
This is an author-deposited version published in :
http://oatao.univ-toulouse.fr/
Eprints ID : 9965
To link to this article
: DOI:10.1504/IJMCDM.2013.053725
URL :
http://dx.doi.org/10.1504/IJMCDM.2013.053725
To cite this version
: Macary, Francis and Almeida-Dias, Juscelino
and Uny, Daniel and Probst, Anne Assessment of the effects of best
environmental practices on reducing pesticide contamination in surface
water, using multi-criteria modeling combined with a GIS. (2013)
International Journal Multicriteria Decision Making, vol. 3 (2/3).
pp.178-211. ISSN 2040-106X
Assessment of the effects of best environmental
practices on reducing pesticide contamination in
surface water, using multi-criteria modelling
combined with a GIS
Francis Macary*
Irstea,
ADBX Unit, 50 avenue de Verdun, F33620 Cestas-Gazinet, France E-mail: francis.macary@irstea.fr *Corresponding author
Juscelino Almeida-Dias
LAMSADE, Université de Paris-Dauphine,Place du Maréchal de Lattre de Tassigny, F75775 Paris, France
E-mail: judiascv@gmail.com
Daniel Uny
Irstea,
ADBX Unit, 50 avenue de Verdun, F33620 Cestas-Gazinet, France E-mail: daniel.uny@irstea.fr
Anne Probst
Laboratoire Ecologie Fonctionnelle et Environnement (EcoLab), Université de Toulouse,
INPT, UPS, ENSAT, Avenue de l’Agrobiopôle, 31326 Castanet-Tolosan, France
and
CNRS, EcoLab,
F31326 Castanet-Tolosan, France E-mail: anne.probst@ensat.fr
Abstract: For half a century, the significant development of intensive farming has led to a massive use of products such as pesticides. The excessive use of these substances has contaminated surface water and groundwater. Some drinking water extraction points have also had to be abandoned. Around 30 years ago, in the southwest of France, a group of farmers decided to improve their farming methods, as well as developing new best environmental practices, such as grass strips along streams and riparian forests. By combining
ELECTRE TRI-C, a sorting multi-criteria model, with a GIS, we were able to assign each farming parcel to one of the five levels of risk associated with surface water pesticide contamination. We also assessed the effectiveness of best environmental practices, and found that their use led to a reduction in the risk of pesticide transfer. This methodology re-enforces decision support tools for both water resource managers and agricultural and environmental stakeholders.
Keywords: best environmental practices; ECOPHYTO 2018; ELECTRE TRI-C; environmental risks; GIS; multi-criteria modelling; surface water contamination; pesticides; riparian zone; vegetative filter strip.
Reference to this paper should be made as follows: Macary, F., Almeida-Dias, J., Uny, D. and Probst, A. (2013) ‘Assessment of the effects of best environmental practices on reducing pesticide contamination in surface water, using multi-criteria modelling combined with a GIS’, Int. J.
Multicriteria Decision Making, Vol. 3, Nos. 2/3, pp.178–211.
Biographical notes: Francis Macary is an Agronomist and Researcher in the Environmental Sciences at Bordeaux Center of the French Public Institute of Sciences and Technologies for the Environment and Agriculture (Irstea). His principal research topics are: environment risk assessment according to agricultural practices focusing on the transfers of nitrogen, pesticides and total suspended solids on water. He uses also multicriteria analysis for decision aiding in the public environmental policies, at several spatial scales. He is a member of the specialist engineers in French Ministry of Agriculture. He has participated in several national and European investigation projects.
Juscelino Almeida-Dias has recently obtained his PhD in Industrial Engineering and Management of Lisbon University and Business Intelligence of Paris Dauphine University. His research interests are in ordinal classification, nominal classification, multicriteria clustering, multiple criteria decision aiding, operational research, electoral systems, project management, accounting, finance, family enterprises management, and learning management. He is now working in a consultant office in Paris for decision making aid. Daniel Uny is a Geomatician in the Amenities and Dynamics of Rural Areas Research Unit at Irstea-Bordeaux Center. He has participated in several French and European projects in support to different colleagues in the team. He uses different GIS softwares and remote sensing.
Anne Probst is a Senior Researcher in the ECOLAB Laboratory of Toulouse University, National Polytechnic Institute of Toulouse (INPT) and the National Center of Scientific Research (CNRS). She is a specialist in issues about geochemistry of the environment, hydrology, water pollution and soil contamination impacts, eco-forest soils. She has participated in several national and international investigation projects, recently in China and Russia and has published around a hundred papers in international journals and many books chapters.
This paper is a revised and expanded version of a paper entitled ‘Risk of water pollution in a small agricultural watershed in Gascony: assessment of the effects of environmental practices by a spatialized multicriteria modelling’ presented at 73rd Meeting of the European Working Group on Multi-criteria Decision Aiding, Corte, 14–15 April 2011.
1 Introduction – background
Since the second half of the 20th century, worldwide food production has seen a significant increase, particularly in countries with a high level of farming activity. This is due not only to advances in genetics, increased mechanisation, and improved farming techniques, but also a more widespread use of chemical products such as fertilisers and pesticides.
Unfortunately, while agricultural pesticides have improved agricultural productivity, they have also caused potential risks to human health and the environment (OECD, 2008). The risks vary greatly depending on a pesticide’s inherent toxicity (or hazard) and exposure. Exposure depends on a number of factors, such as the application method, weather after application, the environmental mobility and persistence of molecules, the characteristics of the ground (slopes, soil characteristics), proximity to bodies of water, and the nature of the hydrographical network.
The Organisation for Economic Development and Cooperation (OECD) (2008) has compared the use of pesticides for each member country by the indicator of overall sales of these products. The use of pesticides in developed countries declined by 5% over the period 1990 to 1992 to 2001 to 2003, but was marked by a large variation in trends between countries (measured in terms of the quantity of active ingredients). Agriculture accounts for 90% of all pesticide use, with some examples of other users being local councils, road and railway maintenance contractors, and members of the public for use in their own gardens.
Among the largest users of pesticides across the OECD, pesticide use increased in Italy, Mexico and Spain, while decreasing in France, Japan and the USA (where agriculture accounts for 75% of pesticide use). Together, these top-consuming countries accounted for around three quarters of total OECD pesticide use in 2001 to 2003. For example, in France (the world’s third largest consumer of pesticides) the overall quantity of pesticides (active products) sold was 95,300 tons in 1990 to 1992, 85 500 tons in 2001 to 2003 (OECD, 2008), and around 78 000 tons in 2008.
The OECD indicators show a link between the use of pesticides and risk levels. When more pesticide is used, contamination risks are increased, and when less pesticide is used, they are reduced.
Some studies have shown that tests are unfortunately not always being carried out in the most appropriate places – i.e., on farmland where pesticides are extensively used. Furthermore, indicators of pesticide sales are now less representative of the consequences for both human and animal health, and that of the environment. The reason for this is that over the last decade, it has become more common to replace traditional molecules with new ones, which are used in very small doses.
These new molecules are more difficult to accurately measure, and environmental managers therefore find it harder to monitor their presence in the natural environment. On top of this, their increased concentration makes them a great deal more toxic when coming into contact with water, even in very small quantities.
Since the early ‘80s, the European Community has gradually begun to control pesticide use, through various regulations to reduce their impact on the environment, and the likely risks to human health. Standards have been established for the maximum levels of pesticides in drinking water and food (EC, 1998). As part of the Common Agricultural Policy (CAP), the EC identified pesticides that could potentially damage the environment, as well as strengthening the toxicological and ecotoxicological criteria for
registration of plant protection products and marketing: Directive 91/414/EC replaced by Regulation No. 1107/2009 from 21/10/09 (EU 2009a). But, the intensive use of pesticides for four decades without any consideration for environment (and public health) have led to a major problem: many water systems have come to serious harm, and some pumping stations for drinking water have had to be closed down due to excessive concentrations of pesticide (Barriuso, 2004; Claver et al., 2006; Carvalho, 2006; IFEN, 2007). In view of this significant reduction in water quality, the European community decided to impose the Water Framework Directive (EC, 2000), which requires member states to achieve a rating of ‘good’ for the ecological and chemical quality of water bodies within their jurisdiction by 2015.
Directive 2009/128/EC (EU, 2009b) establishes a framework for community action to achieve a use of pesticides in keeping with sustainable development policies. It serves as a guide at national level. In France, the Ministry of Agriculture has created the Ecophyto 2018 plan (MAAPRAT, 2008), aimed at reducing pesticide risks. It demands a 50% reduction in the use of pesticides within the next ten years (2008 to 2018) and the removal from sale of around 50 different molecules that have been recognised as health hazards (MEDD-MAAPRAT, 2010).
European States are now subject to a results-based water quality policy, rather than one that simply specifies the means to be put in place. Farmers receive funding from the CAP but on the provision that they improve their agricultural practices.
For instance, the managers of water agencies in France have now decided to prioritise the protection of water pumping zones. It is no longer sufficient to achieve this goal by agricultural means alone, and environmental action must also be taken (IFEN, 2007; OECD, 2008).
This explains why the managers of water public institutions have also developed best environmental practices (BEPs) (FAO, 1994) in addition to best management practices (BMPs). Some examples of BEPs are vegetative filter strips (VFS) and riparian zones (RZ), along streams and rivers. These BEPs have been studied for around 20 years, and their assessment is essential in providing good advice to farmers.
Different studies have shown the positive effects of RZs in decreasing total suspended solids (TSS) in water (Schlosser and Karr, 1981). This is essential for the pesticide molecules adsorbed on the TSS. Hedgerows also have a significant influence on the surface runoff (Mérot et al., 1999). The main effect of BEPs is that a part of the catchment – up to 40% of the total area – is disconnected from the river course due to the presence of hedges, which behave like wells, collecting large amounts water and other substances.
Many experiments have demonstrated the effectiveness of VFSs in reducing the flow of pesticides in surface waters: in the USA (Misra et al., 1996; Schmitt et al., 1999); in France (Patty et al., 1997; Carluer et al., 2009). Along the sides of streams, the efficiency of the VFS depends on their width, the length of the watershed slope, and of course on their maintenance (CORPEN, 1997). The grass of the VFS retains the solid particles, and water containing dissolved products filters through to the roots, where microorganisms cause them to degrade. A RZ improves the efficiency of the whole buffer zone, when it is located between the stream and the VFS, (Gril and Lacas, 2004). Their efficiency depends on dominant hydrological processes: surface runoff, deep infiltration, lateral subsurface flow, tile drainage flow. A sound diagnosis at the watershed or the hill slope scale is necessary to optimise the design of a set of buffer zones in the area in question.
The French adaptation of the CAP regulations imposes a width of five to ten metres (Lafitte and Cravero, 2010).
In order to evaluate the decrease in the use of pesticides, different methods with indicators or hydrological models have been developed (Aurousseau et al., 1998, Centofanti et al., 2008, Gascuel-Odoux et al., 2009, Surgan et al., 2010).
BEPs are best evaluated using qualitative criteria, but the aforementioned methods use only quantitative figures. As a result, they do not effectively evaluate the effects of BEPs.
Other groups of methods called multi-criteria decision aiding (MCDA) methods, or multi-criteria decision analysis methods were developed in the 1970s (Roy, 1968). They have been used in several sectors (Schärlig, 1985, 1996; Roy, 1990; Roy and Bouyssou, 1993; Maystre et al., 1994). Since the early 1980s, these methods been tested with success on environmental management issues (Simos, 1990). Given the spatialised nature of environmental issues, it was not long before MCDAs were coupled with the use of a geographical information systems (GIS).
Our research aimed to assess the efficiency of BEPs as they apply to the problem of pesticide transfer into surface waters, using a MCDA sorting method, combined with a GIS.
Risk zone modelling of these types of agricultural and environmental practices is first and foremost of benefit to farmers and their advisers in the field. It is also useful to public environmental managers who are looking for advice on proven BEPs for water protection.
The objective of the project is two-fold: firstly to provide a risk-assessment method for each farming parcel (the level of decision for farmers) and secondly to assess the BEPs, taking into account all relevant criteria.
This method is suitable for use in an environmental context, and can also be used for a wide variety of other purposes. Before using this method in different regions, we tested it in a small watershed in the southwest of France, located around the village of Auradé, where intensive farming is commonplace. There is a local agricultural association of 36 members who work together to improve farming methods, and reduce their impact on the environment. The willingness of the local farmers and advisers to embrace changes was a key factor in choosing this location.
In Section 2, we will introduce our study site and the different criteria considered, along with the multi-criteria modelling and interaction between the GIS and MCDA sorting methods. In Section 3, we will present our results regarding the effect of BEPs on pesticide risks, along with a general discussion.
2 Equipment and methods
After defining the study site, we will present an overview of the chosen sorting method, the interaction between the GIS and MCDA methods, and the modelling method, as it was applied to pesticide transfer risks.
2.1 Study site
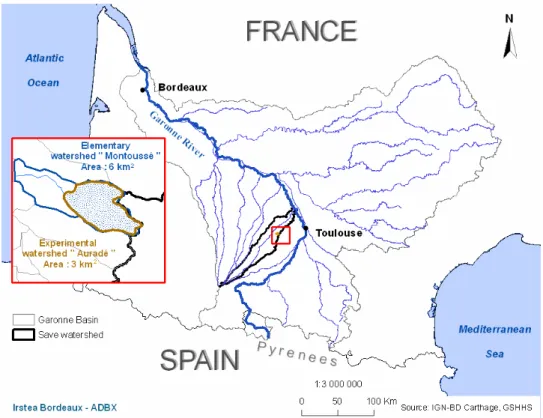
The study site is located in the southwest of France, in the Coteaux de Gascogne area, which is part of the hydrographical basin of the Adour and Garonne Rivers (Figure 1).
The Gascony area is drained by 17 rivers. These rivers are all left tributaries of the Garonne River, located between the Pyrenees and the Atlantic Ocean. All rivers have their source in the Lannemezan plateau, in the Pyrenees piedmont. Some of their watersheds cover several thousand square kilometres.
Our test site was the small Auradé watershed (Montoussé stream), near Toulouse, which is located in the 1,150 km2 catchment area of the River Save.
Divided into approximately 90 agricultural parcels, this small watershed covers an area of 330 ha. It is used by 12 farmers. The local climate is influenced by the proximity of the Atlantic Ocean and the Pyrenees, with the Mediterranean also having a slight effect. The annual rainfall is around 700 mm, with evapotranspiration of 820 mm.
Figure 1 Location of the study site (Southwest of France) (see online version for colours)
During stormy periods, drained water can cause the transfer of soluble contaminants. Temperatures are generally higher in the summer, reaching an average of 25°C in July and August. 50% of this agricultural land has slopes steeper than 15% (Appendix B), which contributes greatly to the runoff phenomenon.
The geological substratum is essentially impermeable, which is very favourable to the phenomena of surface and subsurface runoff, and contaminant transfer into streams.
Figure 2 Aggregation of soil types in Auradé Watershed into four main categories (see online version for colours)
The soil type is predominantly non-permeable clay-limestone (Figure 2), with most transfers taking place as a result of runoff.
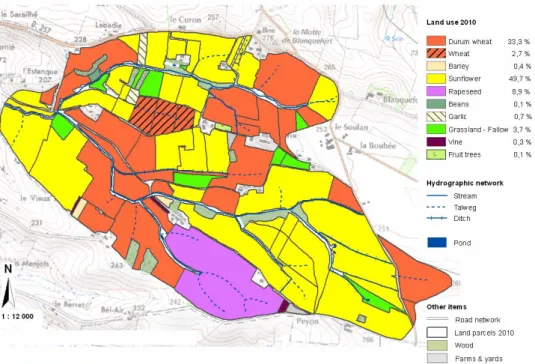
The Auradé area is characterised by intensive agriculture. The dry climate and difficulties in irrigating the slopes mean that the main crops tend to be cereals (36% total land use), sunflowers (50%) and rapeseed (9%). These are shown in Figure 3. The crop rotation is very short on each farming parcel (typically two or three years) and inputs like nitrogen, pesticides are higher, in order to obtain optimum yields.
These data are indicative of an intensification in the local farming system. The plots themselves are large, often more than ten hectares each. This is due to widespread deforestation that took place after a rural exodus around 50 years ago, to make way for cereal crops, and ever larger pieces of farm machinery.
The intensification of agricultural practices has led to a general degradation of the surface water quality (Agence de l’Eau Adour-Garonne, 2009). In the entire region, only 12% of the surface water stations met the requirements for drinking water production. A further 55% were able to comply after treatment, and 33% were unable to comply. In rivers, 98% of the stations had at least one molecule detected, and 87% had at least one result greater than 0.1 μ/l (the maximum for a single type of molecule in water destined for public consumption; 0.5 μ/l is the maximum for the sum of the concentrations). Across all of the stations, 98 molecules were found (out of a list of 140 looked for during tests). The most common molecule was AMPA (breakdown product of glyphosate, an herbicide used in field crops, vines, fruit trees and non-agricultural areas. It was found in more than 43% of samples. S-metolachlor, which replaced atrazine herbicide in 2003, was detected in 37% of cases. These are the two most abundantly sold molecules in the Adour-Garonne river basin.
The environmental situation of water quality is still worrying and made even more so by the fact that water destined for public consumption is obtained from these rivers through pumping stations. The main water pumping station of Save River serves 20,000 inhabitants, and is located 5 km2 from the ‘Auradé’ watershed. This prompted the water
agency responsible for the Adour-Garonne area to make provisions for the protection of watershed areas from pollution (Agence de l’Eau Adour-Garonne, 2009).
This experimental watershed is a commonly used reference by water institution managers in analysing surface water contamination as part of an intensive cropping system.
Measures designed to reduce water contamination were already in force in the area where we carried out our study. Financial incentives were mainly targeted at reducing river pollution, a policy which was initially tested on certain watersheds, including ours.
Studies have been carried out on nitrogen transfer in this area for 25 years: Nitrate measurements were initially carried out in the Montoussé stream (Auradé watershed) in 1985 by AZF Toulouse (now GPN-TOTAL Company) to assess the impact of agricultural practices and landscape management on nitrate concentrations in streams. Since 1995, pesticides have been measured at the outlet and intensive environmental research has been carried out for about ten years. Since 2004, major and trace elements, suspended matter, carbon and nutrients have been measured at the stream outlet and in rainwater and soil solutions for the main parameters (and more recently for stable isotopes). The geochemical behaviour of nitrates, metals and pesticides has been investigated at the solum and watershed scales, particularly in relation to the hydrological regime and to agricultural practices (Bur et al., 2009; Ferrant et al., 2011; N’Guessan et al., 2009; Taghavi et al., 2010, 2011).
2.2 An overview of the chosen sorting method
The aim the study is to assign each agricultural parcel to a risk level according to pesticide transfer.
This critical task can be carried out using a multi-criteria sorting method. This section presents the main related MCDA concepts, and an overview of the chosen sorting method.
2.2.1 Concepts, definition, and notation
To fully understand the MCDA, there needs to be a co-constructive interactive process between those carrying out the analyses, and agronomists’ experts is required.
We consider that A = {a1, a2, …, ai, …}, which represents a set of potential actions,
i.e., a group of agricultural parcels. These parcels must be analysed in terms of the pesticide transfer risk. These agricultural parcels in turn belong to the Auradé watershed, where farmers make their own decisions regarding land use and agricultural or environmental practices. This is also the decision level at which environmental managers can influence farmers in changing their agricultural practices and arrangements. This set can be known a priori in its entirety, or it may appear progressively during the decision aiding process.
The farming parcels are evaluated based on a coherent set of criteria, denoted
F = {g1, g2, …, gj, …, gn}, with n ≥ 3. Therefore, gj(a) represents the performance of the
agricultural parcel a according to the criterion gj, j = 1, …, n. In the pesticide transfer
context, a criterion is a tool representing a physical process for evaluating and comparing farming parcels according to the surface water contamination risk.
Each criterion gj must be either associated with an increasing preference direction or a
decreasing preference direction. In the latter, it means that the preferences increase when the performances decrease, and in the former, it means that the preferences increase when performances also increase. Moreover, each criterion is also associated with an ordered preference scale which contains all the possible performances of an agricultural parcel based on such a criterion, taking into account the pesticide transfer context. The criteria are also associated with two discriminating thresholds (called indifference and preference thresholds, denoted qj and pj, respectively, j = 1, …, n). These thresholds help to take into
account the imperfect character of the performances of each agricultural parcel as well as some arbitrariness when building sets of criteria.
The aggregation of the performances of each farming parcel is obtained through the so-called ‘power of the criteria’, which is defined by the relative importance coefficients, or weights, denoted wj, j = 1, …, n, and, optionally, the veto thresholds, denoted vj, j = 1,
…, n, which are used to manage critical values on a certain criterion (Mousseau, 1993; Roy, 2001).
2.2.2 An overview of ELECTRE TRI-C
ELECTRE TRI-C (Mousseau et al., 2000; Almeida-Dias et al., 2010) was designed to be used within the framework of a constructive approach. This decision-aiding sorting method must be applied in contexts where categories are fully ordered (from the worst to the best, for instance).
Each category must be defined a priori to receive actions (e.g., farming parcels), which will be or may be processed in the same way (at least for the first step). The definition of each category is based on a unique characteristic reference agricultural parcel, because their performances on the criteria are the most representative for assessing the corresponding risk level.
When using the ELECTRE TRI-C method (Almeida-Dias et al., 2010), the objective is to assign the actions to a set of completely ordered categories, denoted {C1, C2, …, Ch,
…, Cq}, with q ≥ 2. Assuming that C1 represents the worst category (highest risk) and Cq
represents the best category (lowest risk), the assignment of a farming parcel to a risk category Ch is based on a comparison between the performances of this parcel in all
criteria and those of each characteristic reference parcel bh in each risk category.
The ELECTRE TRI-C assignment results are based on the outranking credibility indices, denoted σ(a, bt), (Almeida-Dias et al., 2010) which are compared to a chosen
credibility level, denoted λ. This level is a minimum degree of credibility which is considered or judged necessary by the agronomists’ experts to validate (or not) the statement ‘a outranks b’ (meaning that a is at least as good as b) taking all the criteria from F into account.
In general, this minimum credibility level has a value within the range [0.5; 1] and it can be roughly interpreted as a majority level, as in the voting theory.
In order to preserve the role of the characteristic reference agricultural parcels, ELECTRE TRI-C makes use of a selecting function, denoted ρ(a, bh) to choose between
two consecutive selected categories. This decision-aiding sorting method is composed of two joint rules, called the descending rule and the ascending rule (which must be used together and not separately), since they are not significantly different when applying a transposition operation.
According to the descending rule selection process [Figure 4(a)], if we start the pairwise comparison on the best characteristic reference action, either category Ct or
category Ct–1 can be selected by making use of the chosen credibility level. The selecting
function is then used to make a choice between Ct and Ct+1, or between Ct–1 and Ct. Figure 4 Assignment process in ELECTRE TRI-C, (a) descending rule selecting process
(b) ascending rule selecting process (see online version for colours)
(a)
The descending rule consists of choosing a credibility level λ (0.5 ≤ λ ≤ 1) and decreasing the number h representing the risk category considered, from the max value (q + 1) until a value t, such that σ(a, bt) ≥ λ. The unique category is obtained as follows:
a where t = q, Cq is a possible category to assign action a
b where 0 < t < q, if ρ(a, bt) > ρ(a, bt+1), then Ct is a possible category to assign a;
otherwise, select Ct+1
c where t = 0, C1 is a possible category to assign a.
According to the ascending rule selection process [Figure 4(b)], if we start the pairwise comparison with the worst characteristic reference action, either category Ck or category
Ck+1 can be selected by making use of the chosen credibility level. Then, the selection
function is used to make a choice between Ck and Ck–1, or between Ck+1 and Ck.
The ascending rule consists of choosing a credibility level λ (1/2 ≤ λ ≤ 1) and increasing the number h, representing the same risk categories considered, from zero until the first value, k, such that σ(bk, a) ≥ λ. The unique category is obtained as follows:
a for k = 1, C1 is a possible category to assign action a
b for 1 < k < (q + 1), if ρ(a, bk) > ρ(a, bk–1), then select Ck is a possible category to
assign a; otherwise, select Ck–1
c for k = (q + 1), Cq is a possible category to assign a.
Each one of these rules selects only one category to which an agricultural parcel can possibly be assigned. They are used conjointly in order to highlight the highest and the lowest appropriate category to receive an agricultural parcel. These two categories can be the same. When they differ, this means that the assignment of such an agricultural parcel is based on a range of possible categories, taking into account the way in which the set of characteristic agricultural parcels defines the categories. Experts with a good knowledge of the site (agronomists in this project) must validate the category chosen.
2.3 Interaction between GIS and MCDA
GIS have been increasingly widely used in spatial analysis for environmental problems over the last 20 years, and many scientific papers have been written with regard to the relationship between MCDA modelling and GIS. Chakhar and Martel (2003) presented a strategy for integrating GIS and MCDA. Malczewski (2006) carried out an important survey of literature with regard to GIS combined with MCDA and their many applications.
Combinations between GIS and MCDA methods have been applied in several professional fields: agricultural land use (Janssen and Rietveld, 1990; Arondel and Girardin, 2000; Ceballos-Silva and López-Blanco, 2003; Chen et al., 2010; Macary et al., 2010a, 2010b), for assessment of soil loss, consequences of erosion (Laaribi, 2000; Cavallo and Norese, 2001), for local development problems (Joerin et al., 1998), for land management (Joerin and Musy, 2000), for locating suitable sites to dispose of radioactive waste (Carver, 1991), for planning landfill sites (Sumathi et al., 2008), choosing wind farm sites (Baban and Parry, 2001), urban corridors (Chakhar and Mousseau, 2008), and forest fire risks in the Mediterranean region (Pasqualini et al., 2011).
These methods of analysis and decision support are well suited to agro-environmental issues. They allow both quantitative and qualitative criteria to be taken into account. We
also connected a GIS (ArcGis®) with a MCDA method (ELECTRE TRI-C), especially
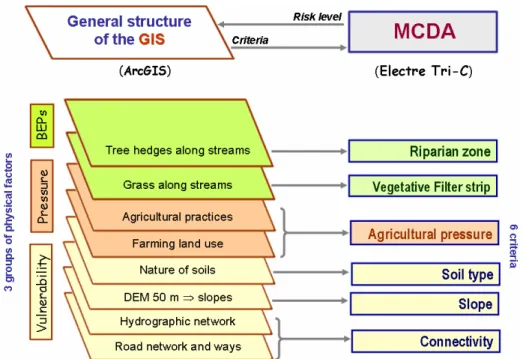
for the environmental application of risk assessment. The general diagram of the methodology (Figure 5) shows the interaction between the GIS and the MCDA method.
The ArcGis® software is a very effective tool, and is used by many research institutes,
as well as by specialist consultancies, who appreciate its powerful spatial analysis and calculation capabilities. We used ArcGis 9.3® for spatial processing, and previously used
ArcInfo® to digitalise the cadastral layer of different plots of land. Due to the integration
of qualitative criteria, and the way in which the data needed to be sorted, we used the ELECTRE TRI-C method.
Figure 5 General diagram of the method combining GIS and MCDA (see online version for colours)
It is important to note that our aim was to develop a method for both quantitative and qualitative data, such as that obtained through meetings with stakeholders and observations in the field. This explains the need for a complete MCDA method that is properly suited to the needs of the study. We avoided using a GIS with an integrated and incomplete MCDA, which is less effective, and often unsuitable for handling this kind of data.
The GIS was used to integrate some quantitative data, and to carry out spatial processing, for instance, the slopes in relation to the location of different farming parcels. Some criteria scores were directly calculated through the GIS (details in Section 2.4). Following this, MCDA modelling is carried out separately, because some qualitative criteria (for instance, the BEPs) cannot be directly modelled with the GIS (the reasons for this are explained in Section 2.3.1). The parcels of land are then assigned by the MCDA model, and manually by the operator when the model cannot decide between two solutions. For the environmental risks, common practice is to create five categories: very low, low, intermediate, high, and very high.
For visual representation of the results, a link was made between the GIS parcel table and the MCDA results. These results were then shown on a map along with the percentage of arable land for each risk category. They were discussed with the relevant stakeholders and technical experts for the area in question. If necessary, other treatments are then carried out. These results are useful for environmental managers when proposing the implementation of BEPs and the associated subsidies. They can also help illustrate to local stakeholders (farmers and advisors) the advantages of these improved practices.
2.4 Modelling the set of criteria
In order to fully understand the information concerning the use of pesticides and the associated risks to surface water quality, it is first necessary to understand how agri-environmental risks are established. These contamination risks come from a combination of water being vulnerable to pollution (e.g., pesticides) and agricultural pressure (treatments applied to different crops).
The key environmental issues are the conservation, preservation, and rehabilitation of various uses of water resources (CORPEN, 2003). This paper focuses on the general pesticide problem in surface water treated for human consumption. When pesticides are applied to plants or to the soil surrounding them, there are different ways in which molecules can be transferred. This depends initially on their chemical properties, namely whether they are soluble or insoluble in water (Barriuso, 2004).
Figure 6 Various criteria analysed for the assessment of pesticide risks and BEPs effects (see online version for colours)
Environmental conditions also play a role in water vulnerability. This is due to the steepness of slopes, the nature of the hydrological network for surface runoff, soil types (controlling subsurface runoff and infiltration), and geological characteristics. Human
intervention also has an effect. This can be defined as land use, farming methods, and BEPs, such as VFSs and RZs.
A general flowchart of these risk factors is presented in Figure 6. The diagram shows the correspondence between physical factors analysed with their consideration in the MCDA modelling, in the form of criteria.
In order to assign a set of actions to a category, their performance under the criteria must first be considered. This is the evaluation stage. Performance of parcels for each criterion was either the result of direct measurement in the field, or was calculated on the basis of mapping data or surveys via a GIS.
One major principle of multi-criteria analysis presupposes that criteria are not connected, and that they must be considered separately, without any common information (Roy and Bouyssou, 1993; Mousseau, 1993). This of course excludes any combination representing a first degree of analysis, which could then disrupt sorting of the farming parcels. On the other hand, a weighting system given to each criterion (cf. 2.7) can modify their significance, for the role it plays in pesticide transfer, or its limitation by the BEPs.
We selected six criteria for the multi-criteria model, according to their recognised importance in relation to the phenomena being studied, and of course according to whether it was possible to provide appropriate information for all the agricultural parcels: a First group – vulnerability of surface water:
• effect of combination of slopes and areas of the parcels: quantitative criterion • connectivity between the parcels and the stream: qualitative criterion
• nature of soils: qualitative criterion
b Second group: agricultural pressure (pesticides applications in this paper):
quantitative criterion
c Third group: reduction of contaminant transfer into surface waters: • VFSs between the parcels and the stream: qualitative criterion • RZs beside the stream: qualitative criterion.
For each criterion, the highest scores given were associated with the highest risk.
Criterion g1 – combination of homogeneous slopes with their calculated surface Slopes promote surface water runoff and thus the transfer of contaminants. This is an important natural factor in the approach to agri-environmental risks. Performance values do not record the average slope of a parcel, because it does not make sense in the process of physical transfer. Indeed, this is due to many deformations of the microrelief, in each farming parcel. Because of this, we calculated an index which takes into account the contribution of homogeneous slopes and their representative surface in each parcel.
We calculated this performance with the GIS (Appendix B).
On the basis of a DEM at 25 m extrapolated to a precision of 10 m, each parcel was broken down into polygons u of uniform slope Pu and their surface area Su (Appendix C).
We attributed the performance of the criterion g1 for a parcel, by calculating Σ (Pu ×
Su). This combination takes into account the whole surface area of a parcel in a criterion,
quantitative nature. The higher the index value, the more a parcel’s microrelief contributes to runoff.
Criterion g2 – soil type
Different soil types influence the flow mode of contaminants: partial retention on the ground, runoff, and infiltration into the subsurface or into groundwater. According to the World Reference Base, 12 different soil types were determined through soil analysis in 2006 (SOL CONSEIL-EcoLab) (Appendix D). Cambisols accounts for 80% of the soil types present within the test area. This type of soil has almost entirely impermeable molasse bedrock (Bur et al., 2009). We divided this set of soils into four groups, selected during modelling. This allowed us to simplify scores, and interpret the final results (Figure 2). The groups are: A (Epileptic Cambisols-Rendzic-Leptosols (< 50 cm); B (Calcaric-Cambisols > 50 cm); C (Cambisols-Luvisols); and D (Fluvisols). The scores for the criterion g2 in each parcel consider the four soil types and their corresponding
surface area. They were established as follows:
(
1 2 3 4)
Score of soil type %S A *8 %S B* 4 %S C*2 %S D*1 /100
(Sx represents the area of each type of soil per parcel)
= + + +
Criterion g3 – connectivity of each agricultural parcel to the stream
The conditions of connectivity have an effect on the transfer of pollutants. With a GIS, we can generally integrate the distances between the potential points of contamination and the streams automatically. However, it is not possible to take into account another important factor: the nature of connectivity. The advantage of the MCDA method is that it allows us to note qualitative elements previously observed on the watershed (Appendix E) as follows:
• 9 – ‘very high’ connectivity, increasing the risk of pesticide transfer (edge of the streams with some drains)
• 8 – ‘high’ connectivity: parcels wholly situated along the edge of a stream • 8 – ‘high’ connectivity: parcels of which a section is situated along the edge of a
stream
• 5 – ‘intermediate’ connectivity: talwegs and ditches • 3 – ‘weak’ connectivity (roads and paths)
• 1 – ‘very weak’ connectivity : very weak or no connectivity.
Criterion g4 – vegetative filter strips (VFSs) effects
The VFS is a vegetative strip used along streams in the lower parts of parcels, decreasing the transfer of soluble contaminants to the stream. However, the effectiveness of this solution depends on its width and serviceability, which was considered in the field as follows: As with g3, the MCDA method allowed us to register these indications and
implement them in the modelling process, thus representing the level of protection in the various streams. Values are indicated in Table 1.
Table 1 MCDA scores for the effectiveness of VFSs
Width Quality Protection level MCDA score
≤ 3 m Bad Very weak 15
Good 14 ]3; 5 m [ Bad Weak 12 Good 11 [5; 7 m [ Bad Average 9 Good 8 [7–9 m [ Bad High 6 Good 5
≥ 9 m Bad Very high 3
Good 2 No interest Parcel, far from the stream 0
Criterion g5 – riparian zone (RZ)
A RZ is a wooded area along the side of a stream. A good RZ improves the protection of streams and decreases contaminant transfer (Mérot et al., 1999). The effectiveness of this type of zone depends on the density of its vegetation. Its role complements that of the VFS. It is integrated into our analysis in terms of its characteristics and length. In the Auradé watershed, RZs along the streams are generally moderate, but certain places benefit from the protection of a denser wooded zone. Values are indicated in Table 2.
Table 2 MCDA scores for RZs
Importance of riparian zone Description MCDA score
[0%–10%[ No tree 10
[10%–25%[ Weak protection, just some trees 9
[25%–50%[ Passable protection 7
[50%–75%[ Average protection 5
[75%–100%[ High protection 3
100% Very high protection 2
No interest Parcel, far from the stream 0
Criterion g6 – agricultural pressure: pesticides
We characterised the agricultural pressure according to nitrogen, pesticides and TSSs due to land use and agricultural practices. This paper focuses only on pesticide problems.
The risk assessment for the transfer of pesticide molecules into a stream is carried out based on the way in which chemicals are sprayed on each crop. The idea here is to consider the pesticide indicator calculated at the farming parcel level: TFI or treatment frequency index. TFI is used in France to track the evolution of pesticide use.
Applied dose Treated surface TFI
Registered dose Total surface of parcel
× =
We calculated this index based on land use and farming practices in 2009 and 2010. This calculation was carried out for each parcel, as crop spraying methods vary between farmers.
Some very small parcels of vine and fruit trees are cultivated solely for family consumption, but because of their location, and the large amount of pesticide used on them, they cannot be excluded.
TFI values calculated from inquiries in the field are: durum wheat (1.73 to 3.97), bread wheat (1.84 to 2.97), barley (2.63), sunflower (0.56 to 2.43), rapeseed (4.66), beans (small surface) (5), garlic (small surface) (3.70 to 4.50), vines (family consumption) (10), fruit trees (family consumption) (10), grassland – fallow (0).
As shown in the 2010 land use map (Figure 3), wheat and rapeseed crops that receive most of pesticides, occupy 45% of the land; sunflower: almost 50%. Because crop rotation is very short there – only around two years – this explains the intensive cropping system, as mentioned in Section 1.
The performance matrix resulting from these multi-criteria evaluations is showed in Appendix A.
2.5 Modelling the set of categories
Firstly, we defined some ordinal classes, or risk categories, which have a clear meaning in a decision aiding context. Each category has been designed to group together agricultural parcels, whose risk levels must be processed in the same way.
Five categories were selected by our expert agronomists, which is the traditional number of categories for environmental risk assessments. This set of categories is organised on a scale, going from the highest risk level (C1) to the lowest risk level (C5).
Each category is characterised by a virtual benchmark parcel called ‘reference action’, bh
(Table 3).
Each parcel is compared to the appropriate benchmark in order to judge its intrinsic characteristics. These characteristics are not compared with those of the other parcels, as opposed to the ranking method (ELECTRE III) where each parcel is compared with every single other parcel (Macary et al., 2010b).
Table 3 Performances of the characteristic reference parcels, for the five categories
Ch Risk level meaning bh Slopes/areas g
1 Soils g2 Connexion g3 Vegetative filter strips g4 Riparian zones g5 Pesticide pressure g6 C1 Very high b1 1,000,000 7 9 14 9 4.5 C2 High b2 500,000 5 8 11 7 3 C3 Intermediate b3 300,000 3 5 8 5 1.75 C4 Low b4 200,000 2 3 5 3 0.75 C5 Very low b5 100,000 1 1 2 2 0.25
2.6 Modelling data imperfections and arbitrariness
Not all elements within the performance matrix are determined with absolute accuracy. Because of this, thresholds were introduced into the ELECTRE models, called ‘indifference’ (q) and ‘preference’ (p) thresholds. Two actions (farming parcels) can be
indifferent according to the criterion gj, which is controlled by the indifference threshold.
The indifference threshold is the point at which two actions are no longer regarded as having comparable performance. One parcel can also be strictly or non-strictly preferred over another. This function is controlled by a preference threshold, called pj. The
preference threshold sets the performance differential which causes one action to be preferred over another, based on the criteria gj. Both of these thresholds can explain weak
or strong differences.
The Indifference threshold (qj), or Preference (pj) of the performance gj (a) of the
farming parcel (a) according the criteria j, is an affine function including two coefficients α and β:
[
j( )]
( ) and[
j( )]
( ) .j g a j j g a j
q = ×α g a +β p =αg a +β
The values of the two coefficients α and β are specified by criteria and for each threshold.
These coefficients can be calculated as a function of the worst or the best performances of (a) and (b).
The general principle of the outranking method is summarised in Appendix F.
For the values of criterion 1 (homogeneous slopes and surfaces), we allocated the coefficients q1 (α, β) and p1 (α, β) such that: q1 (0.035; 0) and p1 (0.055; 0), according to
the values obtained in the performance matrix. Performance values are continuous, and have a high amplitude, which explains why thresholds are directly dependant on performances. β = 0, because in this case, it does not provide further accuracy.
For the other criteria, we decided not to link thresholds to performances, given that values are discrete for criteria 2, 3, 4 and 5 with low values. In the case of criterion 6 (pesticide pressure), values are continuous but in a scale of low values.
Table 4 shows the retained values of indifference threshold and preference.
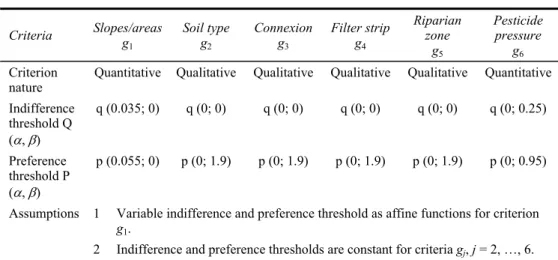
Table 4 Values of the thresholds of indifference (Q), preference (P)
Criteria Slopes/areas g 1 Soil type g2 Connexion g3 Filter strip g4 Riparian zone g5 Pesticide pressure g6 Criterion
nature Quantitative Qualitative Qualitative Qualitative Qualitative Quantitative Indifference threshold Q (α, β) q (0.035; 0) q (0; 0) q (0; 0) q (0; 0) q (0; 0) q (0; 0.25) Preference threshold P (α, β) p (0.055; 0) p (0; 1.9) p (0; 1.9) p (0; 1.9) p (0; 1.9) p (0; 0.95)
1 Variable indifference and preference threshold as affine functions for criterion
g1.
Assumptions
2 Indifference and preference thresholds are constant for criteria gj, j = 2, …, 6.
2.7 Modelling the role of the criteria
The various criteria have effects of differing importance on contaminant transfer. This means that weighting must be applied to optimise MCDA modelling.
We used the SRF software (Figueira and Roy, 2002) to assign numerical values to the different weights of the criteria, with expert agronomists helping us to implement the model. This procedure used the ordinal nature of the criteria scales, meaning that the units and the range of scales have no effect when evaluating the importance of the coefficients.
The obtained weights were validated by the experts, following some experiments using spatial visualisation of the risk level and taking into account their knowledge about the studied watersheds. The results of this are explained in Table 5.
Table 5 Weights of criteria using SRF procedure
Criteria Slopes/areas g1 Soil type g2 Connexion g3 Vegetative filter strip g4 Riparian zone g5 Pesticide pressure g6 Weights (%) 18 6 23 13 10 30
Notes: The weights of the criteria were determined by using the SRF software (Simos-Roy-Figueira), with agronomists’ experts.
CR1 + CR2 + CR3 = Vulnerability => 47% of the weights sum CR4 + CR5 = BEPs => 23% of the weights sum
CR6 = Pesticide pressure => 30% of the weights sum
We used also a veto threshold (vj) to apply the notion of discordance, only used for the
pesticide criterion. With this threshold v6 (0; 3), if a certain action b is better than action a
in a specific criterion, it will be considered better than a in all other criteria. In this application, for instance, grassland never receives pesticide; therefore it must be only assigned to a very low risk level. However, its physical properties and its location close to the stream could place it in the intermediate risk band, despite their being no pesticide.
2.8 Validation of a risk level
The credibility level λ is a minimum degree of credibility (based on its criteria weighting) which is considered necessary for validating or refusing the assignment of an action within a particular category.
The statement ‘a outranks b’ (meaning that ‘a’ is at least as good as ‘b’, or a must be at least assigned to the same risk level as b) takes into account all the criteria from F. This minimum credibility level must be between 0.5 and 1.
We chose the high level of λ = 0.7, which means that an outranking statement can only be validated when the weights of criteria concerned represent 70% of the whole.
3 Results and discussion
3.1 Assignment of agricultural parcels according to pesticide risk and the effect of BEPs
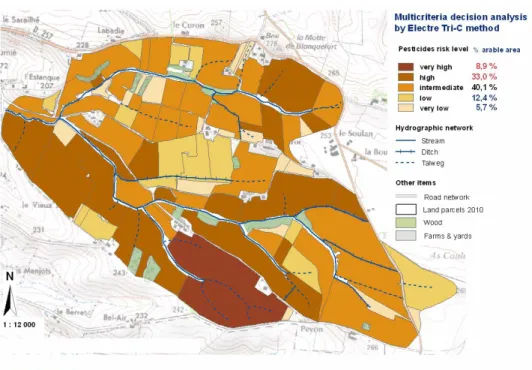
This section presents the spatial visualisation of the ELECTRE TRI-C assignment results, by using the interaction between MCDA modelling and the GIS spatial structure. Figure 7 shows results with the effect of BEPs in decreasing pesticides transfer to
streams. In 2010, very high and high risk levels represented a very significant 42% of all farmland within the watershed.
Figure 7 Auradé watershed: spatialised results of MCDA modelling for pesticides with effect of BEPs (see online version for colours)
A further 40% fell into the ‘intermediate risk’ category, while a mere 18% of agricultural land was classified as ‘low risk’ and ‘very low risk’
Even with some BEPs along the streams, pesticide risks are high. It is clear that large parcels, those with steep slopes, and those where land use necessitates more chemicals, tend to fall into the ‘high’ and ‘very high’ risk categories.
There were two parcels where our experts did not approve the results. In one of these, a very vulnerable area of grassland, the model gave an ‘intermediate’ classification, but the experts considered it to be ‘low risk’ due to the absence of chemical treatment. It was therefore placed in category 5.
For the second parcel, which contained sunflowers, the model understandably chose category C3 (intermediate risk) but this decision was overridden by the experts, who gave
it a C4 classification, due to low connectivity with the stream, and a very light use of
pesticides.
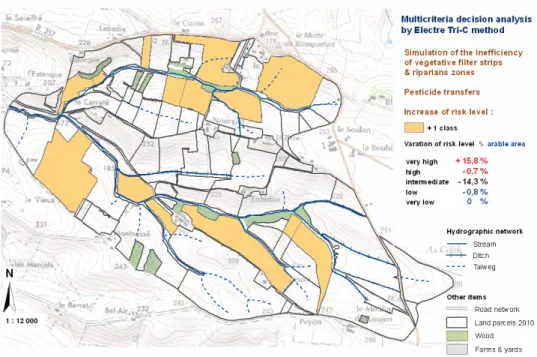
We also simulated the presence of BEPs, but without any effect. ‘Very high’ and ‘high’ risk categories now account for 57% of all farmland in the watershed, with only 26% in the ‘intermediate’ bracket. This shows that due to the absence of protection along the streams, some ‘intermediate’ parcels now have a higher risk level. Figure 8 shows these differences. ACR1 is 65.5% and ACR2 is 94.3%.
Figure 8 Auradé watershed: agricultural parcels with a risk increase, without any BEPs effect (see online version for colours)
3.2 Sensitivity and robustness of the results
In order to test the sensitivity and robustness of the modelling, we modified the main parameters (criteria weighting and credibility level index).
UC represents the percentage of actions directly assigned by the model to one risk category. In the test described in this paper, UC was 65.5%. The accuracy level ACR1 shows the percentage of actions directly assigned to a category by the model, and then further verified by experts. The ACR1 for Auradé was 64.4%, which is a high value. The final measurement of accuracy is ACR2, which shows the level of accuracy in the assignment of all actions to all categories, when verified by experts. ACR2 in this case was 97.7%.
We then observed the accuracy measurements UC, ACR1, and ACR2. The results are showed in Appendix G.
In Weighting 02, the overall accuracy of the results (%ACR2) is close to W01, but
ACR1 is very low.
This shows that the decision-making part of the model is very weak, and requires a great deal of input from experts.
In Weighting 03, the weighting of pesticide pressure increases by %UC and %ACR1 because criteria assignment is easier. However, the overall accuracy of the results is reduced due to an excessive pesticide weighting.
The same results were obtained with lower BEP weightings (W04 and W05). The weightings used in this test were lower than those given by experts when weighting base.
Where W01 concerned soluble substances, we tried to weight W06 to take into account insoluble particles. The results show that the experts did not accept these assignments. This shows that W01 was superior to W06 and all other categories.
These tests confirmed the sensitivity of the ELECTRE Tri-C model with regard to changing parameters. They also show the ability of the model to handle a wide variety of values, including input from expert agronomists, BEPs, and the weighting of soluble molecule transfer.
We carried out tests by modifying the value λ (credibility index) from 0.55 to 0.75. We observed the two measurements ACR1 and ACR2. Where λ < 0.70, ACR1 is higher than where λ ≥ 0.70, because the assignment procedure is easier, but for ACR II, the opposite is the case (Appendix H).
The advantage of multi-criteria modelling is that we can obtain the best possible results (measured with ACR2) along with a high level of efficiency (ACR1, with results checked by experts).
This explains our choice of λ = 0.70: two thirds of actions are directly assigned to a unique category by the model, and then validated by experts. With this calibration, we can obtain an ACR2 value of 98%.
3.3 Discussion
3.3.1 Implementing the six criteria
All six criteria chosen correctly represent the vulnerability of surface water and anthropogenic pressure exerted by agricultural pesticides. The main advantage of multi-criteria modelling is that we can take into account not only quantitative action performance scores, but also qualitative data, something that is impossible with, for example, a hydrological model.
Criterion g1 – combination of homogeneous slopes with their respective
calculated surfaces
Taking into consideration the slope and surface of parcels is essential in assessing the contribution of each parcel to pollutant transfer. This has previously been shown to be the case with erosion and particle transfer into surface water (Macary et al., 2010b). In addition to this, in a hilly region, where the slopes of a particular parcel can be angled in different directions, it makes no sense to use an average slope value. It is far better to consider the contribution of each area located on a particular slope within a parcel.
Criterion g2 – soil types
Soil types were divided into four groups (criteria 2) in this small watershed, because it is impossible to score 12 different soils in the performance matrix of a multi-criteria model. This is made more difficult by the fact that 80% of these soils are cambisols. By taking their main properties into account (Revel and Guiresse, 1995), we were able to give them a score at the parcel level.
Criterion g3 – connectivity of each agricultural parcel to the stream
CAP now requires these strips to be installed, with a minimum width of five metres (Lafitte and Cravero, 2010). Different studies have shown that in order to be effective, they need to be at least 7 m in width, and well maintained (Misra et al., 1996; CORPEN, 1997; Schmitt et al., 1999; Gril and Lacas, 2004; Carluer et al., 2009).
The connectivity of each parcel to the stream is easiest to analyse within a small watershed such as Auradé. The different types of connectivity were observed for each parcel, and scored using very stringent values. This methodology was first used in an erosion context (Macary et al., 2010b).
Criteria g4 and g5 – VFSs effects and RZs
They have been scored according their qualitative characteristics. This is one of the main reasons for using multi-criteria modelling methods for environmental issues (Joerin and Musy, 2000; Laaribi, 2000).
The advantages of BEPs: Despite the presence of VFSs and RZs, 42% of the total farmland within the Auradé watershed falls into the ‘high’ and ‘very high’ risk categories for pesticide transfer. Taghavi et al. (2010) measured the concentration of pesticides in surface water in this area, and found high levels of herbicide molecules (Chlortoluron, Isoproturon, Linuron, Aclonifen, Metolachlor). Some of these had a maximum concentration that was ten times the legal limit (0.1 μg/l for one molecule) during storm flow events. These high values are characteristic of an intensive approach to agriculture (Barriuso, 2004; IFEN, 2007).
The simulation of ineffective BEPs increased the surface area of farmland within the ‘very high’ risk category by 15%. This confirms just how effective BEPs are in reducing pesticide transfer risks, as previously put forward by many other authors (CORPEN, 1997; Mérot et al., 1999; Gril and Lacas, 2004; Carluer et al., 2009; Lafitte and Cravero, 2010).
Criterion g6 – agricultural pressure by pesticides
We used a TFI that we calculated for each agricultural parcel. This takes into account the differing doses applied to the area concerned, because pesticides are not always sprayed on the whole surface area of a parcel (MEDD-MAAPRAT, 2010). Having compared the TFI results in this watershed with those in the whole Midi-Pyrénées area, we found that our results were slightly lower than the regional average. This can be explained by the 30-year presence of a farming association in the Auradé watershed, which encourages best agricultural and environmental practices.
3.3.2 Criteria weighting
This step is essential, as many previous studies have demonstrated (Mousseau, 1993; Mousseau et al., 2001; Roy, 2001). Experts (agronomists) are able to rank criteria according their contribution to pollutant transfer, but without precision. The SRF software was very useful in obtaining the values of weights, which were examined – and confirmed – by agronomy experts.
We carried out different tests on the sensitivity of the weighting within the model, which showed that the model was suitably sensitive, and that using the SRF software was a good choice.
3.3.3 Category modelling and parameters
The use of five categories is standard practice for this kind of study. Using this number of categories helps decision makers and agricultural stakeholders (farmers and their advisors). The veto threshold for pesticide pressure was effective. Out of results collected by the model for 87 plots, only the results from two plots were not confirmed by our experts. Following different tests on credibility level λ, we were able to set a credibility level of 0.70. Such a high value is testament to the robustness of the model.
3.3.4 Combining MCDA with GIS
We did not use an integrated MCDA and GIS solution. Instead, we chose the MCDA method most suited to our project (ELECTRE TRI-C), which allowed us to optimise different parameters: thresholds of preference, indifference, veto, and credibility level. While other methods may be easier to use, they do not provide the required functionality. PROMETHEE, for example, does not use outranking, but only preferences without veto thresholds. To give another example, IDRISI has an integrated multi-criteria evaluation function, but uses a raster system as opposed to a vector system. In addition to this, the spatial reference object in IDRISI is a pixel, whereas our vector system can define the boundaries of farming parcels much more precisely, thus providing a clearer representation of levels of decision making in the field. Another drawback of IDRISI is that it cannot take into account qualitative data such as that concerning BEPs.
We also used the ArcGIS® software package, which provides the best capacity for
spatial analysis. All such processing needed for scoring was carried out using the ArcGIS® suite.
4 Conclusions – perspectives
In all western countries where there is intensive farming, pesticides are used to combat weeds, fungal diseases, and insects. Yields have greatly increased over the last 50 years, but this has been accompanied by a progressive contamination of surface and groundwater by pesticides, mainly herbicides. This has proved to be a problem for water pumping stations, who are primarily concerned with providing safe drinking water. Many of them have had to shut down.
The results of our MCDA/GIS modelling showed a large area of farmland with a high risk of pesticide transfer. Agricultural parcels in the ‘high’ and ‘very high’ category represent 42% of all farmland within the Auradé watershed. A further 40% fell into the ‘intermediate’ category, meaning that it could easily move into the ‘high’ band.
These increasing risk levels were highlighted by the simulation of ineffective VFSs and RZs. This hypothesis was then modelled: 57% of all agricultural land received a ‘high’ or ‘very high’ risk rating, representing a 15% increase on the current situation. This simulation did not include any changes in farming methods, but simply assessed the level of protection afforded by BEPs.
The target of a 50% decrease in the use of pesticides in France, according to the ECOPHYTO 2018 calls for more widespread application of BEPs and a greatly reduced use of pesticides in farming. This means a change in agricultural systems with longer cropping succession and more mechanical weeding. There needs to be an overall change in mentality and people generation.
We can therefore conclude that BEPs are an effective way of reducing the risk of contaminant transfer into water, but it remains necessary to increase the use of these practices in areas where they are not yet widely applied. This study shows that the requirements imposed by the European Union are justified. The acceptance of significant change, and thus the improvement of water quality, can only come from a greater awareness of environmental issues.
From a methodological point of view, this project has shown the advantages of combining an MCDA method such as ELECTRE TRI-C with a GIS, to make use of qualitative data. This method provides a new decision-aiding tool to public environmental managers which, with some adjustments based on environmental conditions and human practices can be used in any region or country.
In the future, we believe that using our method alongside agro-hydrological modelling could provide further information through simulating different changes to farming methods, such as contaminant flow at different points within the water system.
The key challenge for the future will be to increase food production, while still protecting the environment. Author such as Griffon (2010) has coined the expression ‘ecologically intensive agriculture’.
Acknowledgements
Our thanks go to EU Interreg SUDOE IV B, who funded this research as part of the Aguaflash project. We would also like to express our gratitude to the anonymous reviewers whose comments allowed us to refine the quality of our article.
We would also like to thank members of the Auradé farmers’ association for their cooperation: especially technician Vincent Gobert, Didier Métayer, an agricultural engineer for the chamber of agriculture, and agricultural technician Bertand Besse from the local farming co-operative.
We gratefully acknowledge the invaluable advice received from Professors Bernard Roy and José Rui-Figueira. Finally, we would like to thank translator James Emery for providing assistance with English proofreading.
References
Agence de l’Eau Adour-Garonne (2009) Qualité des eaux et produits phytosanitaires sur le bassin
Adour-Garonne. Situation en 2009, Toulouse, 8p.
Almeida-Dias, J., Figueira, J.R. and Roy, B. (2010) ‘ELECTRE TRI-C: a multiple criteria sorting method based on characteristic reference actions’, European Journal of Operational Research, Vol. 204, No. 2, pp.565–580.
Arondel, C. and Girardin, P. (2000) ‘Sorting cropping systems on the basis of their impact on groundwater quality’, European Journal of Operational Research, Vol. 127, No. 3, pp.467–482.
Aurousseau, P., Gascuel-Odoux, C. and Squividant, H. (1998) ‘Eléments pour une méthode d’évaluation d’un risque parcellaire pour la contamination des eaux superficielles par les pesticides. Application au cas de la contamination par les herbicides utilisés sur culture de maïs sur des bassins versants armoricains’, Etude et Gestion des sols, Vol. 5, No. 3, pp.143–156.
Baban, S.M.J. and Parry, T. (2001) ‘Developing and applying a GIS-assisted approach to locating wind farms in the UK’, Renewable Energy, Vol. 24, No. 1, pp.59–71.
Barriuso, E. (2004) Estimation des risques environnementaux des pesticides, INRA éditions, INRA, Paris.
Bur, T., Probst, J.L., N’guessan, M. and Probst, A. (2009) ‘Distribution and origin of Pb in stream sediments from small agricultural catchments draining Miocene deposits (SW, France)’,
Applied Geochemistry, Vol. 24, No. 7, pp.1324–1338.
Carluer, N., Tournebize, J., Gouy, V., Margoum, C., Vincent, B. and Gril, J.J. (2009) ‘Role of buffer zones in controlling pesticides fluxes to surface waters’, Procedia Environmental
Sciences, 6p.
Carvalho, F.P. (2006) ‘Agriculture, pesticides, food security and food safety’, Environmental
Science and Policy, Vol. 9, Nos. 7–8, pp.685–692.
Carver, S. (1991) ‘Integrating multi-criteria evaluation with geographical information systems’,
International Journal of Geographical Information Science, Vol. 5, No. 3, pp.321–339.
Cavallo, A.and Norese, M.F. (2001) ‘GIS and multi-criteria analysis to evaluate and map erosion and landslide hazards’, Informatica, Vol. 12, No. 1, pp.25–44.
Ceballos-Silva, A. and López-Blanco, J. (2003) ‘Delineation of suitable areas for crops using a multi-criteria evaluation approach and land use/cover mapping: a case study in Central Mexico’, Agricultural Systems, Vol. 77, No. 2, pp.117–136.
Centofanti, T., Hollis J.M., Blenkinsop, S., Fowler, H.J., Truckell, I., Dubus, I.G. and Reichenberger, S. (2008) ‘Development of agro-environmental scenarios to support pesticide risk assessment in Europe’, Science of The Total Environment, Vol. 407, No. 1, pp.574–588. Chakhar, S. and Martel, J-M. (2003) ‘Enhancing geographical information systems capabilities
with multi-criteria evaluation functions’, Journal of Geographic Information and Decision
Analysis, Vol. 7, No. 2, pp.47–71.
Chakhar, S. and Mousseau, V. (2008) ‘GIS-based multi-criteria spatial modelling generic framework’, International Journal of Geographical Information Science, November–December, Vol. 22, Nos. 11–12, pp.1159–1196.
Chen, Y., Yu, J. and Khan, S. (2010) ‘Spatial sensitivity analysis of multi-criteria weights in GIS-based land suitability evaluation’, Environmental Modelling and Software, Vol. 25, No. 12, pp.1582–1591.
Claver, A., Ormad, P., Rodríguez, L. and Ovelleiro, J.L. (2006) ‘Study of the presence of pesticides in surface waters in the Ebro river basin (Spain)’, Chemosphere, Vol. 64, No. 9, pp.1437–1443.
CORPEN (1997) (Ed.) Produits phytosanitaires et dispositifs enherbés. Etat des connaissances et
propositions de mise en ouvre, Paris.
CORPEN (2003) (Ed.) Diagnostic régional de la contamination des eaux liée à l’usage des
produits phytosanitaires: éléments méthodologiques, Paris.
EC (1998) Directive no. 98/83/CE du 03/11/98 relative à la qualité des eaux destinées à la consommation humaine, Journal Officiel des Communautés européennes.
EC (2000) Directive 2000/60/EC of the European Parliament and of the Council of 23 October 2000 establishing a framework for Community action in the field of water policy, Official Journal of the European Communities.
EU (2009a) Règlement no. 1107/2009 du 21/10/09 concernant la mise sur le marché des produits phytopharmaceutiques et abrogeant les directives 79/117/CEE et 91/414/CEE du Conseil, JOUE no. L 309 du 24 novembre 2009.