O
pen
A
rchive
T
OULOUSE
A
rchive
O
uverte (
OATAO
)
OATAO is an open access repository that collects the work of Toulouse researchers and
makes it freely available over the web where possible.
This is an author-deposited version published in :
http://oatao.univ-toulouse.fr/
Eprints ID : 11594
To link to this article : DOI:10.1007/978-3-642-02806-9_20
URL :
http://dx.doi.org/10.1007/978-3-642-02806-9_20
To cite this version : Causse, Mickaël and Hurter, Christophe The
physiological user’s response as a clue to assess visual variables
effectiveness. (2009) In: HCI 2009 international , 19 July 2009 - 24
The physiological user’s response as a clue to assess visual variables
effectiveness
Mickaël Causse
123, Christophe Hurter
451
Inserm ; Imagerie cérébrale et handicaps neurologiques UMR 825; F-31059 Toulouse, France
2
Université de Toulouse ; UPS ; Imagerie cérébrale et handicaps neurologiques UMR 825; CHU Purpan, Place du Dr Baylac, F-31059 Toulouse
Cedex 9, France 3
Spatial and aeronautical center, ISAE-SUPAERO, Toulouse, F-31000 France. [email protected] 4
IHCS IRIT Toulouse, F-31000 France 5
Direction Technique de l‘Iinnovation DGAC/DSNA/DTI R&D, Toulouse, F-31000 France [email protected]
Abstract. The paper deals with the introduction of Bertin’s visual variables in an ATC context. The ranking
of the efficiency of these variables has been experimentally verified by Cleveland, however, no studies highlight the physiological correlates of this ranking. We analyzed behavioral, physiological and subjective data recorded on 7 healthy subjects facing a visual comparison task witch involve 5 selected visual characterizations (angle, text, surface, framed rectangles and luminosity). Results showed that the observed accuracy was coherent with Mackinlay ranking of visual variables. Psychophysiological and subjective measurements are also discussed.
Keywords: Bertin’s visual variables, Emotion, Mental load, Psychophysiological response.
1 Introduction
1.1 Introducing the Bertin’s visual variable classification in ATC
In current Air Traffic Control (ATC) environments, air traffic controllers use numerous visualization systems like radar views, timelines, electronic strips, meteorological views or supervision systems. Each of these visualizations is rich and dynamic: it displays numerous visual entities that move and evolve over time. Among its different tasks, the most important activity of the controller is the monitoring of conflicts; this refers to the process to detect a loss of safe separation between aircrafts. Conflict resolution requires quick decisions that are sometimes performed under a high uncertainty. Conflicts resolutions generate psychological stress; consequently, the ATC activity may strongly load the cognitive system. The objective of our work is a first step to evaluate the matching between the Bertin [1] classification of visual properties and the effectiveness of these visual properties in the ATC context.
Bertin introduced “la graphique” which provides rules to code information in a monosemic way (i.e. without any ambiguity in the perception of displayed information). He characterizes data to be displayed as:
• Nominal: are only equal or different to other values (aircraft’s name),
• Ordered: obey an order rule (aircraft’s landing number),
• Quantitative: can be manipulated by arithmetic (aircraft’s altitude).
Furthermore, Bertin introduced seven visual variables (Position, Size, Shape, Orientation, Color, and Texture). Subsequently, Cleveland [2], and then Mackinlay [3] built scales of expressivity and effectiveness for Bertin’s visual variables (dependent on the human perceptual capabilities). This scale depends on Bertin’s data type. The quantitative data type ranking has been experimentally verified by Cleveland. This ranking was built for
statistical graphs; nevertheless, this approach might be applied in many other visualization fields. Therefore in this paper we try to sort design choice from the less to the most efficient visual solutions and to validate Bertin’s scale with psychophysiological data in complement to empirical experimentations.
1.2 Psychophysiological measurements
The psychophysiological measurements provide objective measures of the state of operators, precious clues on the impact generated by a given task. In mental workload literature [4], as well as in human machine interface studies [5, 6], psychophysiological data are commonly used as an index of the level of cognitive demand generated by a task (e.g. increased temporal demand, memory loading etc.). This level is characterized by physiological changes, in particular the catabolic activity within the autonomous nervous system (ANS) and is associated with energy mobilization and the investment of mental effort to copy with a task [7]. The analysis of psychophysiological responses like the eye movements or the pupil diameter has been also successfully used in ATC, for instance to assess the workload generates by a dynamic forecast tool compared to a static one [8]. As noticed by Võ [9], whereas a substantial literature focuses on cognitive or emotional effect on ANS, little studies take into account their interactions, in focusing on workload effects, potential related psychological stress and emotion is ignored and its role in performance degradation is neglected. In consequence, the improvement of the emotional experience provided by the visual variables displayed on the screen could play a key role to facilitate the cognitive processes of the operators. Some preliminary experiments show the specifics impacts of a given cognitive activity on the ANS and the potential dissociation between emotional and cognitive effect on the ANS activity [10].
1.3 Objectives
Taking into account the research in the design field and the user’s physiological considerations, we propose experiments that rely on four components:
• An ATC task based on a simplified scenario of the conflicts detection throughout judgment of vertical separation. The horizontal separation relies on the position of the aircraft on the radar; the vertical separation is classically based on a label associated with each aircraft (altitude in feet). Because the position on the screen is devoted to horizontal separation, we proposed to use different visual coding for the vertical separation.
• The behavioral measurements are the reactions times of the subjects to detect the conflicts and their accuracy to designate the concerned elements (analogies of aircraft).
• The objectives physiological measurements (ProComp Infiniti, Thought Technology) of the ANS arousal: the heart rate (HR), the galvanic skin response (GSR) and the respiratory rate (RR).
• The subjective rating of mental load, thanks to the NASA TLX, and emotional assessment: stress, anxiety and user experience quality, rated using a 9-point visual analog scale.
The overall aim of this study is to categorizing, following the Bertin’s classification, the different visual variables according to their abilities to provide accurate quantitative information and highlight the workload, the psychological stress and the emotion that they generate in a context analogous to the ATC separation task. Our work is based on Cleveland previous work in wich visual variables efficiency is empirically classified. The mental load and the subjective emotional assessment should allow us to disentangle workload effect from emotional one’s and their respective roles in case of performance modifications.
2 Method
2.1 Subjects
Healthy subjects (n = 7) were recruited by local advertisement. Inclusion criteria were: young (age: 28.71 ± 7.45), male, native French speakers, right-handed, under or postgraduate. Non-inclusion criteria were sensorial deficits, neurological, psychiatric or emotional disorders and/or being under the influence of any substance capable of affecting the central nervous system. All subjects received complete information on the study’s goal and experimental conditions and gave their informed consent.
2.2 Visual variables
The Semiology of Graphics describes seven visual variables that form the most basic elements of graphic composition [1]. These are position (the spatial variables), size, value (tone), texture, orientation, shape, and hue. These visual variables have perceptual lengths that can be matched to the data scales to support four styles of graphical perception. The visual variables used in our work are inspired from Bertin classification of visual properties (Fig. 1).
Fig. 1.The 5 selected visual characterisations. Respectively: text (a), surface (b), framed rectangles (c), luminosity (d) and angle (e).
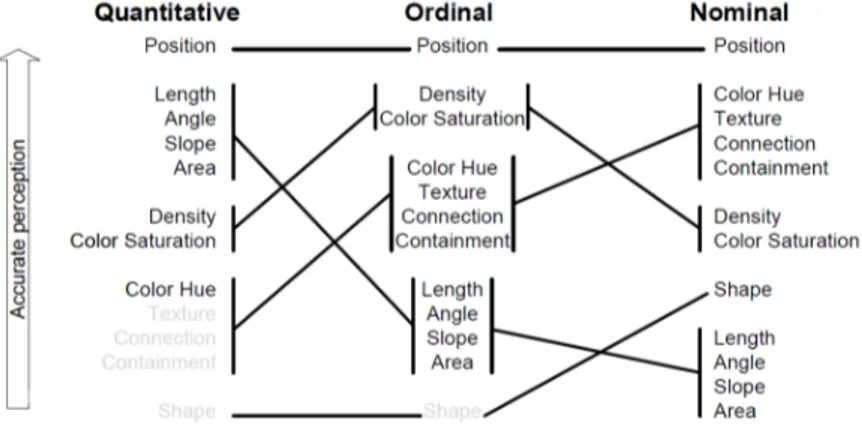
Fig. 2.The Mackinlay ranking of perceptual task.
Mackinlay built scales of expressivity (monosemic, but dependant on a precise graphical language) and effectiveness (depend on the human perceptual capabilities) to assess alternative designs (Fig. 2). This scale depends on the data type. The visual property higher in the chart is perceived more accurately than those lower in the chart. The grey items are not relevant to that type of information. The quantitative data type ranking as been experimentally verified by Cleveland [2]. Independently of the data type, the best way to represent the data is to code it with a position on a scale. If we want to represent the speed of an aircraft (quantitative data), we can use the length of a line (speed vector). The aircraft position number in the landing sequence (Ordinal) is better coded using the color saturation than length.
2.3 Computerized experimental tasks
The task (Fig. 3) is a simplified reproduction of the air controller main activity: the monitoring of conflicts. The subject was instructed that he had to designate with the mouse, which object is in conflict with the object of reference positioned at the center of the screen. The conflicting object is the one that has the most similar visual variable setting. This task has to be performed as accurate and as quick as possible. The 5 visual variables which provide the value of the vertical information (altitude) were manipulated to assess their efficiency to draw attention to the object that entered in conflict and offer efficiency quantitative information. A total of 10 objects were simultaneously presented at the screen: nine objects to be scanned plus the reference object at the center. The visual variables coded information in a 9 step levels of graduation, for instance the angle value was manipulated from 10 degrees to 90 degrees. We did not use extreme scale values (e.g. 0 and 100 degrees, empty and full framed-rectangles etc.) to avoid as most as possible pop out effect. The target object (object that was the most similar to the center one’s) was separated from only 5 graduation steps from the reference object (the other being separated from at least 10 graduations steps) and thus objects are never identical to the reference one’s,
this was a simple way to maintains cognitive comparisons processes and thus avoid fast visual matching of the two objects.
2.4 Experimental design
The design was blocked, which means that a set of trial of the same visual variables was presented. Each visual variable were repeated 18 times in a block, the order in which the subject performs each block was randomized to avoid order effects. Each trial duration was of 10 seconds and the ITI (inter stimulus interval) was 10 seconds too. The stimulus display time limitation was a good way to bring temporal pressure and avoid potential longer reaction time for some subjects. The fixed 10 seconds ITI improved the quality of the phasic galvanic skin response analysis. The stimulus was masked just after the response. Each block lasted exactly 6 minutes. A training session was set up of an additional block (9 trials) and was performed before the experimental stimuli (not included in subsequent analyses) as a means of controlling the initial SCRs and HR response produced as a result of stimulus novelty. Indeed, psychophysiological measurements may be jeopardized by the stimuli novelty. The subject performance was measured by the percentage of correct answers (HITS) and the mean reaction times (RT) for correct and incorrect answers.
Fig. 3.A view of the task screen, here the comparison cognitive process is performed on framed rectangles. The subject had to designate the object the most similar to the center one (the reference object).
2.5 Psychophysiological measurements
Heart rate and galvanic skin response were collected thanks to a ProComp Infiniti (©Thought Technology Ltd.). In practice, establishing mean physiological values for several groups of subjects for an entire task is meaningless because of inter-individual variability, delta values must be used (difference between working and resting states) for measuring the autonomous nervous system (ANS). Because all our subjects performed the task with the 5 five visual variables, no delta values were needed to be computed. The psychophysiological measurements were started at the launching time of the first block and continuously recorded until the end of the experiment. The block design allowed to specify relatively short ITI, indeed the visual conditions being the same in a whole block, no evoked physiological response of a given condition could overlap on a subsequent one. This is especially critical for the heart rate response that can last several minutes before coming back to its baseline level.
2.6 Subjective assessments
The computerized version of the Nasa TLX allowed subjects to assess the mental load felted after each visual variable. The NASA-TLX provides an overall workload score based on a weighted average of ratings on six dimensions (mental demands, physical demands, temporal demands, own performance, effort and frustration). Self report of stress, anxiety (on a 1-9 scale) was collected immediately after the end of each block. User experience quality (joy to use, emotional experience, comfort etc.) was also collected.
3 Results
The main effect of the visual variables on behavioral results was tested with the Kruskal-Wallis non-parametric ANOVA. This test was also used to assess the effect of the visual variable on the psychophysiological responses and the subjective self assessments results. Kruskal-Wallis multiple comparisons were used for paired analysis. All analyses were done with Statistica 7.1 (© StatSoft).
3.1 Behavioral results
Kruskal Wallis ANOVA revealed several behavioral variables significantly affected by the type of visual variables (Table 1): the percentage of hits, the mean correct and incorrect response times. Wilcoxon paired analysis showed that the percentage of hits for color was significantly lower than rectangle (p=0.017), surface (p=0.046) and text (p=0.027). Concerning the mean responses time, difference were find between angle and surface (p=.023). Correct response time revealed that color generated lower RT than angle (p=.042) and rectangle (p=.017). On the contrary, incorrect response times were significantly higher for color vs. rectangle (.027) and vs. text (p=.017).
Table 1. Mean values, standard deviation and p-values for the behavioral results across the 5 visual characterizations. Time units are in milliseconds. Kruskall-Wallis test shows significant variance: *p≤ 0.05, **p≤0.01.
Variable Angle Color saturation
Framed rectangle
Surface Text p-value
% of hits 82,53 (±10,35) 66,66 (±13,22) 88,09 (±4,99) 78,56 (±11,30) 86,49 (±2,97) .020* Mean RT 4428,8 (±1665,2) 3663,6(±1414) 4202,5(±1024,4) 3867,3(±1274,1) 4050,4(±1123,5) .091 Mean Correct RT 3720, 1(±1876,7) 2441,5 (±1335,5) 3665,3 (±846,7) 3038,3 (±1393,4) 3440,7 (±1062,7) .050* Mean incorrect RT 826,8 (±358,8) 1222 (3±88,1) 626,75 (±317) 829 (±403,8) 609,7 (±213,5) .010**
Additional analysis (Fig. 4) showed that responses times were shorter for incorrect responses vs. correct ones (p<0.01).
Fig. 4.Response time in milliseconds according to the type of responses, correct or incorrect.
3.2 Psychophysiological results
Thanks to the block design, tonic HR and RR could have been analyzed on a whole time course for each given visual variable. The GSR were measured in micro Siemens and analyzed off-line. The tonic GSR analysis was not well adapted to this kind of experiment because of its very long delay to come back to its baseline state, thus the measure was the magnitudes of the SCR. Responses were computer scored as a change in conductance from the pre-stimulus level to the peak of the response. Following information provided by Dawson et al. (2000) (1–4-s latency and 1–3-(1–4-s ri(1–4-se time), the minimum level occurring within 1–3 (1–4-s from word pre(1–4-sentation wa(1–4-s (1–4-subtracted from the peak value occurring within a 3–7-s window with a minimum value of zero in the absence of a response.
Kruskall-Wallis non-parametric ANOVA didn’t showed overall significant difference between the five visual variables concerning the psychophysiological variables (Table 2).
Table 2. Mean values, standard deviation and p-values for the behavioral results across the 5 visual characterizations.
Variable Angle Color saturation
Framed rectangle
Surface Text p-value
Mean HR (in bpm) 71,32 (±12,64) 65,99 (±3,48) 66,21 (±10,31) 67,76 (±10,74) 67,76 (±8,76) .487 Mean RR (breath min) 15,48 (±0,72) 15,79 (±1,01) 15,41 (±0,99) 15,52 (±0,76) 15,42 (±0,7) .296 GSR (in µS) 0,155 (±0,075) 0,192 (±0,097) 0,214 (±0,088) 0,258 (±0,144) 0,263 (±0,126) .406
Although the ANOVA didn’t show overall effect, Wilcoxon paired analysis revealed a significant difference between angle and text (Fig. 5) concerning the galvanic skin response (p=.042): the text generated significant higher galvanic skin responses.
Fig. 5.Galvanic skin response (µS) during visual comparisons performed on angle and text visual variables.
The figure 6 is an example of a GSR recording during 3 trials (red bars). The GSR is usually characterized by the delay, the rise time and the recovery half-time.
Fig. 6.Example of the galvanic skin response (µS) for one subject during the text condition. Red bars indicate the display time of the stimuli. Timeline unit is in second.
3.3 Subjective results
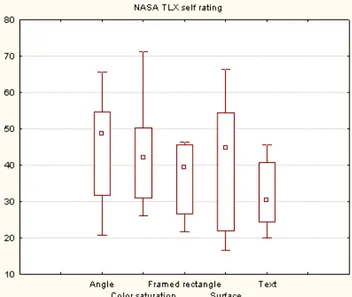
Main ANOVA analysis revealed significant differences concerning the mental load rated thought the Nasa TLX and also concerning the user experience self rating (Table 3, Fig. 7).
Table 3. Median values, standard deviation and p-values for the Subjective data comparing the 5 visual characterizations.
Kruskall-Wallis test shows significant variance: *p≤ 0.05, **p≤0.01.
Variable Angle Color saturation
Framed rectangle
Surface Text p-value
Nasa TLX mental load 51,5 (±4,47) 36,91 (±10,29) 37,33 (±9,49) 43,25 (±14,75) 31 (±11,39) .050* Anxiety rating 2,14 (±1,67) 2,14 (±1,21) 2,28 (±1,25) 2,42 (±1,9) 1,71 (±1,11) .606 Stress rating 3,28 (±1,6) 3 (±1) 2,85 (±1,34) 3,28 (±1,88) 2,71 (±1,11) .807 User XP rating 3,42 (±1,9) 3,57 (±1,51) 4,57 (±2,14) 4,42 (±1,9) 5,85 (±0,69) .050*
Fig. 7.Nasa TLX workload and user experience self rating according to the five visual variables.
Concerning the mental load (Fig. 8), the paired analysis revealed higher load for angle vs. text (p=.042) and vs. color saturation (p=.017).
Fig. 8.Nasa TLX workload self rating according to the five visual variables.
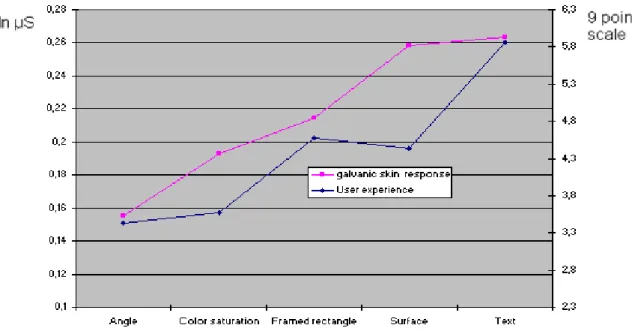
On the other hand, the user experience analysis revealed better user experience for text vs. angle (p=.027) and vs. color saturation (p=.017). The figure 9 shows user experience self rating and the GSR for the five visual variables.
Fig. 9.Galvanic skin response (µS) and user experience self rated on a 9 points scale.
4 Discussion
Our behavioral results were coherent with the Mackinlay [3] ranking of quantitative perceptual task. Indeed, the observed accuracy where ordered accordingly to its classification: length (framed rectangle) > angle > area (surface) > color Saturation. The reaction times are more complex to interpret. The correct response times may appear contradictory, indeed, the variable that provided the worst accuracy has generated the shorter reaction times. This result could be interpreted as a different strategy of the subject for this variable, unable to reach a very good accuracy; a quick visual comparison was certainly performed. This hypothesis is supported by the incorrect reaction times that were significantly lower than the correct ones concerning the 5 visual variables. Incorrect answer may be associated, at least for a part, with too low cognitive processing time.
We did not find major results concerning the psychophysiological measurements. The small number of subject had certainly contributed to limit the significance of the statistical analysis; also the ATC real activity is more stressing because of the potential impact on the security of controller’s decisions. However, paired analysis showed that the text variable had a stronger effect on GSR than the angle. No significant stress or anxiety was provoked by the different visual variables, the rating remained very low. Upon this basis, the GSR observed during text may be rather interpreted as a general arousal of ANS more linked with emotional factors linked to the user experience than with the workload or a psychological stress, indeed, the text variable rated as the less loading task was the most appreciated as showed by the user experience assessment. This result validates the current design choice for air traffic controller radar screen where the altitude of each aircraft is displayed as text.
5 Conclusion
We compared the accuracy of the Bertin visual variables with the psychophysiological and subjective point of view. The results were coherent with the Mackinlay ranking. In this paper, we confirm that visual variable accuracy can be validated by empirical assessments. However, psychophysiological results are more complex to interpret and represent a first step to dissociate cognitive from emotional effects of a task on psychophysiological measurements. Some analysis must be performed for a deepest understanding of these data, for example the GSR should be compared according to the type of response (correct and incorrect).
References
1. Bertin J. “Graphics and Graphic Information Processing” deGruyter Press, Berlin (1977).
2. Cleveland, W.S., McGill, R., Graphical Perception: Theory, Experimentation, and Application to the Development of Graphical Methods. Journal of the American Statistical Association 79 (1984).
3.
Mackinlay, J.Applying a theory of graphical presentation to the graphic design of user interfaces. UIST (1988).4. Gaillard, A.W.K. Stress, workload, and fatigue as three biobehavioural states: a general overview. In: Hancock, P.A., Desmond, P.A. (Eds.), Stress, Workload, and Fatigue. Erlbaum, Mahweh, NJ, pp. 623– 639 (2001).
5. Gevins, A., Smith, M.E. Neurophysiological measures of cognitive workload during human–computer interaction. Theoretical Issues in Ergonomic Science 4 (1–2), 113– 121 (2003).
6. Iqbal, S., Adamczyk, P., Zheng, X., Bailey, B. Towards an index of opportunity: understanding changes in mental workload during task execution, Proceedings of the SIGCHI conference on Human factors in computing systems, Portland, Oregon, USA (2005).
7. Fairclough, S-H., Venables, L., Tattersall A. The influence of task demand and learning on the psychophysiological response International Journal of Psychophysiology, Volume 56, Issue 2, May, Pages 171-184 (2005).
8. Ahlstrom, U., & Friedman-Berg, F. J. Using eye movement activity as a correlate of cognitive workload. International Journal of Industrial Ergonomics, 36(7), 623-636 (2006).
9. Võ, M., Jacobs, A., Kuchinke, L., Hofmann, M., Conrad, M., Schacht, A., Hutzler, F. The coupling of emotion and cognition in the eye: Introducing the pupil old/new effect. Psychophysiology 45, 130–140. Blackwell Publishing Inc (2008).
10. Causse M., Pastor J., Sénard J-M., Démonet J-F.: Unraveling emotion, difficulty and attentional demand in psychophysiological responses during executive tasks. First Meeting of the Federation of the European Societies of Neuropsychology, Edinburgh, Scotland (2008).