The vacuum ultraviolet photoabsorption and photoelectron spectroscopy of
fluorochloroethenes. The 1,1-, cis- and trans-C
2H
2FCl
G. Tornow 1, R. Locht
Département de Chimie Générale et de Chimie Physique, Institut de Chimie, Bâtiment B6, Université de Liège, Sart-Tilman par B-4000 Liège 1, Belgium
R. Kaufel, H. Baumgärtel and H. W. Jochims
Institut für Physikalische und Theoretische Chemie, Freie Universität Berlin, Takustrasse 3, D-1000 Berlin 33, Germany
Abstract
The vacuum ultraviolet absorption spectra of the three fluorochloroethene isomers were measured in the 6-13 eV photon energy range. Additionally, the He(I) and Ne(I) photoelectron spectra were recorded. The assignment of the various photoelectron bands is based on MNDO calculations. The vacuum UV absorption spectral features were classified in terms of Rydberg series converging to the first and second ionization energy. Besides the typical π-π* transition, other valence transitions were observed and tentatively assigned. In the geminal isomer spectrum the dominant Rydberg series converge to the first ionization limit at 10.02 eV, in the cis and trans isomers the most intense Rydberg transitions converge to the second ionization energy at 11.87 and 12.03 eV respectively. The first ionization energies of these latter compounds, obtained by Rydberg series analysis, are 9.89 and 9.87 eV respectively. An assignment of the vibrational structure observed in both spectra is proposed.
1. Introduction
The energy and structure of neutral excited states as well as of ionic states of ethene and its halogen derivatives are of considerable interest for understanding the gas phase photochemistry and ion chemistry of this class of compounds.
There are no difficulties in understanding the electronic structure of ground state ethene following a simple description by π and σ orbitals resulting from the valence electrons. However, the description of the first excited state, the π* state, which is documented spectroscopically by the well-known π-π* transition, offers problems for discussion. There is no doubt that the antibonding π* orbital plays a dominant role but in an early paper Mulliken pointed out that the π* and the 3dxz orbitals have the same symmetry properties [1]. Therefore the Rydberg character of the π* state arising from Rydberg-valence mixing has to be invoked. Quantum-chemical calculations [2-4] revealed strong changes of the molecular geometry of ethene in the π* state. There exists a considerable distortion along the C-C bond and in addition the C-C bond length is enhanced with respect to the ground state [5]. With increasing excitation energies, the assignment of the observed transitions becomes more tentative and, especially, the location of valence transitions is difficult.
Using halogen-substituted ethenes, one gets the possibility to investigate the influence of different halogen atoms on the electronic structure of ethene and, moreover, by inserting two halogen substituents different isomers result, which can be used to study the mutual interaction of the halogen atoms. Another, more chemical aspect is the contribution of σ, π and lone pair electrons to the electronic system of halogen ethenes.
Many ethenes substituted by one fluorine, chlorine and/or bromine have been investigated by photoabsorption spectroscopy [6-8], photoelectron spectroscopy [9-11], photoionization [12-15], and electron impact [16]. The fragmentation patterns of the corresponding molecular ions have been examined by the same techniques including photoion-photoelectron coincidence spectroscopy [17]. By inserting halogen atoms the vacuum ultraviolet spectrum becomes more complicated. The excitation of halogen non-bonding orbitals produces Rydberg states [18,19], which may contribute to the parent ion yield curves through autoionization. Although there are VUV spectroscopic studies of 1,1-fluoro-chloroethene, 1,1-difluoro-2-chloroethene and
1
fluorochloroethene, spectral limitations prevented registration of the spectra in the short wavelength region [8]. Using the extended photon energy range ( 6-25 eV) generated by a synchrotron radiation source, Rühl et al. [20] recently reported the absorption spectra of difluorochloroethenes including cis and trans isomers.
Following the photoabsorption and photoionization work performed in our laboratory the present paper will report on the VUV photoabsorption and photoelectron spectroscopy of 1,1-, cis- and trans-fluorochloroethene. Based on the spectral relationship between these methods and by including the results of MNDO calculations, an assignment of the various bands observed in the photoelectron spectrum to the different molecular orbitals was possible. The results of photoionization and electron impact mass spectrometry will be published later [21].
2. Experimental
2.1. The syntheses of 1, 1-, cis- and trans-fluorochloroethene
The 1,1-fluorochloroethene needed to be prepared from 1,1,2-trichloro-l-fluoroethane which is obtained from 1,1,2,2-tetrachloroethene. The preparation of the latter compound is performed by the method of Dreisbach et al. [22,23 ],
(1)
and gives a 99.9% pure compound. The second step is performed by using the method described by Henne and Hubbard [24], i.e.
(2)
and a gaschromatographic 99.9% pure 1,1,2-chloro-1-fluoroethane is obtained. The final step, starting from this compound, is performed according to Henne et al. [25,26],
(3)
yielding 1,1-C2H2FC1 of 99.99% gaschromatographic purity with a boiling point of - 24 °C, in very good agreement with the published value of - 24 °C [25] or -25.5°C [26] for 1,1-fluorochloroethene.
The two isomers cis- and trans-fluorochloroethene were prepared by starting from commercially available 1,1,2,2-tetrachloroethane which is monofluori-nated through [24]
(4)
As described by Swarts [27], the purified 1-fluoro-trichloroethane (99.9%) is used in the next step, eq. (5),
(5)
to obtain a mixture of 36.7% trans- and 63.3% cis-fluorochloroethene. The two compounds were separated by chromatography on a preparative column (15% squalane) maintained at 8°C. The trans product was obtained with 100% purity after two passages. The cis isomer with the same purity needed a third separating passage. The boiling point of cis-fluorochloroethene was 16°C, that of trans-fluorochloroethene -4 ° C in agreement with ref. [ 28 ].
2.2. Absorption spectra
The photoabsorption spectra of the three compounds were obtained by using the vacuum ultraviolet continuum emission from the electron storage ring BESSY (Berlin). This light is dispersed in a 1 m NIM monochromator (McPherson 225) by a holographic grating (1200 lines/mm) [29]. A window-less absorption cell is directly fixed on the mono-chromator's exit slit. To prevent sample contamination, the absorption cell as well as the gas inlet system are made of stainless steel. An absolutely reading manometer and a solar blind photomulti-plier, sensitized for vacuum ultraviolet by sodium salicylate, provide exact determination of the absorption coefficients. The wavelength resolution was 0.05 nm.
2.3. Photoelectron spectra
The photoelectron spectra were obtained by using an instrument described elsewhere [30]. Only the most salient features will be mentioned here. The light, provided by a He or Ne discharge lamp, is led into the ionization chamber through a capillary. The photoions, extracted by a low draw-out field, are energy selected by a retarding lens and mass-analyzed in a quadrupole filter. The photoelectrons, flying in the opposite direction to the photoions, are energy analyzed in a retarding potential-type analyzer with a differential output [31]. The resolution as measured on the Ar(2P3/2) peak is 40-50 meV. Both ions and electrons are detected by means of an electron multiplier followed by counting electronics. The background pressure being 10-8 mbar, the sample pressure is about 3 X 10⁻⁵ mbar.
To resolve the abundant vibrational fine structure present in most of the photoelectron bands, the photoelectron spectra have been deconvoluted by an iterative procedure which will be published elsewhere [32].
3. Experimental results 3.1. The photoelectron spectra
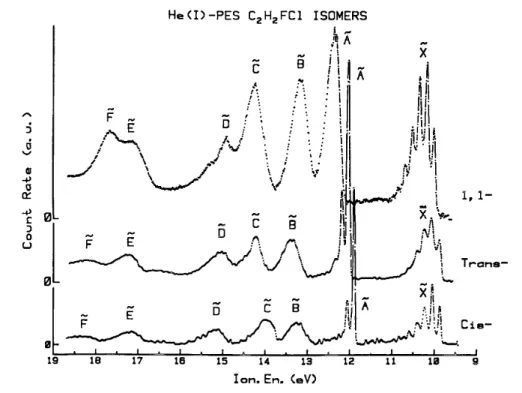
The photoelectron spectra of 1,1-, cis- and trans-fluorochloroethene shown in fig. 1 were recorded at 21.2 eV using the He (I) resonance line. In addition PE spectra with Ne (I) excitation have been measured. The spectra show up to seven more or less well resolved bands. The adiabatic and/or vertical ionization energies corresponding to each band measured in the photoelectron spectrum are listed in table 1. The photoelectron energy scale is calibrated with respect to the first ionization energy of Kr at 14.000 eV. In table 1 the first adiabatic ionization energies, derived from the photoionization measure ments, are included. In the last column of table 1, a tentative assignment to these energies is inserted, resulting from MNDO calculations performed on the three fluorochloroethenes [33]. Symmetry considerations play only a minor role.
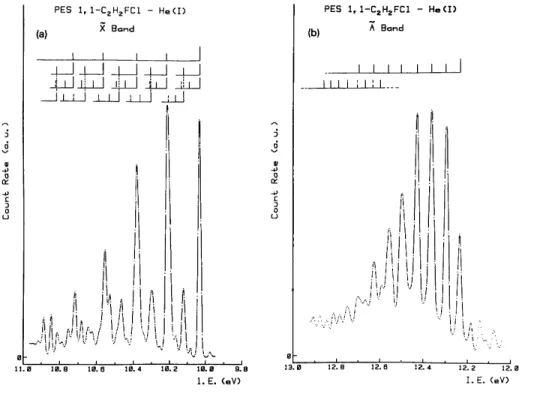
Several bands in the photoelectron spectra of these compounds exhibit extended vibrational progressions which are very well resolved when deconvolution is applied. As an example, figs. 2a and 2b show the result of this procedure when applied to the first two photoelectron bands of 1,1-fluorochloroethene. The vibrational spacings, expressed in wavenum-bers, as measured from such spectra are listed in table 2. Tentative assignments to different normal vibrational modes are based on infrared and Raman spectroscopic data [34-37] of the neutral molecules presented in table 3.
3.2. The photoabsorption spectra of fluorochloroethenes
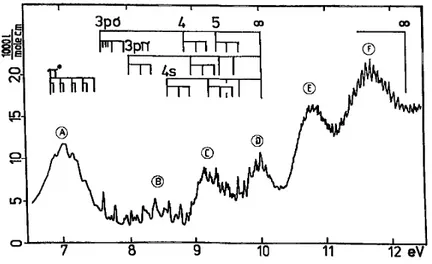
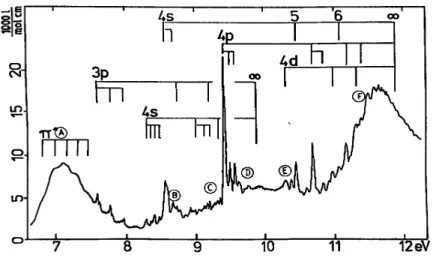
Typical photoabsorption spectra recorded for the three fluorochloroethene isomers are displayed in figs. 3-5 in the 6-12.5 eV photon energy range. Between 12.5-25 eV all these spectra only show continuous and flat absorption bands without any discernable structure. All three spectra exhibit (i) a broad and more or less structured band in the low energy region characterizing the π-π* valence transitions of the ethene double bond and (ii) an abundantly structured energy range extending up to 12.5 eV. The spectral features are partly identified and ascribed to Rydberg series as indicated by vertical lines in figs. 3-5 and as listed in table 4.
4. Discussion
In the photoelectron spectra of fluorochloroethenes one expects bands correlated with π and σ electrons and those arising from the non-bonding halogen electrons. The latter ones are oriented perpendicular (out-of-plane) and parallel (in-plane), respectively to the molecular plane. The in-plane orbital remains largely non-interacting (thus a halogen non-bonding orbital), while the out-of-plane orbital interacts with the πcc orbital. This interaction produces bonding and antibonding combinations of these orbitals. In addition, inductive effects caused by the different electronegativity of carbon and halogen atoms have to be taken into consideration. They only shift the position of the bands.
Fig. 1. The He (I) photoelectron spectra of 1,1-fluorochloroethene, cis-fluorochloroethene and trans-fluorochloroethene.
The vertical and adiabatic ionization energies are listed in table 1 for the spectra recorded with both the He (I) and Ne (I) resonance lines. No significant differences are observed. However, the first ionization energies of 10.023 ± 0.015 eV (He(I)) and 10.025 ± 0.015 eV (Ne(I) ) could seem to be significantly lower than those obtained by photoionization (see table 1 ). An error in the energy calibration could be suspected but has to be small. It would not account for the reversed discrepancy observed for the trans-fluorochloroethene. On the other hand, the photoelectron spectrum was recorded with a resolution of 4 meV/channel.
The interpretation of the successive ionization energies observed in the spectrum has been performed with the help of MNDO calculations. The calculated orbital energy (- ε„) versus experimental vertical ionization energy (IEV) plot provides a linear relation characterized by a correlation coefficient of at least 0.995. The results of these calculations are summarized in table 1.
As expected, the sequence of the orbitals in the range of low electron binding energies is very similar to that of chloroethene. At higher electron binding energies it is slightly modified by contributions of nF electrons. Resonance interaction between the nCl and nF lone pair electrons plays a minor role because of the large gap between their binding energies.
The band has obviously to be ascribed to the ionization of a πC-C orbital in all three systems. The à state is characterized by ionization of the non-bonding in-plane Cl orbital. While this band shows an extended vibrational structure in 1,1-fluorochlo-roethene, it exhibits much less structure in cis- and trans-fluorochloroethene and is by far the most intense band. The third band arises from halogen out-of-plane orbitals interacting with the πC-C bond system. The fourth band is essentially described by the nF in-plane orbital
character. The band has a predominant σCH character in the 1,1 compound whereas in the 1,2-fluorochloroethenes σCCl dominates. For all three compounds, the band is essentially characterized by an
interaction between an out-of-plane non-bonding nF orbital with the πC=C orbital. The last F bands have a predominant σCH character.
Table 1. Adiabatic (IEA) and vertical (IEV) ionization energies (eV) of 1,1-fluorochloroethene, cis- and trans-1,2-fluorochloroethene as measured by photoelectron spectroscopy, using He ( I ) and Ne ( I ) resonance lines and by photoionization ( synchrotron source ). Assignments from MNDO calculations are included. The largest experimental error is 0.02 eV in the photoelectron spectra and 0.01 eV for the threshold energy determination by photoionization
He (I) Ne (I) Assignment
State IEA IEv IEA IEv Synchrotron IE -εn character 1,1 -fluorochloroethene 10.02 10.17 10.02 10.21 10.04 10.51 πCC-πF-πCl à 12.24 12.40 12.22 12.35 13.19 nCl 13.02 13.22 13.00 13.24 13.72 πCl+πCC-πF 14.25 14.27 14.23 nF, , σCH 14.93 14.94 14.98 σCH E~ 17.17 17.37 πF+πCC+πCl 17.69 17.89 nF, , σCH, σCCl 18.83 σCF cis-1,2-fluorochloroethene 9.87 10.02 9.87 10.03 9.89 10.34 πCC-πF-πCl à 11.87 11.87 11.87 11.87 12.63 nCl 13.06 13.24 12.99 13.25 13.77 πCl+πCC-πF 13.84 14.02 13.81 14.05 14.10 nF, σCH 15.20 14.93 15.20 15.52 σCCl, σCH E~ 16.61 16.98 πF+πCC 17.30 17.90 nF, σCH 18.65 σCH trans-1,2-fluorochloroethene 9.88 10.05 9.86 10.05 9.87 10.37 πCC-πF-πCl à 12.05 12.05 12.02 12.02 12.75 nCl 13.17 13.40 13.33 13.50 13.90 πCl+πCC-πF 14.26 14.20 14.28 nF, σCH 14.98 15.09 15.45 σCCl, σCH E~ 17.16 17.04 πF+πCC 18.16 17.95 nF, σCH 18.66 σCF,σCH 4.1.1. 1,1-fluorochloroethene
Only the first three bands show more or less clearly resolved vibrational structure. In the Ne (I) spectrum these structures are often enhanced. By applying deconvolution, these bands show almost completely resolved extended vibrational progressions. These are analyzed in the way shown in fig. 2.
by three different wavenumbers, i.e. 1400 ± 36, 722 ± 14 and 380 ± 22 cm-1. They can tentatively be ascribed to the C=C stretching vibration, the C-F stretching and CFC1 deformation-rocking modes. Table 3 shows that the corresponding wavenumbers in the neutral molecule are 1650, 699 and 433 (or 371 ) cm-1. The higher vibrational C-Cl spacing in the PES can be explained by the antibonding character of this orbital in the neutral molecule. A low intensity peak is observed below the first ionization energy at 420 cm-l and could perhaps be ascribed to a hot band such as ρ-δ(CFCl) excitation.
Fig. 2. Typical results of deconvolution of photoelectron bands in 1,1-fluorochloroethene: (a) the band, (b) the à band. The vertical bars locate vibrational progressions.
Table 2. Vibrations (cm-1 ) as observed in different bands of the photoelectron spectra of 1,1-fluorochloroethene, cis- and trans-fluorochloroethene
PE band 1,1-C2H2FC1 Cis-C2H2FC1 Trans-C2H2FC1 Assignment
a) 1400 ± 36 1464± 50 1529 ± 29 v(C=C) 722 ± 14 910± 40 - v(C-F) - - 489 ± 2 v(C-Cl) 380 ± 22 - - ρ-δ(CFCl) Ã - 1268 ± 40 - δ(C-H) - - 109 4± 10 δ(C-H) 524 ± 30 - - v(C-Cl) 291 ± 13 - - ρ -δ(CFCl) 521 ± 20 - - v(C-Cl) - 448 ± 40 374 ± 11 ρ(C-F) a)
Table 3. Vibrations (cm-1) as observed in the IR and/or Raman spectra of 1,1-fluorochloroethene, cis- and trans-fluorochloroethene [34-37]
1,1-C2H2FC1 Cis-C2H2FC1 Trans-C2H2FC1 Assignment a)
1656,1645 1661 1647 v(C=C) 1382 - - δ(CH2) - 1335,1231 1296,1218 δ(C-H) 1186 1062 1127 v(C-F) 947, 946, 953 - - ρ(CH2) 699 ,693 812 876 v(C-Cl) 516 656 447 δ(C-F) 515 442 270 δ(CFCl) 371-433 - - ρ-ρ(CFCl) - 205 270 δ(C-Cl) a)
Vibrations: v stretching, δ deformation, p rocking.
Fig. 3. The vacuum ultraviolet absorption spectrum of 1,1-fluo-rochloroethene. Vertical bars locate selected transitions of Rydberg series and their convergence limit.
Fig. 4. The vacuum ultraviolet absorption spectrum of trans-fluorochloroethene. Vertical bars locate selected transitions of Rydberg series and their convergence limit.
Fig. 5. The vacuum ultraviolet absorption spectrum of cis-fluo-rochloroethene. Vertical bars locate selected transitions of Rydberg series and their convergence limit.
The second band reveals a different structure characterized by two low wavenumbers, i.e. 524 ± 30 and 291 ± 13 cm-l assigned to C-Cl stretching and CFC1 deformation modes respectively. Though within the error limits, a slight decrease in the energy interval in the second progression should be mentioned and ascribed to anharmonicity. The two wavenumbers measured in this band are assigned to CCl stretching and CFC1 rocking vibrational modes. In the neutral molecule these quantities are 699 and 371 cm-1. The observation of an extended vibrational progression in this band is unusual for the ionization of in-plane lone pair electrons. As will be pointed out in the next sections, in cis- and trans-C2H2FCl the corresponding bands are sharp and show only very short and weak vibrational progressions. Additionally in 1,1-C2H2FC1 the adiabatic ionization energy is shifted to higher energies by 0.37 eV versus the corresponding value in cis-C2H2FCl and by 0.19 eV in trans-C2H2FC1. Furthermore, these effects are not observed in the corresponding isomers of difluoro-[38,39], dichloro- [40] and dibromoethenes [40].
Altogether, these results would suggest that in 1,1-C2H2FCl the in-plane Cl lone pair orbital has considerable bonding character compared to the same orbital in cis and trans isomers. The antibonding interaction of the F and Cl in-plane lone pair orbitals may be overcompensated by a Coulomb interaction, which arises from the electronegativity difference between fluorine and chlorine. Experiments to investigate further this kind of interaction are planned on fluorobromoethenes.
On the other hand, the second band shows a peculiar intensity distribution in the vCCl vibrational progression. Up from v = 4, i.e. at 12.49 eV, a sudden lowering in the intensity as well as a broadening of the peaks is observed. These observations usually correlate with an electronic and/or vibrational pre-dissociation, which tentatively may be related to a bonding interaction between fluorine and chlorine.
In the third band, only one vibrational progression is observed with a wavenumber of 521 ±20 cm-1 which is ascribed to the same vibrational mode as assigned to the 524 ± 30 cm-1 wavenumber measured in the second band, i.e. the CCl stretching vibration in agreement with the C-Cl bonding character (πCC+πCl-πF) of this orbital. In addition, vibronic coupling of the second and third electronic state has to be discussed [41]. This effect depends on the energy difference of the coupled electronic states and on the symmetry properties of the vibration involved in the coupling. The smaller energy difference between the electronic states in the 1,1 isomer makes vibronic coupling more feasible than in the cis and trans isomers.
4.1.2. Cis-fluorochloroethane
As already mentioned for the 1,1 compound, the three first bands of the cis-fluorochloroethene show vibrational fine structure. From both the He (I) and Ne (I) spectra, the first band contains two different vibrational progressions characterized by 1464 ± 50 and 910 ± 40 cm-1. As the highest wavenumber could obviously be ascribed to the C=C stretching vibration, the C-Cl stretching vibration is associated with the latter
one. This vibration wavenumber is enhanced by the removal of an electron from the outermost orbital, because of its πCC-πCl-πF character.
Table 4. Calculated and observed origins (eV) of Rydberg transitions in fiuorochloroethenes
1,1-fluoroethene
n π→ns π→npσ π→nρπ π→nd 3p→ns
Ecalc Eobs Ecalc Eobs Ecalc Eobs Ecalc Eobs Ecalc Eobs
3 7.61 a) 7.61 a) 8.02 a) 8.02 a) 8.38 a) 8.38 a) 4 8.60 a) 8.60 a) 8.83 8.88 8.97 8.92 9.12 9.15 9.17a) 9.17 a) 5 9.21 9.23 9.31 9.33 9.38 9.37 9.45 9.44 10.83 10.85 6 9.49 9.51 9.59 9.57 9.59 9.57 9.63 9.65 11.43 11.38 7 9.65 9.65 9.66 9.65 9.71 9.70 9.73 9.75 11.72 11.72 8 9.75 9.75 9.77 9.77 9.78 9.77 9.80 9.77 11.88 11.88 9 11.97 11.97 δ 0.90 0.62 0.40 0.12 1.90 IP 10.02 10.02 10.02 10.02 12.24 Cis-fluorochloroethene n π→ns π→npσ π→npπ 3π→ns 3p→np 3p→nd
Ecalc Eobs Ecalc Eobs Ecalc Eobs Ecalc Eobs Ecalc Eobs Ecalc Eobs 3 6.74 b) 7.59 a) 7.59 a) 7.81 a) 7.81 a) 4 8.36 a) 8.36 8.72 8.73 8.80 8.78 8.56 a) 8.56 a) 9.41 a) 9.41 a) 10.32 a) 10.32 5 9.02 9.05 9.18 9.16 9.22 9.20 10.39 10.40 10.66 10.70 11.00 10.98 6 9.33 9.30 9.41 9.42 9.40 9.42 11.03 11.09 11.15 11.19 11.31 11.31 7 9.49 9.49 9.52 9.49 9.55 9.57 11.33 11.31 11.39 11.40 11.49 11.51 8 9.62 9.62 9.62 9.62 11.50 11.51 11.53 11.51 11.59 11.60 9 11.59 11.60 11.62 11.60 11.65 11.66 δ 1.00 0.56 0.43 1.98 1.65 1.04 IP 9.87 9.87 9.87 11.87 11.87 11.87 Trans-fluorochloroethane n π→ns π→np 3p→ns 3p→npσ 3p→npπ 3p→nd
Ecalc Eobs Ecalc Eobs Ecalc Eobs Ecalc Eobs Ecalc Eobs Ecalc Eobs 3 6.44 b) 7.50 a) 7.58 a) 4 8.36 a) 8.36 8.73 8.73 8.74 a) 8.74 a) 9.29 a) 9.29 a) 9.91 a) 9.91 a) 10.40 a) 10.40 a) 5 9.03 9.03 9.19 9.21 10.57 10.55 10.74 10.75 10.95 10.95 11.14 11.14 6 9.33 9.33 9.42 9.44 11.21 11.23 11.29 11.27 11.38 11.39 11.47 11.50 7 9.50 9.54 9.55 9.55 11.51 11.51 11.55 11.57 11.60 11.58 11.66 11.66 8 9.61 9.61 9.63 9.63 11.68 11.67 11.70 11.69 11.73 11.72 11.76 11.78 9 11.77 11.77 11.79 11.77 11.81 11.82 δ 1.01 0.57 1.97 1.78 1.48 IP 9.88 9.88 12.05 12.05 12.05 a)
Transitions used for the calculation of the quantum defect.
b)
Transition burned under the π-π* band. c)
Low intensity.
The corresponding wavenumber in the neutral molecule is 812 cm-1 (see table 3).
Contrary to the second photoelectron band of the 1,1 compound, which showed a long vibrational progression, in the present compound the removal of an electron from the in-plane lone pair orbital of chlorine reveals its non-bonding character. Only one vibrational mode is observed. Three peaks are regularly separated by 1268 ± 40 cm-1. This wavenumber may correspond to one of the two C-H deformation modes. In the neutral molecule the wavenumber associated with this normal mode is 1231 cm-1. This mode is practically unaffected by the ionization of the nCl orbital.
Only one vibrational mode, characterized by a wavenumber of 448 ± 40 cm-1, is found in the third photoelectron band. This vibrational structure is assigned to the C-F deformation mode. In the neutral molecule
the same vibrational mode has a wavenumber of 656cm-1. 4.1.3. Trans-fluorochloroethane
As for the two above mentioned compounds, trans-fluorochloroethene shows an extended vibrational structure with two different components, i.e. 1529 ± 30 and 489 ± 29 cm-1. These wavenumbers are assigned to the C=C stretching and C-F deformation modes respectively (see table 3). Cis and trans are differentiated by the C-Cl stretching mode, only present in the former (910 cm-l ) and the C-F deformation (489 cm-1) only observed in the latter. In the neutral cis and trans molecules the corresponding wavenumbers are 812 and 447 cm-1 respectively.
As for the cis compound, the second band of trans-fluorochloroethene shows only a short progression and has been assigned to the ionization of an nClin-plane lone pair orbital. Only one wavenumber is observed, i.e. 1094 ± 10 cm-1, and it is assigned to the C-F stretching mode, which is 1127 cm-1 in the neutral molecule. The existence of a polar interaction between fluorine and chlorine, suggested earlier for 1,1 -fluorochloroethane, is obviously not observed in the cis and trans isomer. Nevertheless, the influence of vibronic coupling of the à and B~ states cannot be excluded.
The third band shows a very long vibrational progression very well resolved in the deconvoluted spectrum with a regular spacing of 374 ± 11 cm-1. This band is ascribed to the ionization of the πCC+πCl-πF orbital. From table 3, the most probable assignment to this wavenumber is the C-F deformation vibrational mode, which is characterized by 447 cm-1 in the neutral molecule.
4.2. The photoabsorption spectra
The absorption spectra of fluorochloroethenes show pronounced structure superimposed in broad bands. This leads us to the assumption that valence and Rydberg transitions contribute to the spectrum. This general feature has already been observed in the spectrum of ethene [5,38-43], which besides, the π-π* band shows Rydberg transitions converging to the first ionization potential.
In halogenated ethenes, besides π and σ orbitals in-plane and out-of-plane lone pair orbitals of the halogens exist. These electrons generate new types of transitions. In addition, the π and π* levels may be influenced by inductive and resonance effects. These may become apparent by changes in the term value of these states. Increasing term values indicate stabilization of the corresponding term, which may be due, in the case of the π* orbital, to enhanced distortion and elongation of the C-C bond. Approximate term values can be calculated from the difference of ionization energies and transition energies obtained from the absorption spectra.
4.2.1. The valence transitions
The ground state level could be characterized by the ionization energy of the π orbital. The term values evaluated for the fluorochloro compounds are closer to those of the difluoroethenes. The dichlo-roethenes have systematically the highest term values. The comparison of the ionization energies and the term values of C2H4 with those of C2H3F and C2H3C1 shows the stabilization of π and π* states of C2H3F ("perfluoro effect"). In contrast, in C2H3C1 the π state is destabilized, whereas the π* state is strongly stabilized ("chlorine inductive effect"). In the same way, the comparison of C2H4 with the various disubstituted haloethenes mainly shows a des-tabilization of the π state, whereas the π* state is stabilized. In each group of isomers, the π* state of the cis compounds is the less stable.
As shown in figs. 3-5, the π-π* transition exhibits more or less well developed vibrational fine structure. At least, one vibrational wavenumber is observed in all three compounds discussed in this paper, i.e. 1370 cm-1 in 1,1-fluorochloroethene, 1300 and 1150 cm-1 in cis- and trans-fluorochloroethene respectively. This progression is assigned to the C=C stretching vibrational mode. Obviously, in the trans compound the force constant is considerably reduced. However, in the trans-fluorochloroethene X~ state of the ion (πCC-1 ), the corresponding vibration is characterized by the highest wavenumber.
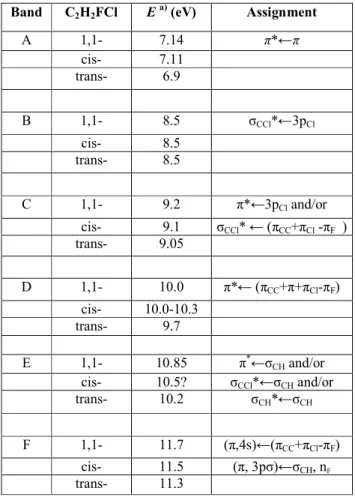
From about 7-12 eV photon energy, the 1,1-fluo-rochloroethene absorption spectrum shows several broad bands underlying sharp Rydberg transitions. These bands, listed in table 5 are ascribed to valence transitions. Owing to their broadness and position, the assignment of these bands is difficult.
The weak B band could be ascribed to the 3pCl→ σ* transition, as has been done for the A band observed in the halogenated alkanes [6]. The σ* orbital is the C-Cl antibonding orbital. The valence-nature of the A band in the halogenated alkanes has been established by comparing their spectra in the gas and condensed phase. The term value of this state is 4.24 eV, i.e. well below the π* state.
On the basis of energetic considerations, the C band could be assigned to a nCl→π* transition. However, this 3p→π* transition has an abnormally high intensity. It can only be suggested that owing to the gem-inal F atom this abnormal intensity originates from the Rydberg/valence character with 3s contribution of the π* state. An alternative assignment to this band would be a (πCC+πCl-πF )→σ*CCl transition, which would be of higher intensity. However, it cannot be ruled out that both transitions contribute to this band.
The most obvious assignment of the D band would be a (πCC+πCl-πF ) →π* transition.
The interpretation of the E band is very difficult, because the underlying energetic argument is less accurate. From the photoelectron spectra only the vertical ionization energies are available. On the other hand, the intensity and broadness of this band indicate higher transition probabilities and the occurrence of several transitions have not been ruled out. The σCH*→π* transition is energetically allowed. However, the σCH*→σCCl* as well as the σCH→σCH*transitions cannot be excluded.
Table 5. Valence transitions in 1,1-, cis- and trans-fluorochloroethene and their tentative assignments Band C2H2FCl E a) (eV) Assignment A 1,1- 7.14 π*←π cis- 7.11 trans- 6.9 B 1,1- 8.5 σCCl*←3pCl cis- 8.5 trans- 8.5 C 1,1- 9.2 π*←3pCl and/or cis- 9.1 σCCl* ← (πCC+πCl -πF ) trans- 9.05 D 1,1- 10.0 π*← (πCC+π+πCl-πF) cis- 10.0-10.3 trans- 9.7 E 1,1- 10.85 π*←σCH and/or cis- 10.5? σCCl*←σCH and/or trans- 10.2 σCH*←σCH F 1,1- 11.7 (π,4s)←(πCC+πCl-πF) cis- 11.5 (π, 3pσ)←σCH, nF trans- 11.3
a) Observed band maxima.
At 11.7 eV an F band is observed, underlying a long vibrational progression characterized by ωe=516 cm-1. The same vibrational spacing is observed in the B band related to the ionic species. Furthermore, the same vibrational structure is observed in the same energy range in the photoionization efficiency curve of the molecular ion [44]. Therefore, it seems to be obvious that the excited state has valence/Rydberg character; the transitions (πCl + πCl-πF ) → (π, 4s) (with ∆ε=ll.6 eV) or (nF, σCH)→3pσ (with ∆ε= 11.8 eV) are available.
From 8.1 eV, the increasing background intensity could be ascribed to valence transitions. However, the measurement of the position of the maxima corresponding to these transitions is rather difficult. Keeping this in mind, the assignments given in table 5 should be considered tentative.
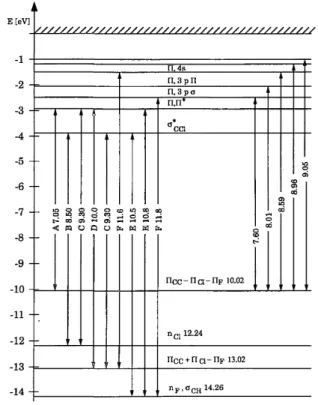
Reasonable assignments could be attempted because the level of the initial state is known by photoelectron spectroscopy. As shown in table 1, the interpretation of these features in cis- and trans-fluorochloroethene follows the same valence transition scheme as in 1,1-trans-fluorochloroethene. From the energy level diagram (see fig. 6) it follows that the final states have π* and σCCl
*
character. It has to be pointed out that this latter state lies energetically close to the (3p, 4s) Rydberg state. This would probably lead to a mixing of both states.
4.2.2. Rydberg transitions
In contrast to the valence transitions, the Rydberg transitions can be easily identified. The energy values gathered in table 4 can readily be classified by using the series formula
ER=IE-R/(n-δ) 2
,
where ER is the Rydberg transition energy, IE the ionization energy, n a principal quantum number and δ the quantum defect, essentially related to the nature of the Rydberg orbital. The calculated values given in table 4 result by assuming a constant value. By comparison with the experimental transition energies fluctuations of the δ values have to be noticed.
Fig. 6. Approximate term scheme of 1,1-fhiorochloroethene based in the knowledge of the adiabatic ionization energies and the π-π*and nCl-σCCl¨
*
transitions. The terms represent the maxima of observed transitions. Besides valence transitions (A-F), some selected Rydberg transitions are shown. Similar schemes can be constructed for cis- and trans-fluorochloroethenes from the experimental values given in this paper.
For 1,1-fluorochloroethene, four series have been identified converging to the first ionization limit at 10.02 eV. From the value of the quantum defect it follows that these series correspond to a π→ns (δ=0.90), a π→npσ (δ=0.62), a π→npπ (δ =0.40) and a π-nd (δ =0.12) transition respectively. The energy of the first
member of the π→ns series has been estimated to be near 6.9 eV by extrapolation of the experimental data and is assumed to be burried under the low energy side of the π-π* transition. The experimental quantum defects are slightly increasing with higher n. This is characteristic for penetrating Rydberg s orbitals [42,43 ].
Throughout the spectrum, a vibrational spacing is observed ranging from 1380 to 1460 cm-1. These wavenumbers are ascribed to the C=C stretching vibration. In the first photoelectron band, a vibrational spacing of 140 ± 36 cm-1 has been ascribed to the same normal vibrational mode (see section 4.1.1).
In the π→3pσ transition, besides the C=C stretching vibration a low energy spacing of 320 cm-1is observed, which probably can be assigned to the CFC1 deformation vibration. A closely related wavenumber, i.e. 380 ± 20 cm-1, has been observed in the first photoelectron band.
Only one weak Rydberg series could be identified, which converges to the second ionization energy at 12.24 eV. It has been assigned to a 3p→ns transition with n=4-9 and with a quantum defect of 1.90.
In the cis and trans isomers only three and two Rydberg series respectively are observed converging to the first ionization energy. In the former compound, only π→ns (δ = 1.00), π→npσ series is 9.87 eV. In the trans isomer, the π→ns (δ =1.07) and a π→np (δ =0.57) series are identified and converge to 9.88 eV. Both convergence limits correspond to the π(C=C) ionization energy. In both cases, the first member of the π→ ns series has been estimated by the method described earlier in this section ( see table 4 ). These again are burried under the low energy side of the broad π-π* band.
As shown in figs. 4 and 5, in cis-fluorochloroethene a few short vibrational progressions are identified, whereas in the trans isomer these are almost absent. The vibrational spacings observed are 1550 cm-1, about 940 cm-l and 550 cm-1. By comparison to the vibrational wavenumbers present in the neutral molecule (see table 3), these spacings are assigned to the C=C, the C-F and the C-Cl stretching vibrational modes respectively. In the first ionized state, the C-F stretching mode is characterized by the wave-number of 910 ± 40 cm-1.
Three Rydberg series are observed in cis-fluorochloroethene and converge to the second ionization limit. The intensity of these series dominates the spectrum. The most intense transitions are the 3p→np series (δ= 1.65), whereas the 3p→ns (δ= 1.98) and the 3p→nd (δ= 1.04) are of decreasing intensity. All these series converge to 11.87 eV corresponding to the second adiabatic ionization energy assigned to the ionization of the chlorine 3p in-plane lone pair orbital.
Very few vibrational progressions are observed in these series with only one vibrational wavenumber of about 1150 cm-1. In the second photoelectron band, a short vibrational progression with ω= 1268 ± 40 cm-1 has been mentioned and was assigned to the δ CHdeformation mode. In the neutral molecule, this vibrational mode is
characterized by wavenumbers of1335 and 1231 cm-1.
In trans-fluorochloroethene four Rydberg series dominate the absorption spectrum, i.e. 3p→ns (δ =1.97), 3p→npσ (δ =1.78), 3p→npπ (δ =1.48) and 3p→nd transitions (δ = 1.13) and converge to the second ionization limit at 12.05 eV. This adiabatic ionization energy has been assigned to the ionization of the chlorine 3p in-plane lone pair orbital. Twice a vibrational spacing of about 950 cm-1 has been identified. It could be assigned to the CH deformation vibrational mode, which is characterized by a wave-number of 1127 cm-1 in the neutral molecule and 1094 ± 10 cm-1 in the ionized state.
One surprising feature has to be pointed out: a basic difference between the absorption spectra of 1,1-fluorochloroethene on the one hand and both of the cis and trans isomers on the other hand is the presence of essentially Rydberg transitions converging to the π ionization limit in the former, whereas in the latter compounds the Rydberg series converging to the 3p ionization limit dominate. Very likely, this result has to be correlated with the Rydberg states' lifetime, which is reduced in the 1,1-isomer compared to the cis and trans compounds.
5. Conclusions
The investigation of the three fiuorochloroethene isomers by vacuum ultraviolet absorption spectroscopy and photoelectron spectroscopy enabled us to propose a detailed interpretation of the vacuum UV spectra. In the geminal isomer four of the five observed Rydberg transitions converge to the first ionization limit
(π-1 ). For the two vicinal isomers the vacuum UV spectrum is dominated by Rydberg series converging to the second ionization limit, i.e. 3p-1. In these spectra, an underlying continuum is observed and assigned to valence transitions. For the three compounds, vibrational excitation is observed in both the Rydberg states and the corresponding ionic states. These structures are correlated and interpreted with the help of infrared and Raman spectroscopic data.
Acknowledgement
The financial support of the Bundesministerium fur Forschung und Technologie, the Belgian Government (ARC-contract) and the Fond National de la Recherche Scientifique (FNRS) is gratefully acknowledged. One of us (GT) wishes to thank the Belgian Government for an ARC-Research grant.
References
[1] R.S. Mulliken, Rev. Mod. Phys. 14 (1942) 265. [2] R.J. Buenker, J. Chem. Phys. 48 (1968) 1368.
[3] R.J. Buenker, S.D. Peyerimhoff and W.E. Kammer, J. Chem. Phys. 55 (1971) 814. [4] R.J. Buenker, S.D. Peyerimhoff and H.L. Hsu, Chem. Phys. Letters 11 (1971) 65. [5] A.J. Merer and R.S. Mulliken, Chem. Rev. 69 (1969) 639.
[6] M.B. Robin, Higher Excited States of Polyatomic Molecules, Vols. 1-3 (Academic Press, New York, 1974/1985). [7] G. Bélanger and C. Sandorfy, J. Chem. Phys. 55 (1971) 2055.
[8] J.D. Scott and B.R. Russell, J. Am. Chem. Soc. 94 (1972) 2634. [9] R.F. Lake and H. Thompson, Proc. Roy. Soc. A 315 ( 1970 ) 323.
[10] G. Bieri, W. von Niessen, L. Åsbrink and A. Svensson, Chem. Phys. 60 (1981) 61. [11] G. Bieri, L. Åsbrink and W. von Niessen, J. Electron Spectry. 23 (1981) 281. [12] J.D. Scott and B.R. Russell, Chem. Phys. Letters 9 (1971) 375.
[13] J. Momigny, Nature 191 (1961) 191; 199 (1963) 1179; Bull. Soc. Chim. Beiges 70 (1961) 241. [14] R. Bralsford, P.V. Harris and W.C. Price, Proc. Roy. Soc. A 258 (1960) 459.
[15] K. Watanabe, T. Nakayama and J. Mottl, J. Quant. Spectry. Radiative Transfer 2 (1962) 369. [16] J. Momigny, Mém. Soc. Roy. Se. Liège (1966), and references therein.
[17] J. Dannacher, Org. Mass Spectry. 19 (1984) 253, and references therein. [18] D. Reinke, R. Krässig and H. Baumgärtel, Z. Naturforsch. 28a (1973) 1021.
[19] W. Lohr, H.-W. Jochims and H. Baumgärtel, Ber. Bunsenges. Physik.Chem. 79 (1975) 901. [20] E. Riihl, H.-W. Jochims and H. Baumgärtel, Can. J. Chem. 63 (1985) 1949.
[21] G. Tornow, R. Locht, R. Kaufel, H.-WL Jochims and H. Baumgärtel, to be published. [22] R.R. Dreisbach and S.A. Schrader, Ind. Eng. Chem. 41 (1949) 2880.
[23] R.R. Dreisbach and R.A. Martin, Ind. Eng. Chem. 41(1949) 2875. [24] A.L. Henne and D.M. Hubbard, J. Am. Chem. Soc. 58 (1936) 404. [25] A.L. Henne and P.R. Ruh, J. Am. Chem. Soc. 70 (1948) 1025.
[26] A.L. Henne, Org. Reactions II ( 1944 ) 81. [27] F. Swarts, Chem. Zentralblatt I ( 1903 ) 13. [28] H.G. Viehe, Ber. Dtsch. Chem. Ges. 93 (1960) 1697.
[29] K. Rademann, H.-W. Jochims and H. Baumgärtel, J. Phys. Chem. 89 (1985) 3459. [30] R. Locht, G. Caprace and J. Momigny, Chem. Phys. Letters 111 (1984) 560. [31] I. Lindau, J.C. Helmer and J. Uebbing, Rev. Sci. Instr. 44 (1973) 265. [32] R. Locht and J. Momigny, to be published.
[33] G. Tornow, Ph.D. Thesis, Freie Universität Berlin, Germany (1986). [34] D.E. Mann, N. Acquista and E.K. Plyler, J. Chem. Phys. 23 (1955) 2122. [35] J.R. Nielsen and J.C. Albright, J. Chem. Phys. 26 (1957) 1566. [36] P. Torkington and H.W. Thompson, Trans. Faraday Soc. 41 (1945) 236.
[ 37 ] N.C. Craig, Y.S. Lo, L.G. Pipper and J.C. Wheeler, J. Chem. Phys. 74 (1970) 1712.
[38] D. Chadwick, A.B. Cornford, D.C. Frost, F.G. Henning, A. Katrib, C.A. McDowell and R.A.N. McLean, Electron Spectroscopy (North-Holland, Amsterdam, 1972) p. 453.
[39] H.W. Jochims, W. Lohr and H. Baumgärtel, Nouv. J. Chim. 3 (1979) 109. [40] K. Wittel and H. Bock, Chem. Ber. 107 ( 1974) 317.
[41] H. Köppel, L.S. Cederbaum, W. Domcke and S.S. Shalk, Angew. Chem. 95 (1983) 221. [42] A.D. Walsh, J. Phys. Radium 15 (1954) 501.
[43 ] S. Eldén, in: Encyclopedia of Physics, Vol. 27. Spectroscopy I, ed. S. Flügge (Springer, Berlin, 1964). [44] R. Kaufel, Ph.D. Thesis, Freie Universität Berlin, Germany (1985).