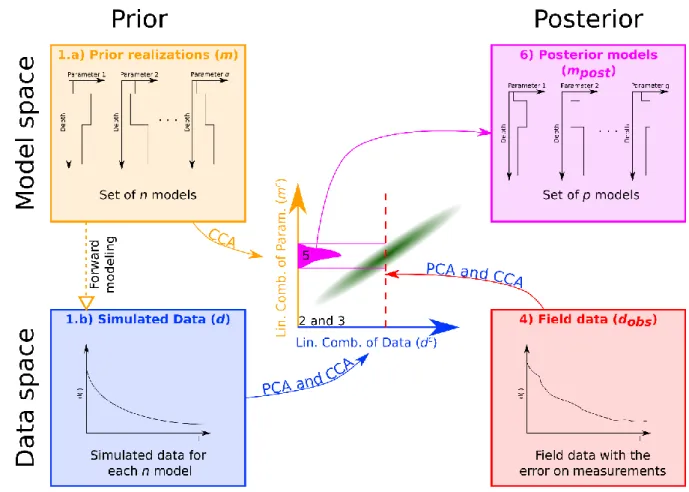
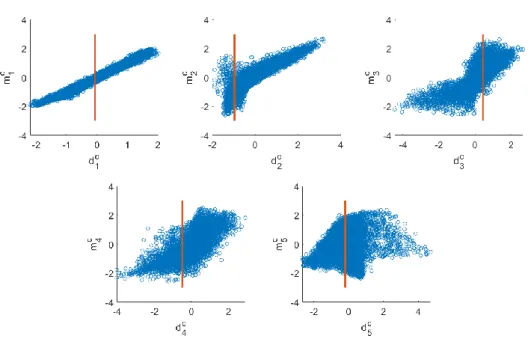
1D geological imaging of the subsurface from geophysical data with Bayesian Evidential Learning
Texte intégral
Figure

Documents relatifs
In this work, we describe a new class of global gridded crop model emulators for five crops (maize, soybean, rice, and spring and winter wheat) and nine process-based crop models,
fois avec désespoir " ﻞﻣﺃ ﻙﺎﻨﻫ ﻥﻮﻜﻳ ﻻ ﻯﺮﺧﺃ ﺕﺍﺮﻣ ﻦﻜﻟ ﺓﺎﻴﳊﺍ ﰲ ﻞﻣﺃ ﻙﺎﻨﻫ ﻥﻮﻜﻳ ﺕﺍﺮﻣ ﻱﺃ ، ﺓﺎﻴﳊﺍ ﰲ. ﺔﻋﱰﻟﺍ ﻆﺣﻼﻧ ﺎﻨﻫﻭ ﺔﻟﺎﳊﺍ ﻯﺪﻟ ﺔﻴﻨﻳﺪﻟﺍ. ﱐﺎﻌﻳ ﺪﻴﺴﻟﺍ ﻥﺃ ،ﺔﻟﺎﺤﻠﻟ
We have considered model stochastic ODEs with additive and multiplicative Brownian noise (1)/(2), and have derived the deterministic equations in variational form satisfied by the
In the present study, we identified novel viral miRNAs encoded by TFV and analyzed the diversity of miRNA expression in fish (ZF4) and mammalian (HepG2) cells to define the
Indique en-dessous si elles sont parallèles ou perpendiculaires entre elles, en utilisant les symboles géométriques // et ┴... Place un point B en dehors de
This prior information is formulated as pairwise constraints on instances: a Must-Link constraint (respectively, a Cannot-Link constraint) indicates that two objects belong
In the proposed method, the tree parameters are estimated through the maximization of an evidential likelihood function computed from belief functions, using the recently proposed E 2
