The X-ray emission of the WR+O binary WR 79
Eric Gosset
1, Hugues Sana
2, Gregor Rauw
1and Ya¨el Naz´e
11 Institut d’Astrophysique et de G´eophysique, Universit´e de Li`ege, Belgium
2 Sterrenkundige Instituut Anton Pannekoek, Universiteit van Amsterdam, The Netherlands
Abstract: In the framework of our multiwavelength study of the open cluster NGC 6231, we observed the colliding-wind WR+O binary WR 79 at six different epochs with the XMM-Newton observatory. These point-ings offer the possibility to study the X-ray spectrum of WR 79 and its possible variability. Our results are briefly discussed and compared with the X-ray characteristics of other similar objects.
1
Introduction
1.1
An X-ray survey of NGC 6231
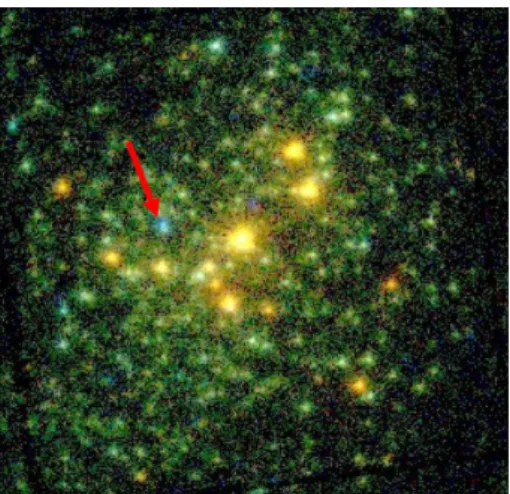
In the context of our scientific program on massive stars proposed for guaranteed time observations with the XMM-Newton satellite, we acquired several pointings aiming at the detailed analysis of the massive binary system HD 152248, an object located at the centre of the rich open cluster NGC 6231 in the Sco OB1 association. These X-ray pointings associated with an extensive ground-based spec-troscopic support in the visible domain led to a multi-wavelength study of a palette of massive O-type binary stars, covering a wide range of configurations of colliding wind binary (CWB) systems (see Sana et al. 2004, 2005, 2006a, 2007a, 2008). The same pointings were combined to perform an un-precedentedly deep X-ray survey of the cluster and a catalogue (see Sana et al. 2006b, 2006c, 2007b). The false-colour X-ray image of the central part of the cluster is reproduced in Fig. 1. One object ap-pears light-blue and is thus a relatively hard source: it has been identified with WR 79, a well-known WC+O binary system. In the present work, we take the opportunity of the existing data to investigate the X-ray spectrum of this particular object and its possible variability.
1.2
The Wolf-Rayet star WR 79
In their study of NGC 6231, Shapley & Sawyer (1927) detected an extreme Oa spectral type for HD 152270 (≡WR 79), and Payne (1928) reported the existence of Wolf-Rayet (WR) emission bands in addition to an O-type absorption spectrum (central reversal of the lines). Payne (1933) identified a WC spectrum with superimposed absorption lines. Swings (1942) further refined the classification to WC6+ and discussed the origin of the absorption spectrum. Struve (1944a) reported conspicuous radial velocity variations but could not discern between profile variations and pure velocity shifts. One had to wait for Struve (1944b) to turn HD 152270 into the first WC star recognized to belong to a binary system. The derived period was 8.82 days and the mass ratio q turned out to be in favour of
Figure 1: X-ray image of the core of the NGC 6231 cluster based on the combined MOS1 and MOS2 detectors. This is a false-colour image using three energy ranges: Soft (0.5-1.0 keV) represented in red, Medium (1.0-2.5 keV) in green and Hard (2.5-10.0 keV) in blue (Sana et al. 2006b). The yellow-orange objects are associated to the
mas-sive OB stars. Numerous greenish objects are
harder sources believed to essentially be consti-tuted of pre-main sequence stars. WR 79 appears as a much harder (blue) object (see the red arrow). the O star. Seggewiss (1974) performed the first extensive study of the WC6-7+O5 binary system and
reported a P =8.893 d circular system with q=2.8. He also described a strong emission line at CIII
λ5696, flat-topped with a superimposed pair of emission peaks, suspected to arise from gas streams within the shell. The dramatic changes of this structure were analysed by Schumann & Seggewiss (1975). These enigmatic variations, first attributed to a stream, were subsequently modelled as being due to an extended optically thin shell around the WR star (emitting the flat-topped component) from which some matter has been removed, due to an interaction with the O-type star (see Neutsch et al. 1981 and references therein). Along the rim of the matter-free hole, enhanced density and thus emission generate the additional sub-peaks. The distance between the two sub-peaks varies with half the orbital period. The configuration proposed by Neutsch et al. (1981) allowed them to constrain the
inclination of the system to a value of 35◦. Additional works in photometry (Lamontagne et al. 1996),
in polarimetry (St-Louis et al. 1987) and in spectroscopy (Smith et al. 1990) suggested a spectral
type WC7+O5-8 and an inclination angle of 33.6–44.8◦. After the pioneering work of Neutsch et al.
(1981), the next important step was the paper by L¨uhrs (1997) that interpreted the CIII λ5696
line-profile variations with a colliding-wind model where the extra emission over the main flat-topped profile was actually shaped like a saddle with the two above-mentioned sub-peaks at both limits. The extra emission was interpreted as recombination light emitted on the surface of the cone that is created by the collision between the WR wind and the O one. L¨uhrs (1997) favoured an inclination
of i=28.0◦±1.1◦ and a half opening angle of the cone of 39.8◦±0.8◦. Hill et al. (2000, 2002) further
refined the work and the CWB model of L¨uhrs. They converged to an inclination of 29◦±5◦
, and to a
half opening angle of 29◦±4◦. Therefore, WR 79 turns out to be a CWB and should emit in the X-ray
domain. In this domain, Pollock (1987) reported a first tentative 2σ-detection with the EINSTEIN satellite. Owing to the crowding of the field, the first convincing detection necessitated the HRI instrument on-board ROSAT; Pollock (1995) listed a surprisingly weak source with a luminosity of
5.9±1.1 × 1031 erg s−1 for a distance of 2 kpc. Corcoran (1999) confirmed the anomalous faintness
of WR 79 for a CWB and attributed a lower luminosity of 2.3 × 1031 erg s−1 and a log(LX/Lbol)
below −8.0.
2
Observations
2.1
Visible domain
We acquired several optical spectra of WR 79 in March 2006 and June 2006 with the FEROS spec-trograph at the ESO/MPI 2.2m telescope (La Silla). The main aim was to ascertain the phase of
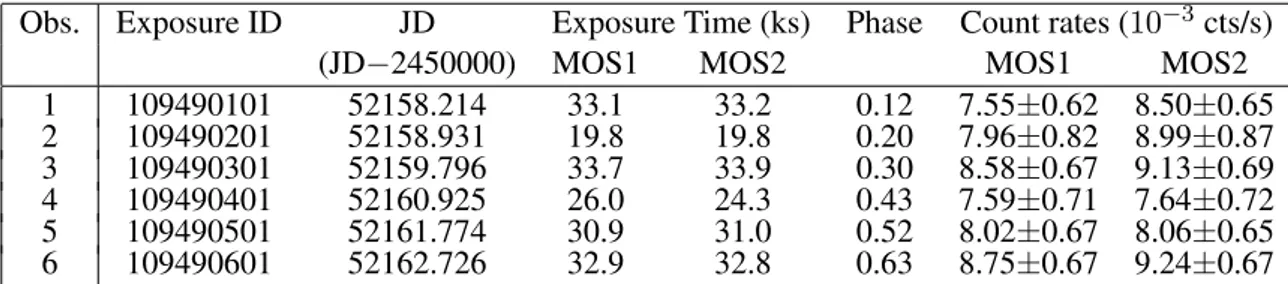
Table 1: List of the pointings involved in the present study along with the phases computed for the binary system WR 79. Phase zero corresponds to conjunction with the WR star in front. Individual count rates for WR 79 and their ±1σ-errors are also given.
Obs. Exposure ID JD Exposure Time (ks) Phase Count rates (10−3cts/s)
(JD−2450000) MOS1 MOS2 MOS1 MOS2
1 109490101 52158.214 33.1 33.2 0.12 7.55±0.62 8.50±0.65 2 109490201 52158.931 19.8 19.8 0.20 7.96±0.82 8.99±0.87 3 109490301 52159.796 33.7 33.9 0.30 8.58±0.67 9.13±0.69 4 109490401 52160.925 26.0 24.3 0.43 7.59±0.71 7.64±0.72 5 109490501 52161.774 30.9 31.0 0.52 8.02±0.67 8.06±0.65 6 109490601 52162.726 32.9 32.8 0.63 8.75±0.67 9.24±0.67
Table 2: Measured mean count rates in various energy ranges and the corresponding hardness ratios.
Detector Total Soft Medium Hard HR1 HR2
(10−3 cts/s) (10−3cts/s) (10−3cts/s) (10−3cts/s)
MOS1 8.08 (0.29) 0.45 (0.09) 3.23 (0.19) 4.40 (0.20) 0.76 (0.05) 0.15 (0.04)
MOS2 8.60 (0.30) 0.72 (0.10) 3.50 (0.19) 4.38 (0.20) 0.66 (0.04) 0.11 (0.04)
absorption lines of the O star and tried to reconnect them with the data of Hill et al. (2000, 2002). We confirmed the circular character of the orbit and computed the phase with, as a convention, the phase zero corresponding to the conjunction with the WR star being in front. The phases are given in Table 1 for epochs of interest and with a precision of a very few percent.
2.2
XMM-Newton data
Six pointings were acquired in the framework of the NGC 6231 study. They are summarized in Table 1 along with the derived phase of the WC+O binary WR 79. These data constitute a homogeneous coverage of half an orbital cycle, which certainly could represent a constraining data set. Individual pointings have exposure times of about 30 ks (see Table 1). These individual pointings were combined to build a total image (see Fig. 1). The X-ray count rates were measured in several energy ranges, namely the ‘Total’ band (0.5-10.0 keV), and the ‘Soft’ (0.5-1.0 keV), the ‘Medium’ (1.0-2.5 keV), and the ‘Hard’ (2.5-10.0 keV) ones, from individual data sets but also on the basis of the combined data set (resulting from the merging of the six individual data sets; the details of the reduction are identical to those given in Sana et al. 2006b). The individual count rates in the Total band are given in Table 1. The combined count rates in various ranges and the hardness ratios are given in Table 2. The latter are defined as HR1=(Medium–Soft)/(Medium+Soft) and HR2=(Hard–Medium)/(Hard+Medium). The X-ray spectra were also extracted from individual data sets and from the combined ones (see also Sana et al. 2006b). WR 79 was always falling very close to a CCD gap on the pn detector and we preferred to discard these data.
3
Results
3.1
Mean characteristics
The hardness ratios are very similar to those of V444 Cyg at quadrature (Fauchez et al. 2011). From Fig. 1 and from the hardness ratios, it is clear that WR 79 presents a luminosity in the Hard band that is high compared to those in other ranges, making WR 79 an interesting object. The X-ray spectrum
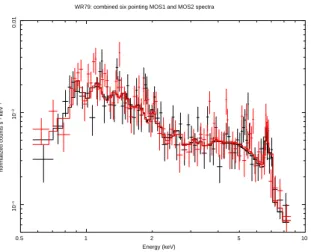
1 10 0.5 2 5 10 −4 10 −3 0.01 normalized counts s −1 keV −1 Energy (keV) WR79: combined six pointing MOS1 and MOS2 spectra
Figure 2: Observed X-ray mean spectra (MOS1, black; MOS2, red) along with the best-fitted three-temperature mekal model (no.2 in Table 3). The hard emis-sion component is obvious including the Fe-K line. On the other hand, the param-eters of the cooler component could be strongly correlated, implying a degener-acy of the fitted values.
of the binary system, extracted from the full combined event lists, is presented in Fig. 2 and confirms the above-mentioned results with its apparently flat nature, particularly on the hard side. The flux depression around 2-3 keV is reminiscent of the post-periastron spectrum of WR 140 (Pollock et al.
2005) and of the low-state spectrum of γ2 Vel (Schild et al. 2004). The mean spectrum was studied
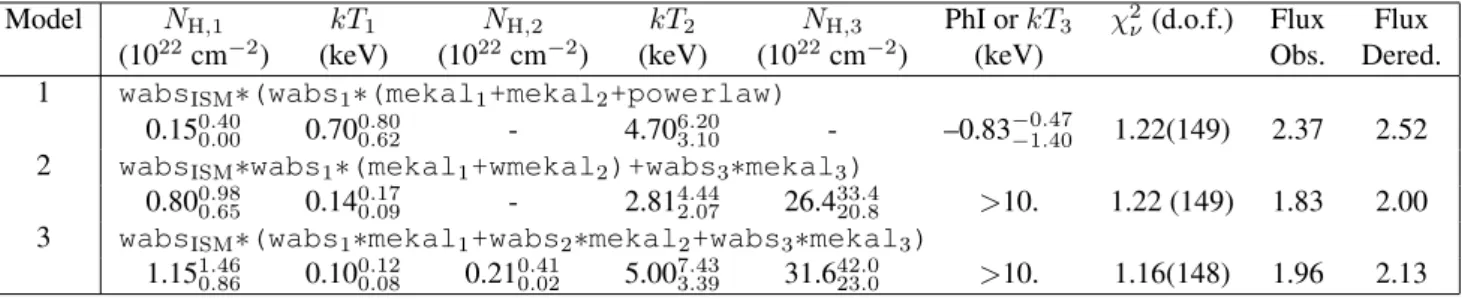
using the XSPEC software. We essentially fitted it with optically thin thermal plasma emission models of the type mekal. One and two-temperature mekal components are not able to fit the observed data. Actually, the spectrum from 3 to 9 keV is difficult to fit. We needed three-component models to reach a reasonable level of fitting. Table 3 gives the results of the fits for various models. The 3-9 keV region necessitates a power law (neglecting the Fe-K line) or a very hot component with, in front, a huge column density (both being probably unphysical). Solar abundances and WC-type abundances were selected for the emitting plasma; we give in Table 3 the results for the best fits. The selected abundances have very small effect on the fitted temperatures. The absorbing column
densities are free parameters except the ISM one fixed at NH= 0.27 × 1022cm−2(Sana et al. 2006c).
The fluxes observed and corrected for the ISM are also given. Adopting the same distance as in the
rest of the study (DM =11.07; 1.64 kpc), the corrected flux (2.10 × 10⁻¹³erg cm−2 s−1) corresponds
to a luminosity LX(0.5-10.0 keV) = 6.7 × 1031 erg s−1. This value is rather low (but larger than
the expected intrinsic emission of the companion) and gives a ratio log(LX/Lbol) of −7.3. This flux
value is also rather low. The dereddened flux in the ROSAT band is still five times lower, giving a
LX(0.2-2.4 keV) = 2.1 × 1031erg s−1(at 2 kpc) in good agreement with the one quoted by Corcoran
(1999). The column density in front of the soft component is in the range NH= 0.8-1.2 1022cm−2and
is similar to the estimation of the WC wind absorption in γ2 Vel (Schild et al. 2004). Further progress
necessitates a full hydrodynamical study of the colliding-wind structure and of its emission.
3.2
Variability
The Total count rates of WR 79 corresponding to the individual pointings (see Table 1) give a mean of 8.08 (MOS1) and 8.59 (MOS2) as well as a dispersion σ = 0.50 (MOS1) and σ = 0.64 (MOS2)
corre-sponding to χ2(d.o.f.=5) values of 3.02 (MOS1) and 5.06 (MOS2). The dispersions are lower than the
individual errors and the χ2-tests indicate that these count rates are thus compatible with constancy.
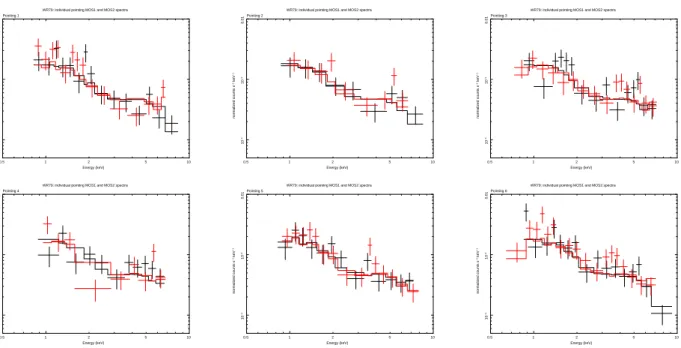
In Fig. 3, we present the six pairs of spectra corresponding to the different pointings along with the model fitted (no.2 in Table 3) on the combined data set. From these individual spectra, we can con-clude that, within the errors, the star is not varying in the X-ray domain over the orbital cycle (at least for phases 0.12 to 0.63). Chandra observations show that WR 79 corresponds to CXO J165419.7–
414911 and has two X-ray emitting neighbours at 4.800 and 5.900. The three objects are not resolved
1 10 0.5 2 5 10 −4 10 −3 0.01 normalized counts s −1 keV −1 Energy (keV) Pointing 1
WR79: individual pointing MOS1 and MOS2 spectra
1 10 0.5 2 5 10 −4 10 −3 0.01 normalized counts s −1 keV −1 Energy (keV) Pointing 2
WR79: individual pointing MOS1 and MOS2 spectra
1 10 0.5 2 5 10 −4 10 −3 0.01 normalized counts s −1 keV −1 Energy (keV) Pointing 3
WR79: individual pointing MOS1 and MOS2 spectra
1 10 0.5 2 5 10 −4 10 −3 0.01 normalized counts s −1 keV −1 Energy (keV) Pointing 4
WR79: individual pointing MOS1 and MOS2 spectra
1 10 0.5 2 5 10 −4 10 −3 0.01 normalized counts s −1 keV −1 Energy (keV) Pointing 5
WR79: individual pointing MOS1 and MOS2 spectra
1 10 0.5 2 5 10 −4 10 −3 0.01 normalized counts s −1 keV −1 Energy (keV) Pointing 6
WR79: individual pointing MOS1 and MOS2 spectra
Figure 3: The six individual X-ray spectra (one per pointing) MOS1 (black) and MOS2 (red) of WR 79. We also show the above-mentioned model that has been fitted to the combined spectra. None of the individual spectra deviates significantly from the model, illustrating the constancy of the X-ray emission.
objects could be variable, this has no deep impact on our conclusions: WR 79 is, in the X-ray domain, constant to about 10-15 %.
4
Conclusion
The circular nature of the orbit of WR 79 suggests that the only possible variability, in the X-ray domain, induced by the orbital variation must arise from a varying absorbing column density along the line of sight to the observer. This variability is not detected whereas it is observed in other similar systems (Schild et al. 2004). Usually, the variability is interpreted as being due to the fact that, at one moment, the hot plasma due to the wind collision and situated near the binary axis between the two stars, is visible through a region of lower opacity corresponding to a line of sight going through the shock cone generated by the O star wind (Willis, Schild & Stevens 1995). Indeed, when the line of sight to the emitting plasma goes through the WC wind, the absorption is larger and the received flux is lower. The opacity being higher in the soft X-ray domain, the emerging X-ray radiation is hard.
Such variations are observed in WR 140 and in γ2 Vel. Concerning V444 Cyg, Maeda et al. (1999)
reported a constant soft X-ray component and a varying hard component, the latter variability being due to a varying absorption over the orbital cycle. In this case also, the lowest absorption corresponds to the O star being in front of the WR (but see Fauchez et al. 2011). The absence of such variations in WR 79 (variations that should occur at about phase 0.5, corresponding to the conjunction with the O star in front) suggests that the absorbing column density remains about stable over the orbital cycle. The rather hard emission, the rather strong absorbing column involved and the constant nature of the X-ray emission and its low flux suggest that we are permanently looking at the emitting plasma through the WC wind. This implies a rather small inclination of the system (or alternatively a strong Coriolis effect due to the comparatively short period). If the half opening angle derived by Hill et al. (2002) is correct, this means that the inclination must be lower. This low value is in fair agreement
Table 3: Result of the fit of the observed X-ray spectrum with various models. The superscripts and subscripts correspond to the permitted range at the 90 % confidence level. The ISM contribution is
fixed whereas all the other parameters were left free. Fluxes are expressed in 10−13erg cm−2 s−1and
correspond to the Total band. PhI is the photon index for model 1. kT3 remains undefined.
Model NH,1 kT1 NH,2 kT2 NH,3 PhI or kT3 χ2ν(d.o.f.) Flux Flux
(1022cm−2) (keV) (1022cm−2) (keV) (1022cm−2) (keV) Obs. Dered. 1 wabsISM∗(wabs1∗(mekal1+mekal2+powerlaw)
0.150.400.00 0.700.800.62 - 4.706.203.10 - –0.83−0.47−1.40 1.22(149) 2.37 2.52
2 wabsISM∗wabs1∗(mekal1+wmekal2)+wabs3∗mekal3)
0.800.980.65 0.140.170.09 - 2.814.442.07 26.433.420.8 >10. 1.22 (149) 1.83 2.00
3 wabsISM∗(wabs1∗mekal1+wabs2∗mekal2+wabs3∗mekal3)
1.151.46
0.86 0.100.120.08 0.210.410.02 5.007.433.39 31.642.023.0 >10. 1.16(148) 1.96 2.13
References
Corcoran M.F., 1999, Rev. Mex. A. A. (Ser. Conf.), 8, 131
Fauchez, T., De Becker, M., & Naz´e, Y. 2011, in Proceedings of the 39th Li`ege Astrophysical Colloquium, eds. G. Rauw, M. De Becker, Y. Naz´e, J.-M. Vreux & P.M. Williams, BSRSL 80, 673
Hill G.M., Moffat A.F.J., St-Louis N., Bartzakos P., 2000, MNRAS, 318, 402 Hill G.M., Moffat A.F.J., St-Louis N., 2002, MNRAS, 335, 1069
Lamontagne R., Moffat A.F.J., Drissen L., et al., 1996, AJ, 112, 2227 L¨uhrs S., 1997, PASP, 109, 504
Maeda Y., Koyama K., Yokogawa J., Skinner S., 1999, ApJ, 510, 967 Neutsch W., Schmidt H., Seggewiss W., 1981, Acta Astronomica, 31, 197 Payne C.H., 1928, Harvard College Obs. Bull., 855, 1
Payne C.H., 1933, Zeitsch. f. Astr., 7, 1 Pollock A.M.T., 1987, ApJ, 320, 283
Pollock A.M.T., 1995, IAU Symp. No.163, eds. K.A. van der Hucht & P.M. Williams, p.429 Pollock A.M.T., Corcoran M.F., Stevens I.R., Williams P.M., 2005, ApJ, 629, 482
Sana H., Stevens I.R., Gosset E., et al., 2004, MNRAS, 350, 809 Sana H., Antokhina E., Royer P., et al., 2005, A&A, 441, 213 Sana H., Gosset E., Rauw G., 2006a, MNRAS, 371, 67 Sana H., Gosset E., Rauw G., et al., 2006b, A&A, 454, 1047 Sana H., Rauw G., Naz´e Y., et al., 2006c, MNRAS, 372, 661 Sana H., Rauw G., Gosset E., 2007a, ApJ, 659, 1582 Sana H., Rauw G., Sung B., et al., 2007b, MNRAS, 377, 945 Sana H., Naz´e Y., O’Donnell B., et al., 2008, New Ast., 13, 202 Schild H., G¨udel M., Mewe R., et al., 2004, A&A, 422, 177 Schumann J.D., & Seggewiss W., 1975, IAU Symp. No.67, p.299 Seggewiss W., 1974, A&A, 31, 211
Shapley H., & Sawyer H.B., 1927, Harvard College Obs. Bull., 846, 1 Smith L.F., Shara M.M., Moffat A.F.J., 1990, ApJ, 358, 229
St-Louis N., Drissen L., Moffat A.F.J., et al., 1987, ApJ, 322, 870 Struve O., 1944a, ApJ, 100, 189
Struve O., 1944b, ApJ, 100, 384 Swings P., 1942, ApJ, 95, 112