T
HE
E
CONOMIC
F
UTURE OF
P
ERIPHERAL
R
EGIONS
Literature review with a focus on the impact of information
technology and the experience of Nordic countries
Jean-Dominic LACAS, Mario POLÈSE and Richard SHEARMUR
INRS-Urbanisation, Culture et Société, Montréal.
Study submitted to Economic Development Canada.
TABLE OF CONTENTS
Introduction ... 3
Structure of the Document ... 3
Documented Sources ... 4
PART 1 – Recent Writings Concerning Regional Development ... 6
1.1 Neo-Classical Model of Regional Convergence... 6
The impact of dividing territory and scale of analysis... 8
A reversal of the general tendency of convergence?... 8
1.2 The knowledge economy and factors in regional economic development... 10
Human capital, economic agglomeration and cumulative effects ... 11
The impact of new information and communication technologies (IT)... 13
Preliminary Conclusions ... 15
PART 2 – Europe’s Northern Regions ... 16
2.1 Country Profiles ... 16
Finland ... 16
Sweden... 17
Norway... 17
Scotland... 18
2.2 Statistical Analyses for Scotland, Sweden, Norway and Finland ... 19
Statistical Survey ... 20
2.3 Statistical Analysis for the Selected Peripheral Regions... 22
The peripheral regions of the northern part of the European Union ... 22
Conclusion : Common Aspects of Nordic Peripheral Regions ... 27
Part 3 – Regional Politics in the Countries of Northern Europe ... 27
Absence of programs that are addressed specifically for peripheral regions ... 28
3.1. Supra-National Programs... 29
OECD ... 29
Regional Policies of the European Union... 29
The FEDER Program ... 30
The LEADER Program ... 30
The “Northern Periphery” Program... 31
The Nordic Council of Ministers ... 32
3.2 National Programs... 32 Finland ... 32 Sweden... 33 Norway... 33 Scotland... 34 Conclusions ... 34
Territorial Impact of the Information Economy ... 34
INTRODUCTION
In November 2000, Economic Development Canada gave the INRS a mandate to conduct a Comparative Overview and Monitoring Programme on peripheral economies. The program is structured around three axes. The first is comprised of a detailed statistical analysis in order to understand the spatial dynamic of the Canadian economy, with special attention given to the peripheral regions of Quebec and Atlantic Canada. The second focus is to examine specific peripheral regions of Quebec and Atlantic Canada with the goal of having a detailed understanding of the situation in these regions as well as needs, interventions and emerging practices related to economic development.
The third axis is structured around an international comparative analysis. It is composed of two parts: 1) a workshop to take place in October 2001 attended by specialists of Scottish, Norwegian, Swedish and Finnish origin; 2) a preliminary review of the literature regarding economic development in the peripheral regions of these countries. The goal is to prepare a statistical portrait of these regions as well as to review the politicies that could influence regional development (INRS, 2000). This review will also serve as a preparatory document for the workshop. This document was prepared with these three axes in mind.
STRUCTURE OF THE DOCUMENT
In the following paragraphs, we describe the literature that has been consulted in order to set the limits of our research. Such limits are needed since choices need to be made between, on the one hand, a complete synthesis of the literature, which would lead to a very detailed document, or, on the other hand, an overview of the literature which risks being too general. The first part of this report will examine the scientific literature regarding regional economic processes. In this section, we introduce certain important concepts in regional analysis, all of which are based on the new global context within which peripheral regions are evolving. Specific attention is placed on what is known as the information economy.
The second part of the document is comprised of a statistical portrait of the peripheral regions of northern Europe. This summary presents original compilations of published data. The statistical information on these regions is not original, however, there has been little comparative analysis of the regions of the four countries in this study (Copus et al 2000, p. 37). Some special compilations, geographic and sectoral re-classification and other changes were needed in order to obtain comparable data. The data describe changes in demographics, economic structure, and the socio-economics of peripheral regions in the four countries studied.
The third part examines regional development policies in the northern peripheral regions of Europe. We have attempted to focus on a general description as opposed to specific policies in large part because
local interventions are increasingly defined by local needs and issues. In other words, while financing and certain basic economic issues are determined by central institutions (European Union, the State etc.), it is increasingly acknowledged that each region is unique, and that local actors are the most effective in developing regionally appropriate policy (Ray 2000, Saracenno 1999). It is difficult to synthesize a series of descriptive case studies of unique regions since - by definition - each of these regions is unique.
DOCUMENTED SOURCES
There are many sources of information available concerning the politicies and evolution of regional development in Europe. These can be classified in three ways: scientific articles (see for example, Masden and Bristow 2000; Taylor and Wren 1997; Lowe and Ward 1998); reports from specialised research groups (such as NORDREGIO – a northern research group developed by the Nordic Council of Ministers, and the Arkleton Centre – the centre for research on northern rural regions at the University of Aberdeen); and, finally, the reports, papers and other documents from organizations directly implicated in the development of policy (European Union, OECD, various ministries). A fourth source, containing some sources that have already been referred to, is made up of research and reports submitted to governments or European institutions by certain specialists.
The synthesis of such a vast and varied literature is problematic for several reasons. First of all, publications that are strictly scientific (anonymously reviewed) are often very specialized and focused on very specific subjects. For example, certain authors (Marsden and Bristow 2000) rely on precise methodologies to evaluate a multitude of overlapping programs. Others, such as Martin and Tyler (2000), are interested in aspects of a question from a regional perspective. Still more, such as Taylor and Wren (1997), will look at regional questions from a national policy perspective, while others concentrate on specific issues of rural poverty.
Another common type of article is that which describes a specific intervention – a case study. Their value, while perhaps limited in the context of a literature review, is that they examine a specific aspect of a defined regional problem without presenting generalizations. However, case studies often take for granted an understanding of the overall context, and this understanding is precisely what this report is trying to deliver.
The richest literature on the northern peripheral regions is that which has come from specialized research centres. Here we find the most detailed studies (for example Copus et al 2000, Isaksen and Asheim 1997; Persson 2000; NCM 1997, etc.) that also strive for a larger view of the European context. One difficulty encountered is that these contributions have not been indexed: in other words, whatever is not available on their web sites is not readily available to the researcher. Consequently, it is difficult to make a
complete review of these works. However, these sources have greatly contributed to our overall understanding of peripheral regions of northern Europe.
A third source cited below is literature that originates from organizations such as the European Union and the OECD. These are organizations that are charged with policy implementation as well as providing advice to governments. This literature poses two problems: first, as with the literature coming from research organizations, a complete review of every report, pamphlet, evaluation etc. is impossible considering that some are published, some are of limited circulation and still more are confidential. The second problem, particularly for literature evaluating certain programs, comes from the political orientation of these groups. In the absence of external evaluations, and considering the close relationship between program administrators, national governments and the sources of information (statistical sources, program beneficiaries, development stakeholders), it is difficult to ensure objectivity. Thus, while still useful, these sources are not always the best from a scientific perspective.
It should be noted that in 1999, the new Scottish parliament created a rural development committee whose objective is to “consider and report on all matters that fall within the responsibility of the Minister for Rural Development" (http://www.scottish.parliament.uk/official_reportt/cttee/rural.htm). In January and March of 2001, a series of four reports were completed (RDC 2001a, 2001b, 2001c, 2001d) that provide a detailed description of rural Scotland. The complete reports and all of the issues that they take into account are available on the web site. This source of information is particularly rich, but the profusion of detail tends to obfuscate the wider context.
The large diversity of sources and the specific nature of some documents has meant that a great deal of summarization and synthesis has been necessary in order to paint a picture which would be coherent to non-Europeans. For example we were not able to find a document that presented in an overview of the economic situation in the peripheral regions of northern Europe. The studies of Copus et al (2000) and of the NCM (1997) provide very detailed information, while the European Union report (EU, 2000) covers all of Europe without distinguishing northern regions. However, the level of detail in these reports is such that we needed to synthesize the analysis, and rework the statistical tables that frequently cover different regions, periods and countries from report to report (Norway is not part of the EU, while Scotland is not part of NORDREGIO, only Copus et al (2000) examines the four countries). In terms of development policy and interventions, a similar effort has been made. It would have been possible to describe in detail each relevant program of the EU, or each specific intervention in a particular country, but our main goal was to approach the topic from a global perspective. These choices have dictated the form and content of the following.
PART 1 – R
ECENTW
RITINGSC
ONCERNINGR
EGIONALD
EVELOPMENTIn the following review, we report only the major conclusions of the consulted literature while integrating, from time to time, our own interpretation and ideas. We have chosen to emphasize changes the links between regional development and the knowledge based economy. Because the regional development literature is frequently general (especially the more theoretical writings), the writings we reference often do not have a specifically northern Europe focus.
It would be difficult to pretend that recent writings mark a radical departure in thinking on regional economic development. A slow evolution of thought over the past decades has taken place from models that privilege “hard” factors (especially physical capital) towards models that accentuate “soft” factors, such as human and social capital (Fukayama 1995). This evolution of thought is not limited to the area of regional economic development. It is also found in the general economics literature (Landes 1988; Olson 2000) and in the literature from international development agencies (World Bank 2000 2001; IDB 2000). In addition to classic economic factors, questions of culture, values and of local political institutions are also being considered.
The differences (or factors) of development within nation-states (provinces, departments, localities etc.) are the principal focus of the regional development literature. First, we find studies that focus upon agents of regional development (or of under-development). In these works, which often deal with a specific region, the local (or endogenous) development model is at the centre of debate (we shall come back to this). We also find studies which take a more macro-economic (or macro-spatial) approach to the trends affecting the geography of national economies. Which regions are favoured or neglected? Are regional disparities growing or shrinking? In these writings, the debate frequently centres upon the neo-classical regional convergence model.
1.1 NEO-CLASSICAL MODEL OF REGIONAL CONVERGENCE
The neo-classical model of regional convergence (whose roots are found in general equilibrium models of the economy) predicts the long term convergence of regional economies in a country – especially in terms of salaries, rewards from capital investment and productivity – as obstacles to the free movement of factors of production are removed. If the mobility of labour and capital is assured, poor regions will catch up with richer ones and socio-economic disparities between regions will disappear over the long term. From this perspective, lower costs in transportation and communication, such as the introduction of new information and communication technologies (NICT), should favor the convergence of regional economies and reduce socio-economic differences.
Interest in regional convergence has existed since the 60’s but in recent years, it has seen a resurgence, particularly in the work of Barro and Sala-i-Martin (1991, 1995). Several recent studies look at economic convergence between countries as well as within them. Most examine convergence (or divergence) trends of per capita income and production. Most research (including that dealing with Canada: Coulombe 2000) has confirmed the trend towards convergence of per capita income and productivity between regional economies in industrialized countries. This result is not surprising in that economic integration will - nearly as a matter of course - lead to a reduction in socio-economic disparities in a country: this is, in effect, one of the principles which underpins the foundation of the European Union and other free trade groups. But does this mean that general trends (market trends), of which population movement is one, will alleviate development problems experienced in peripheral areas?
Despite the logical coherence of the neo-classical model and the amount of empirical study that exists, it is of limited use when examining the problems of development in peripheral regions as we have defined them. Analysis that emphasizes productivity can mask changes in employment (Cuadrado-Roura et al. 2000; Martin and Tyler 2000). For example, a region that increases its productivity at the expense of employment will be seen as converging with wealthier regions even while the level of employment (and population) could be declining. Moreover, a rise in productivity and salaries – especially if they occur in the dominant economic sector – can have the effect of harming other sectors of the economy unable to offer competitive salaries. Due to the fact that the economies of peripheral regions are, as a general rule, specialized in certain dominant activities (i.e. natural resources), this is a real risk (Larsson, 2000; Persson, 2000).
Much depends upon which variables researchers choose to analyse, and how one defines “development”. Neo-classical rationale argues that migration and population decline will eventually solve any development problem facing peripheral regions. However, the model only addresses one aspect of reality (the easiest to model, Krugman, 1985); it leaves to one side the dynamic feedback relationships (more difficult to model) between productivity and geographic concentration of population and of economic activity. To the extent that the relationship is productivity and concentration is positive (Ciccone and Hall 1996; Glaeser 1998; Rauch 1993; Quigley 1998), it is conceivable that population movements from less dense (periphery) to more dense (core) areas would also increase differences in productivity. In the future, the relationship between density and productivity could strengthen as a result of the sensitivity of knowledge-based activities to externalities (see below). It is difficult to predict the outcome of these two opposite effects (the positive effect of emigration on salaries and its negative effect on productivity): it is a complex debate and one which goes beyond the mandate of this literature review. Nevertheless, it is reasonable to assume that below certain density (or market size) thresholds, the negative effects of population loss will prevail over any positive ones.
The impact of territorial subdivisions and of the scale of analysis
When examining peripheral regions, the main limitation in the literature reviewed arises from the geographical and spatial division of regions. Geographic divisions of national territory are most of the time products of administrative and political needs. Rarely are they developed with concern for an analysis based on demographic categories or geographic locations. More often than not, the “regions” that are analyzed (Canadian provinces, American states, French regions, German länder etc.) refer to relatively large (and populous) territories, each with its metropolitan centre, large or small. None of the studies referred to use a geographic division of territory that would allow for the isolation of peripheral regions. However, Kangasharju (1998) and Kangasharju and Pekkala (2000) are somewhat of an exception; we will return to these studies later.
In his study of Canada, Coulombe (2000) indicates that regional differences in levels of urbanisation are a key factor in explaining socio-economic differences as well as in explaining the convergence trends identified (this has also been confirmed when different countries are compared: Jones and Koné 1996; Ingram 1998). In other words, it is not surprising to observe tendencies towards regional harmonisation – in the neo-classical sense – between regions that possess the geographic and demographic characteristics (sufficient size, density, urban hierarchy) to benefit from the positive effects of national economic growth: these characteristics permit the 'capture' of growth. However, since the focus of our analysis is on territories that are more distant from the core and less dense, results can sometimes be different. As Barro (1991) notes, the tendency for regional economies to converge is far less clear as soon as heterogeneous regions are compared.
There is no contradiction between convergence, observed between large regions and persistent disparities within these same regions (in particular between metropolitan areas and distant zones). For example, economic harmonistaion between Quebec and Ontario in terms of per capita income is not incompatible with the continued concentration of Quebec’s economic growth in Montreal and the continuing socio-economic disparity between the city and peripheral areas of the province. Intra-regional geographic concentration and regional convergence can go hand in hand. Thus, the geographic subdivision and the size of regions used can have a major effect on observed results. Convergence may be occurring at one scale but not at another. Consequently, in the absence of more detailed data, one must be wary of extrapolating the conclusions of one analysis to another.
A reversal (or slowing down) of the general tendency to converge?
Recent empirical studies, of which some deal with Nordic countries, seem to indicate a break in the trend and a resurgence of regional disparities. In conformity with the neo-classical model, Kangasharju (1998)
period 1934 to 1993. The geographic divisions employed in the study are detailed: 88 regions with an average population of 57,000 people, comparable to Canada’s census divisions. However, Kangasharju and Pekkala (2000) observe an increase in regional disparities between 1988 to 1997, based on data for per capita GDP. The regions that diverged the most from Helsinki had also seen a relative decline in productivity per worker and overall employment. However, one should be careful about drawing premature conclusions since the studies used different data (per capita income vs. GDP per capita) and also because it is possible that the recent results are due to cyclical factors. As the authors point out, divergence is most noticeable during periods of recession; Finland entered a recession at the beginning of the 1990’s. Nevertheless, the regions hardest hit by this recession were in Northern Finland: these are peripheral regions according to our definition.
The possibility of a break in the trend to convergence is also evoked in other studies (Lopez-Bazo et. al. 1999; Martin and Sunley, 1998): these authors have noted that over the past 10 to 20 years there has been a slow-down in its pace, and sometimes an increase in disparity between regions. Armstrong (1995) observes, for Europe and the United States, a polarization of the rates of income growth: regions with strong growth levels are generally located close to one another while the same is true for regions with weak levels of growth. In other words, the positive side-effects of growth are sensitive to distance and do not exceed certain geographic limits. In analyzing the evolution of productivity, Cuadrado-Roura et al. (2000) point out the heterogeneity of European regions. However, regions where the rise in productivity was higher than average were characterised by economic diversity or by the presence of a major financial or industrial city. These results do not necessarily point to a simple “core-periphery” dichotomy because there are many old industrial regions in the heart of Europe (Wallonia, Lorraine etc.) that continue to have economic problems. Thus, whilst general trends can indeed be identified it is impossible to abstract from regional particularities.
In sum, the studies on regional convergence (or divergence) invite a prudent interpretation. These works highlight the impact that scale and the choice of variable can have on results. They also suggest the importance of distinguishing short-term cyclical movements from longer term structural changes. However, there are still many unanswered questions: are the recently observed increases in regional disparity of cyclical (short-term) or structural (long-term) nature? It is too early to draw firm conclusions on this matter. However, on the basis of the reviewed studies, it would be difficult to claim that we are on the cusp of a sudden redeployment of economic activities towards peripheral regions. The opposite seems more likely. The trend towards geographic concentration of economic activities and population, which began with the industrial revolution, seems to be continuing and even strengthening.
Why is this occurring? We now turn to this question, with a special reference to the impact of IT, and the 'knowledge economy'.
1.2 THE KNOWLEDGE ECONOMY AND FACTORS IN REGIONAL ECONOMIC DEVELOPMENT
In most literature on this subject, “knowledge” is identified as a source of productivity and economic development (e.g. OCDE 1996; Castells 1996). As such, this recent work continues and elaborates the tradition of noted economists such as Lewis 1955, Denison 1962 and Kuznets (1965, 1966). As with these previous works, the difficulty for current researchers lies not in affirming the importance of knowledge (difficult to refute), but rather in its rigorous definition and measurement. Basically, knowledge is considered, on a conceptual level, as a distinct factor of production distinct, just like capital and labour; but this distinction does not solve the measurement problem. In general, it is data on workforce education levels or R&D investment which have been used to evaluate the "knowledge" content of economic activity. As such, in Quebec it is estimated that high-knowledge activities (those intensive in R&D and in human capital1) were responsible for 46% of new employment created between 1984 and 1999 (MIC 2001).
Our objective is not to enter into a debate over the definition of the knowledge economy. It is sufficient to say that knowledge (information, technological progress...) is an essential factor of production and is therefore closely related to increases in productivity. This factor can be embodied in capital, in words (both on paper and in virtual space), but most of all in human beings by way of accumulated knowledge, experience, know-how and intuitions. The more recent concept of “social capital” has augmented these individual characteristics with wider ones such as values, informal relations and institutions that can also contribute to increases in productivity and to the creation of a prosperous society. A vast literature is evolving on this topic - and on its links with economic growth - (Aheim and Cooke 1999; Brown and Duguid 2000a; Edquist & Johnson 1997; Fukayama 1995) without yet arriving at rigorous or exact definitions or prescriptions (Hudson 1999; Markussen 2000; Staber and Morrison 2000). Indeed, the concept of social capital – something that develops from the interactions and operations of an entire society -- and the lack of precision which such a vast concept engenders makes any prescription hazardous: for the time being one can at most contend that social capital is a form of knowledge (or of know-how) embodied in people, groups of people, in their collective memory and in their institutions.
All of these concepts and ideas bring us back to a general statement which summarises the state of our knowledge (or ignorance): economic development, and in particular regional economic development, is a complex affair where geographic, social, cultural and political factors mingle and interact. If the explanation was clear and the solutions obvious, there would be no poor regions (or countries). The advent of an information economy only adds to this complexity. It is precisely because knowledge is an intangible factor, not palpable, inscribed in people's heads and in the collective memory, that it lends itself
with great difficulty to exercises of mathematical modelisation. What economists call “externalities” and “overflow effects” play an important role in the creation and transformation of knowledge. In this context it is probable that the importance of externalities associated with large cities will be even more apparent in the future (Knight 1995); hence the drift towards “softer” models and concepts.
HUMAN CAPITAL, ECONOMIC AGGLOMERATION AND CUMULATIVE EFFECTS
If we accept the positive relationship between human capital and local economic performance (again, difficult to refute, Shearmur 1998), the emigration of skilled and educated workers from less dense and less rich areas to more prosperous areas accentuates regional disparity (in terms of development potential). This process promises to be more influential in the future as human capital increases in importance as a key factor of regional comparative advantage. Canadian researchers, like their Nordic counterparts, show that emigration of young (and more educated) people from peripheral regions to central ones continues.
The cumulative effect of the geographic concentration of talent is the basis of work by several authors (Florida, 1995; Hall 1999; Knight 1995; Porter, 1990). They often emphasise the influence of positive externalities associated with the accumulation of knowledge, which in turn often rests upon knowledge networks in specific industries (Asheim and Cooke 1999; Cox 1995; Brown and Duguid 2000b). The accumulation over several decades of talents and businesses gives rise to regional comparative advantages which other regions find difficult to imitate: thus an initial advantage will bring about further investment. The overall result depends on the cumulative strength of the process. Feldman (1994) emphasises the relationship between innovation and space; innovative "places" stimulate - in his view - the establishment of creative enterprises. For Krugman (1991), the concentration of one industry in a specific place is often a historical accident, but once the process begins, the initial advantage becomes “fixed” and a series of cumulative effects follow.
Activities associated with the knowledge economy (intensive in R&D and human capital) are thus expected to be more sensitive to agglomeration economies than more traditional activities (Storper 1992; Markusen 1996). Numerous authors have noted that knowledge-based activities are spatially concentrated (Audretsch and Feldman 1996; Coffey and Shearmur 1998; Delaplace 1993; Shearmur 1997). Amongst the reasons put forward to explain this are the concentration of a diversity of knowledge providers; the presence of a pool of specialized and educated labour; the proximity of research centres and universities as well as the existence of business and industrial associations (Breschi 2000; Lung et al 1999). It is not necessary to evoke the cases of Silicon Valley or of route 128 (outside of Boston) to highlight the importance of agglomeration economies for key sectors of the knowledge economy.
1
The new vigor of agglomerative forces is especially evident in sectors with high artistic or technological content, sometimes grouped together under the terms “entertainment industry”, or multimedia. The need for a great diversity of talent to be close at hand explains, in large part, the importance of agglomeration in these sectors. For example, the creation of a film, television program, music video or even a publicity campaign requires a disparate collection of specialists such as singer-songwriters, editors, camera technicians, engineers, marketing specialists, actors, musicians, computer programmers and animators: the combination depends upon the product. In these circumstances, is it surprising that these industries are concentrated in some of the major cities of North America such as Los Angeles, New York, Toronto and Montreal?
The concept of agglomeration economies is not a new one. A century ago, Alfred Marshall spoke of the advantages of having a specialized pool of labour and of the creative dynamics engendered by the geographic concentration of skills and businesses (Jourdenais and Desrochers 1998; Brown and Duguid 2000b). Economists and management gurus are in the process of rediscovering the importance of agglomeration economies (Krugman 1991; Porter 1990, 1996; Quigley 1998): this is perhaps the best indicator of their strategic role in the knowledge economy. The vocabulary may have changed: today one speaks of “clusters”, or in French, “grappes”, yet the idea remains very similar. At its most basic it consists of understanding and qualifying the advantages of geographic concentration for certain sectors of the economy. The literature from Nordic countries is no exception: in a study of 300 foreign-owned subsidiaries in Sweden, Ivarsson (1999) found that more than half were located in clusters.
Other terms recur in the literature on this topic, and these differ according to the ideological bent or disciplinary affiliation of the author: “the new international division of labour”, “flexible production”, “post-Fordism”, “global cities”, “the network society”’ etc. (Castells 1996; Esser and Hirsch 19899; Hall 1999; Sassen 1991; Storper and Scott 1992). Whatever the vocabulary used and the analytical approach (Marxist, neo-classic etc.), all agree on a basic fact: the evolution of modern economies will favor some regions over others. All speak, with different discourses, of the importance of networks, of synergy, of places of creativity and diversity, and of the concentration of talents and minds. How will peripheral regions, those regions without high population density and important economic centres, evolve in the the knowledge economy? Initial indications are not very positive. Even the new international division of labour (with the locational flexibility it gives multinationals), which could possibly benefit low-salary regions, does not seem likely to help peripheral regions a great deal. Indeed, salaries in these regions are often relatively high because of the capital intensity of activities based on the extraction and transformation of natural resources.
It should be noted, however, that geographic concentration does not occur uniformly in all sectors and for
all regions. The enthusiasm which has developed around notions such as “clusters” can hide other, more
traditional, considerations. Malmberg et al (2000), in their detailed empirical study of Swedish exporters, emphasise the importance of internal economies of scale (at the plant and company level). Transportation costs, which, in the context of a non-material economy can indeed lead to spatial concentration (Krugman, 1995), are a factor of dispersion for sectors dependent on the exploitation of natural resources that are difficult to transport (Dicken and Lloyd, 1990). Despite recent trends, and despite the sometimes uncritical enthusiasm surrounding the discourse on innovation, networks and proximity, there are actually few empirical studies (Malmberg et al 2000; Staber and Morrison 2000) that enable one to evaluate these ideas, to understand their impact on different sectors and on different economic activities, and, above all, to evaluate them relative to other factors of location and growth which continue to operate.
THE IMPACT OF NEW INFORMATION AND COMMUNICATION TECHNOLOGIES (IT)
What can be said of the probable impact of IT? In reducing communication costs, can information technology successfully reduce the friction of distance? One could thus hope that the advent of IT (e-mail, internet etc.) would favor distant regions. All businesses, whether in large cities or in the periphery, should end up enjoying identical access to information, the only requirement being a personal computer and a connection to a server. Studies on this question are still rudimentary, but conclusions found so far indicate that reality contradicts these hopes; it seems that IT will accelerate the forces of centralisation and geographic concentration (Castells 1996; Glaeser 1998; Gasper and Glaeser 1998; Jourdenais and Durocher 1998). How can this conclusion be explained?
The centralising effect of IT rests on two observations:
1) IT increases the possibility of centrally managing operations, especially for activities that involve economies of scale (Dicken, 1998).
2) IT is not a substitute for interpersonal communication, but is, rather, complementary and in fact increases the demand for face-to-face contact (Graham and Marvin 1996; Gillespie and Richardson 2000).
Let us examine these two explanations in turn.
It is true that IT reduces the costs of communication, and thus, in principal, the constraints associated with distance. However, they do so in both directions. Who really benefits from this: cities or peripheral regions? The net effect (in terms of transferring operations and employment) depends on the conditions of production of the activity in question. If the activity is decentralised due to the high costs associated with management and long distance marketing, the introduction of IT can provoke a centralisation of activities in larger cities (in the sense that larger cities are more amenable to efficient management and coordination). Two examples illustrate this. The introduction of IT into banking, in particular the
introduction of automatic bank machines, can have the effect of reducing employment in outlying regions (employment primarily involved in direct contact with clients) while concentrating management, data analysis and decision making in the city (O’Brien 1992). A similar rationale applies to distribution activities (such as wholesale) where the arrival of IT tends to emphasise inventory and operations to the detriment of local distribution activities. Still, everything is dependent on the type of activity in question. But we have discussed in previous sections how the evolution of modern economies have generally favoured activities that are sensitive to agglomeration economies. If this is indeed the case, the introduction of IT will accelerate the tendency towards geographic concentration.
Is it not reasonable to assume that IT will in the future reduce the need for interpersonal contact (one of the central functions of a city), and thus reduce the need for economic actors to travel ? If we use e-mail, there is no need to meet face to face. Following the same logic, there should be a reduced need for physical meeting places in the future. However, the opposite seems to be the case: IT, far from being a substitute for interpersonal contact, are actually creating new needs (Graham and Marvin 1996; Gillespie and Richardson 2000; Niles 1994). Here, an analogy to the introduction of the telephone is revealing. Its introduction did little to slow the pace of urbanization and geographic concentration. In fact, the opposite occurred. As was the case with the telephone not so long ago, communication using an electronic “voice” creates a new need to contact and meet. The increase in air travel and the proliferation of business conferences (conventions, fairs, congresses etc.) are the most obvious examples of this. The effect of centralization due to increasing travel demand (national and international) is accentuated by the weight of economies of scale associated with air transport, which favours the concentration of services in high density nodes or markets.
We should also note that the cost savings related to IT are limited to communication, that is to say, to the costs of transmitting information. Costs associated with the transportation of goods and people are hardly affected. In peripheral regions, commerce is largely linked to goods that are often heavy (minerals, metals, wood etc.) or perishable (fish and seafood, food). No change in technology is anticipated that will affect the transportation of people and goods. Distance continues to affect economic activities that are dependent on transportation. Moreover, as Glaeser (1998) suggests, the opportunity cost of time (the cost that we attribute to lost time) is increasing in industrialized societies then the opportunity cost of travel must be increasing as well. IT will not end what some call the “tyranny of distance”.
The confusion that surrounds the probable impacts of IT is related, at least to some extent, to the scale of analysis and thus, once again, to how territory is divided. Authors who put forward the decentralizing powers of IT, thus the potential for “telecommuting”, are implicitly situating themselves within a limited geographic area (Jourdenais and Durocher 1998). The ability to work at home in front of a PC, or the possibility for a business to be located outside a city, will not necessarily reduce the need for travel or
meetings. In light of the preceding paragraphs, it is more reasonable to assume that the need to be in contact with the city will remain important and the cost, monetary or otherwise, of travel will continue to act as an impediment. It is true that several researchers (notably Beyers 2000; Beyers and Lindhal 1996) have documented the presence of professional services in remoter rural areas. They noticed that the presence of such services was made possible by IT, but is also due to other important factors. Most service providers had developed their skills, expertise and networks in large urban centres before installing themselves in distant regions. Also, the proximity of a major airport “hub” (for example, Chicago, New York or Los Angeles) is important (Echeverri-Carroll and Brennan 1999) because face to face contact with clients and suppliers remains of paramount importance.
A recent study regarding the distant regions of the highlands in Scotland (Newland and Ward 1999) provides some empirical confirmation. The authors conclude, after a study of 167 businesses, that:
“the deployment of new information and telecommunication technologies has improved the efficiency of businesses located in the Highlands, but this is true everywhere, at both the national and international level. Nothing indicates that the rate of change in the Highlands is any higher than anywhere else. ... the endowment of a region with an advanced telecommunications infrastructure is not enough to guarantee the decentralisation of economic activities (Newman and Ward, p. 269)”
In our opinion these lines summarise the dilemma of IT for distant regions. The potential for decentralisation exists, however, its possibilities remain limited, except in certain cases, to areas that are within one hour of travel (100-150 km) from a major city. The regions with which we are concerned are beyond this radius.
PRELIMINARY CONCLUSIONS
Our analysis, though still preliminary, does not incite us to optimism regarding the future of peripheral regions in the information economy. “New” factors of development continue to favour large cities. Growth activities associated with the knowledge economy are sensitive to agglomeration economies. IT, far from promoting the decentralisation of population and economic activity, risks accelerating the tendency towards geographic concentration in large cities and the regions near them. In an economy where value added is increasingly linked with knowledge, businesses will locate near regions where knowledge-based activities are located. For peripheral regions, the cumulative negative effects of the emigration of youth and the brain drain risks to be a dilemma in the future.
We shall now turn to the peripheral regions of northern Europe, and see how they have evolved in this new context. The specific focus will be on Finland, Sweden, Norway and Scotland.
PART 2 – E
UROPE’
SN
ORTHERNR
EGIONSThis part comprises two sections. The first is a literature review concerning the countries under study, and more particularly of the economies of their peripheral regions. The second part is a presentation of statistics pertaining to each country which enable rough comparisons in terms of population, economic structure and socio-economic factors.
2.1 COUNTRY PROFILES
Most of the information in this section has been acquired from the EU (LEADER: www.rural-europe.aeidl.be), the Nordic Council of Ministers (NCM 1997; 1999) as well as Russwurm (2000) for Norway. All other sources are mentioned directly in the text.
Finland
This country of 5.1 million inhabitants is the most northern country in Europe situated between 60°and 70° latitude. A quarter of the country is located above the Arctic Circle. The land is characterised by lakes that occupy 10% of the country’s area and forests that cover 60% of total surface area.
Wood is at the centre of a series of related industries that make up the most important part of Finland’s economy as well as its largest export sector. The wood industry is primarily centred around the production of sawn lumber, particle board, joinery, prefabricated homes, wood fibre panels as well as paper (second largest producer after Canada) and boxes. Other activities are important in the Finnish economy. Mineral industries and construction employ 35% of the industrial work force and occupy second place in export earnings.
The electronics and telecommunications sectors are another important economic pole, especially considering the global success of Nokia (mobile phones), the largest exporter in the country. Interestingly, Nokia maintains an important production plant in the small town of Oulu (100,000 people) located 600 km north of Helsinki which does not seem to suffer due to its distance. This Baltic port city, founded in 1531, provides access to the northern Finnish hinterland and provides a link from the Baltic towards the arctic regions Barents. However, beyond this “classic” role, the city has developed a node of high-tech enterprises around its university. This university, with 13,000 students and 3,000 employees is an important structural element in the city. In 1996, a year in which northern Finland had a net loss of 3 703 population, Oulu’s population actually grew by 1,372 people (Ville d’ Oulu, 1998). It is clear that Oulu is not only an important northern city, but also an important engine of economic growth. The city merits a more in-depth study.
Finland is one of the European countries most affected by the 1990’s economic slowdown (Tervo 1998) and a number of regions have felt the negative impact of losing the Soviet market (Eskelinen et. al. 1997). Rural and peripheral zones were particularly affected by this. In these areas the unemployment rate surpassed the 1996 national average of 16%. In certain villages in Lappi the number of people without employment even reached 50% of the active population. Although there has been some recent improvement, in general, the northern peripheral regions of Finland continue to have an unemployment rate higher than the rest of the country.
Sweden
Sweden is the largest and most populated of the Scandinavian countries. It has a population of 8,816,381, unequally distributed between the north and the south. The southern half of the country has most of the population concentrated in the three large cities of Stockholm, Göteborg and Malmö as well as a number of smaller cities. This distribution can be explained by the strong forces of urbanisation that began in the 1950’s. Rural areas witnessed a decline in population that continued until the early 1980’s when there was a slight slowdown in the exodus. Those rural regions that did see their populations grow, were usually located in the peri-urban areas around cities. Remote regions are still recording a steady decrease in population (Persson, 2000).
The rural regions of Sweden can be divided into three industrial categories. The northernmost region has very low population densities but is well provided in terms of forest and mineral resources. Steel, smelting, paper and wood represent the principal export sectors of the Swedish economy. The south of the country, while also endowed with much forest, is primarily an agricultural region dominated by livestock farming. Finally, the “Swedish archipelago”, the group of islands belonging to Sweden, is largely based around leisure activities.
Norway
Norway, which counts only 4,4 million people, is the only country studied that is not part of the European Union. Its two principal cities are Oslo with a population of 900,000 and Bergen, an important centre of petrol production with a population of 200,000. During the first half of the 1990’s, the Oslo-Akershus region saw the largest growth of population in comparison to other regions. Nevertheless, the demographic decline in the north in favour of the south decreased considerably between the 1980’s and 1990’s. This is not necessarily a sign of more sustainable development in the north. Norway profited greatly from high oil prices which allowed it to maintain some growth throughout the period between 1990 and 1998. In addition, the dichotomy between the north and south is evident if employment figures are considered: unemployment levels in the north remain well above those in the south. Tromso (population
50,000), the largest northern city is almost entirely dependent on government services (regional and local governments, university…) to provide employment.
Almost one-third of Norway’s exports are made up of natural gas and oil. This advantage also has allowed the country to develop some industries that are extremely energy intensive such as smelting (aluminum, ferro-silicium), base chemical products and wood transformation. Norway also possesses expertise in the construction of oil platforms and ships. Finally, fisheries and related products account for a fairly large amount of exports as well as providing employment in peripheral regions.
The dependence of Norway on natural resources, particularly natural gas and oil, raises some concern for the future. Over the past few years, electronics industries have played a growing role in the Norwegian economy. They have, however, consistently lagged behind their neighbours Sweden and Finland. For example, it is estimated that Swedish industries are two times more innovative than Norwegian ones, while the amount of money spent on research and development in Finland is double that of Norway (Tron 2000). Another major concern is the steady decline of young people and women in the rural agricultural sector (RTN, 2000b).
Scotland
Unlike the other countries discussed, Scotland is not divided between north and south so much as between east and west. Scotland is divided into two parts, the Lowlands and the Highlands which include the islands in the north. The Highlands and Islands make up a large part of the west and north of the country (including approximately ninety inhabited islands). To the east of the Highlands lies the Grampian region, the region that profits from its proximity to North Sea oil. The rural population of Scotland is distributed amongst a number of small communities that are frequently isolated not only from the two large cities of Glasgow and Edinburgh, but also from the smaller towns on which they depend. The difficulties associated with transport and communication amplify this isolation and complicate the development of even the most basic of services.
These regions are dependent mostly on the primary sector, in particular, livestock farming and agriculture and also fishing, forestry and aquaculture. Most of these sectors have been unpredictable due to low prices as well as extraneous crises such as mad cow disease. Recently, there has been more emphasis placed on developing tourism by focusing on natural and cultural heritage.
In terms of demographics, there is evidence that a fair number of qualified and educated people have begun to move back to isolated areas, mostly out of the desire for a different way of life. Nevertheless, this phenomenon has not affected the most peripheral regions such as the Hebrides, Shetlands as well
as the Lochaber, Caithness, Sutherland and Galloway counties. These places continue to see an exodus of the young.
2.2 STATISTICAL ANALYSES FOR SCOTLAND, SWEDEN, NORWAY AND FINLAND
Despite the profusion of statistics, the obtention of comparable data and concerning European regions is somewhat problematic since Norway is not part of the European Union and Scotland is not part of the Nordic Council of Ministers (NCM). Due to the fact that a simple literature review cannot provide us with good comparable data, we have prepared tables of data that are similar to our existing data on peripheral regions in Quebec and Atlantic Canada. These data come from varied sources and have been compiled in order to create comparable statistics. A European Union publication regarding the socio-economic situation in the EU (EU 2000) served as a starting point while the profile of northern regions from the Nordic Council of Ministers (NCM 1997) and the study of Copus et al (2000) on the northern periphery were also used. Finally, several web sites such as the European Fund for Regional Development (FEDER, http://www.inforegio.cec.eu.int) were also useful.
The following regions were retained for analysis (see map 1 in the annex, to which numbers below refer):
Sweden: Övre Norland (4), Mellestra Norland (5) and Norra Mellansverige (6). It should be noted that the Norra region is located relatively close to Stockholm (the closest part being only 120 km from the capital). It is comprised of a coastal zone to the north of Stockholm as well as a large “back country” extending towards Norway. The first two (the northernmost ones) extend from the Baltic across to Norway.
Finland: Pohjois-Suomi (3), Itä-Suomi (2) and Vali-Suomi (1). Pohjois, the northernmost region, is on the Baltic coast and extends east towards Russia, north towards Norway and west towards the Swedish region of Övre-Norland. The region of Itä-Suomi is located in the border region alongside Russia while the Vali-Suomi region extends from the Baltic to Itä-Suomi.
Scotland: Highlands and Islands (10) and Grampian (11). The Highlands and Islands region is located in the northwest of Scotland and is made up of the highlands and northern and wetsren islands. The Grampian region lies to the east, includes Aberdeen, and is adjacent to the oil regions of the North Sea.
Norway: Trondelag (9), Nordland (8) and Troms (7). These regions constitute the entire coastline to the north that surrounds Sweden with the sole exception of the northernmost region, Finnmark.
STATISTICAL SURVEY
In order to situate these European peripheral regions in a wider context we provide a brief statistical portrait of Scotland, Norway, Sweden and Finland.
Table 1 – GDP per capita (Europe = 100, based on purchasing power PPP)
Scotland Sweden Finland Norway
1986 92.4
111.5
99.7 -1996 98.3 101.2
96.9
123*increase +6.4% -9.3% -2.8% + 10%*
* The numbers for GDP/capita for Norway are from 1994. The Norwegian growth is for the period 1991 to 1994.
Source : EU, 2000; calculated from the Nordic Council of Ministers, 1997.
There exist important differences in the GDP per capita between the four countries studied as well as sizeable fluctuations when compared to the averages of all 15 EU countries. During this period these countries experienced structural changes, especially Sweden and Finland. Sweden removed restraints and controls on the flow of capital that resulted in capital flight in the late 1980’s. At the same time, economic liberalisation contributed to a profound restructuring of the Swedish social system that was – and to a large degree, still is – based upon strongly redistributive principles. Finland, for its part, was affected by the fall of the Berlin wall and crisis in the former Soviet Union which resulted in the loss of an important market. Meanwhile, Norway and Scotland have benefited from North Sea oil rents and, especially in Norway, a fishing industry that has remained fairly profitable (SMEPOL 1999; NCM 1997).
It is important to be wary of GDP comparisons - in spite of their wide-spread use in the literature on the EU (NCM 1997; EU 2000). These comparisons (based on purchasing power parity) necessitate the conversion of money into a common unit. For example, the increase in GDP in Scotland could be partially attributed to a strong Pound sterling despite statistical attempts to minimize this phenomenon. In the same way the collapse of Swedish kroner and Finnish marks during the early 1990’s could partially explain the reduction in GDP per capita.
Table 2 - Total Population (‘000)
Scotland Sweden Finland Norway
1980 - 8 302 4 792 4 079
1990 5 027 8 526 4 975 4 233
1995 5 128 8 837 5 117 4 370
people/km2 66 22 17 14
% change 80 to 95 +6.4% +6.8% +7.1%
Source : UE, 2000; adapted from NCM, 1997; Copus et al, 2000.
Between 1980 and 1995, population grew modestly in three Scandinavian countries.
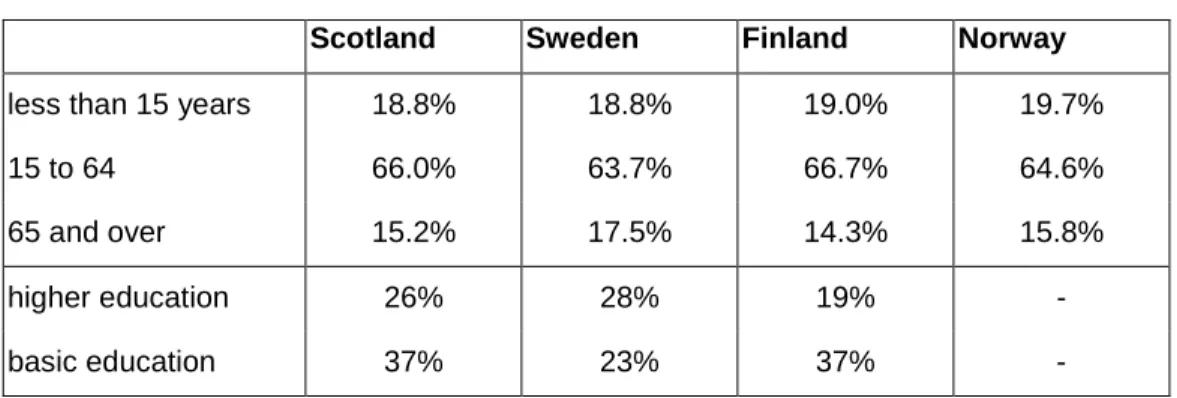
Table 3 – Age and Education Structure, 1997
Scotland Sweden Finland Norway
less than 15 years 18.8% 18.8% 19.0% 19.7%
15 to 64 66.0% 63.7% 66.7% 64.6%
65 and over 15.2% 17.5% 14.3% 15.8%
higher education 26% 28% 19% -
basic education 37% 23% 37% -
basic education: equivalent of secondary school or less
higher education: equivalent of a college education (EU, 2000, p. 64).
Source : EU, 2000 and Copus et al, 2000.
The age profiles of the Scotland and Finland are similar, with Scotland<s elderly population only slightly higher. In Sweden and Norway, the population of those considered active (15 – 64) is relatively low while the elderly population is higher.
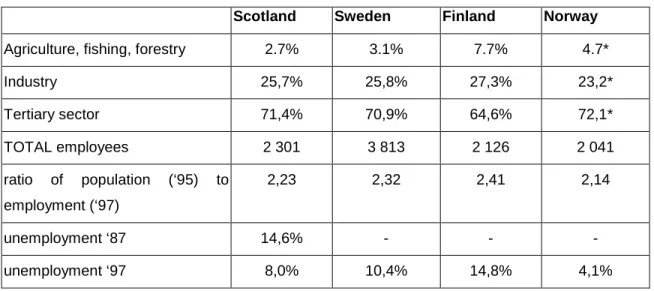
Table 4 – Economic structure (% of employees), 1997
Scotland Sweden Finland Norway
Agriculture, fishing, forestry 2.7% 3.1% 7.7% 4.7*
Industry 25,7% 25,8% 27,3% 23,2* Tertiary sector 71,4% 70,9% 64,6% 72,1* TOTAL employees 2 301 3 813 2 126 2 041 ratio of population (‘95) to employment (‘97) 2,23 2,32 2,41 2,14 unemployment ‘87 14,6% - - - unemployment ‘97 8,0% 10,4% 14,8% 4,1%
* For Norway, the numbers come from Copus et al (2000) and represent the primary, manufacturing and tertiary sectors. The Norwegian numbers are defined somewhat diferently than those for the other countries which makes comparisons with the other countries hazardous.
Sources : EU (1999) and Copus et al. (2000).
In terms of economic structure, Finland is notable for its large concentration of workers in sectors linked with natural resource extraction and its weak tertiary sector. Norway has a very low unemployment rate as well as a low dependency ratio (number of people per job). Scotland is close to Norway in terms of its unemployment and dependency ratios while Sweden and Finland suffer from high unemployment rates and a population that is not as engaged in economic activities.
2.3 STATISTICAL ANALYSIS FOR THE SELECTED PERIPHERAL REGIONS
The peripheral regions of the northern part of the European Union
The selected peripheral regions of the EU are the object of intervention at the European level. The interiors of Sweden and Finland have been classified by FEDER (up until the year 2000) as objective 62: these are regions where population density is very low -- less than 8 per km2. The majority of their coastal zones have been classified objective 2 (regions that specialise in manufacturing industries, with an unemployment rate greater than the EU average, and with declining manufacturing employment) or objective 5b (regions with low GDP per capita, a tendency towards population loss and a specialisation in agriculture).
In Scotland, the western part of Grampian – also the farthest from the oil producing region – is classified as objective 5, while the Highlands and Islands are classified objective 1. This last objective is for regions
where there is extremely low GDPper capita (less than 75% of the European average) or regions that merit specific attention. This classification differs from those used in Sweden and Finland, and does not necessarily indicate a fundamental difference between regions because objective 6 (see above) was created when Sweden and Finland joined the the EU, and only applies to the regions of these new member countries. Since 2000, the Scandinavian regions have joined Scotland in objective 1 of the 2000-2006 plan (see part 3).
Norwegian regions do not enter into these classifications because it is not a member country of the EU.
TABLES
Statistical tables are presented below with some commentary. However, the main objective of this section is to present an original compilation of data in order to be able to compare these regions and, importantly, to compare these regions to the Canadian ones under study.
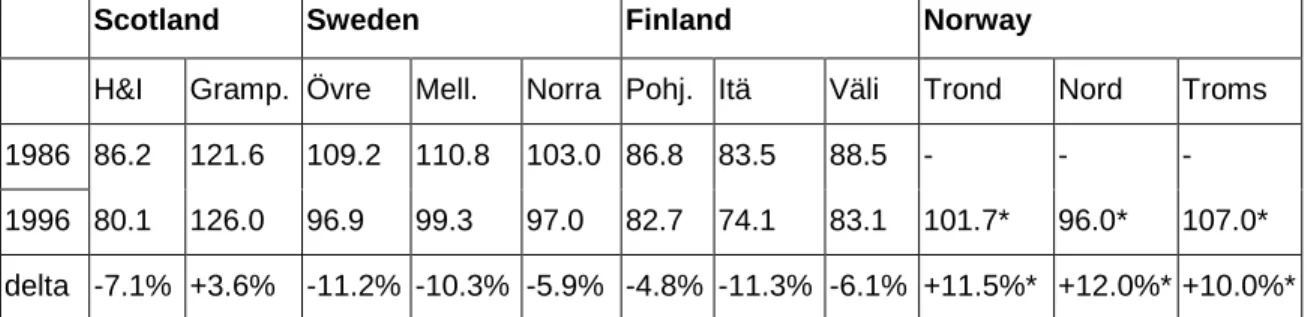
Table 5a – GDP per capita (European Union average
= 100, purchasing power parity)
Scotland Sweden Finland Norway
H&I Gramp. Övre Mell. Norra Pohj. Itä Väli Trond Nord Troms
1986 86.2 121.6 109.2 110.8 103.0 86.8 83.5 88.5 - - -
1996 80.1 126.0 96.9 99.3 97.0 82.7 74.1 83.1 101.7* 96.0* 107.0*
delta -7.1% +3.6% -11.2% -10.3% -5.9% -4.8% -11.3% -6.1% +11.5%* +12.0%* +10.0%*
Table 5b -
GDPper capita (relative to national
GDPper capita)
Scotland Sweden Finland Norway
H&I Gramp. Övre Mell. Norra Pohj. Itä Väli Trond Nord Troms
1986 0.93 1.32 0.98 0.99 0.92 0.87 0.84 0.89 - - -
1996 0.81 1.28 0.96 0.98 0.96 0.85 0.76 0.86 0.83* 0.78* 0.87*
delta -0.12 -0.03 -0.02 -0.01 0.03 -0.02 -0.07 -0.03 +0.01* +0.02* 0.00*
* GDP/capita for Norway is for 1994. The increase has been measured for the period between 1991 to 1994. In table 5b ‘delta’ is a measure of the difference between regional growth and Norwegian growth.
Source : EU, 1999; adapted from the Nordic Council of Ministers, 1997.
The coastal regions of the North Sea – those located in Norway and Scotland – are distinguishable by their high level of GDP per capita (table 5a). Swedish regions, while close to the European average, suffered some major setbacks between the period of 1981 and 1997. This also occurred in Finland and in the Highlands and Islands of Scotland. Despite the fact that the period is different, it is still clear that the
peripheral regions of Norway have benefited from a marked growth in their GDPper capita. With respect to comparisons with national averages (table 5b), aside from peripheral regions in Norway, all peripheral regions are in decline (the only other exception being Norra in Sweden). However, despite improvements vis a vis the national average, the peripheral regions of Norway are still far behind, as are those of Finland.
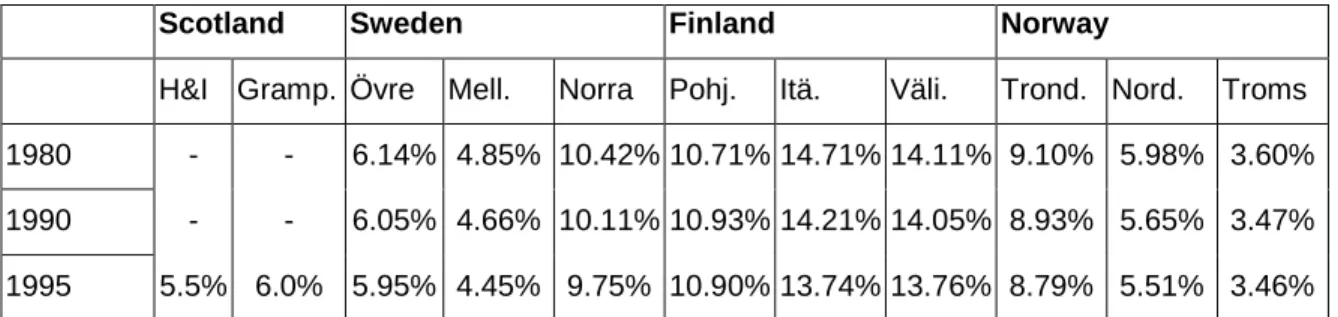
All in all, the peripheral regions of northern Europe have a fairly stable population (table 6a). However, while most regions have seen a small decrease in population, some, notably those in the north of Finland, have seen an increase. Amongst the regions studied, the Grampian region is notable for its high population density. It should also be noted that, apart from the Pohjois in Finland, peripheral regions have a population growth that is smaller than the overall national growth rates and that their population as a percentage of total population has declined sharply (table 6b). In other words, these regions are experiencing a relative population decline, even if it is not always an absolute decline.
Table 6a – Total Population (‘000)
Scotland Sweden Finland Norway
H&I Gramp. Övre Mell. Norra Pohj. Itä. Väli. Trond. Nord. Troms
1980 - - 510 403 865 513 705 676 371 244 147 1990 - - 516 397 862 544 707 699 378 239 147 1995 280 531 526 393 862 558 703 704 384 241 151 people /km2 (95) 9.2 61.0 3.4 5.5 13.4 4.1 8.3 15.1 13.1* 9.8* 6.7* % 80 to 95 - - +3.1% -2.5% -0.4% +8.8% -0.3% +4.1% +3.5% -1.2% +2.7%
Table 6b - Population as % of national population
Scotland Sweden Finland Norway
H&I Gramp. Övre Mell. Norra Pohj. Itä. Väli. Trond. Nord. Troms
1980 - - 6.14% 4.85% 10.42% 10.71% 14.71% 14.11% 9.10% 5.98% 3.60%
1990 - - 6.05% 4.66% 10.11% 10.93% 14.21% 14.05% 8.93% 5.65% 3.47%
1995 5.5% 6.0% 5.95% 4.45% 9.75% 10.90% 13.74% 13.76% 8.79% 5.51% 3.46%
* The number of people per square kilometre is estimated for the Norwegian regions.
Source : EU, 1999 adapted from the Nordic Council of Ministers, 1997.
The age structures of the regions for which we have data differ between the countries studied. However, differences are compatible with the differences in national profile noted above.
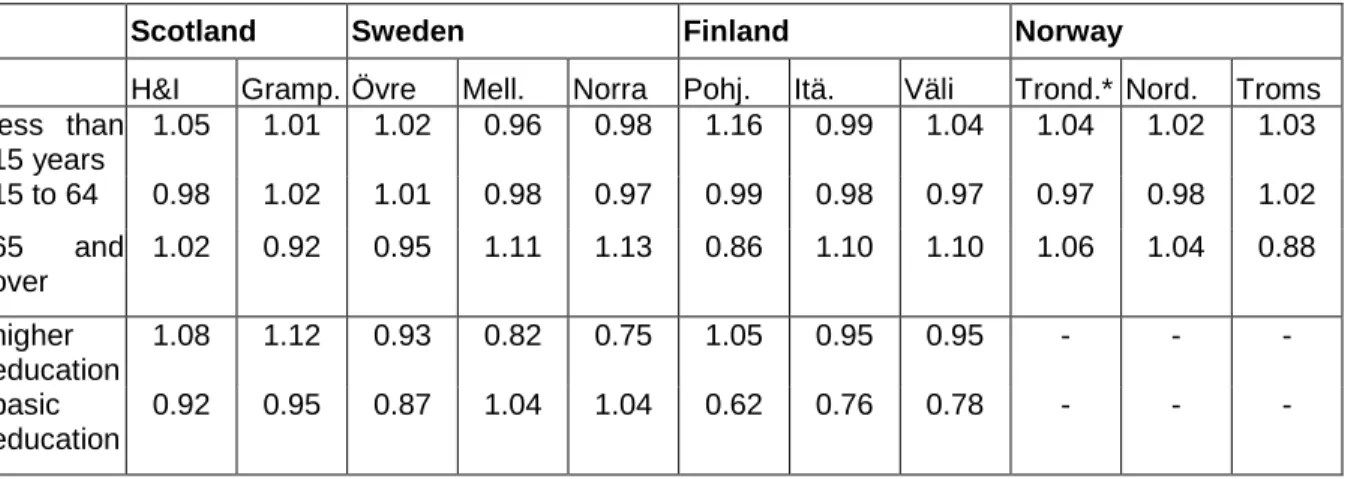
Table 7a – Age structure and education (1997)
Scotland Sweden Finland Norway
H&I Gramp. Övre Mell. Norra Pohj. Itä. Väli Trond.* Nord. Troms less than 15 years 19.8% 19.0% 19.2% 18.0% 18.4% 22.0% 18.8% 19.8% 20.4% 20.0% 20.3% 15 to 64 64.7% 67.0% 64.1% 62.2% 62.0% 65.8% 65.4% 64.5% 62.8% 63.6% 65.8% 65 and over 15.5% 14.0% 16.7% 19.5% 19.8% 12.3% 15.8% 15.7% 16.8% 16.4% 13.9% higher education 28% 29% 26% 23% 21% 20% 18% 18% - - - basic education 34% 35% 20% 24% 24% 23% 28% 29% - - -
Table 7b – Age structure and education 1997, % national = 1.00
Scotland Sweden Finland Norway
H&I Gramp. Övre Mell. Norra Pohj. Itä. Väli Trond.* Nord. Troms less than 15 years 1.05 1.01 1.02 0.96 0.98 1.16 0.99 1.04 1.04 1.02 1.03 15 to 64 0.98 1.02 1.01 0.98 0.97 0.99 0.98 0.97 0.97 0.98 1.02 65 and over 1.02 0.92 0.95 1.11 1.13 0.86 1.10 1.10 1.06 1.04 0.88 higher education 1.08 1.12 0.93 0.82 0.75 1.05 0.95 0.95 - - - basic education 0.92 0.95 0.87 1.04 1.04 0.62 0.76 0.78 - - -
* The age structure for Trondelag is only for the northern part.
Source : EU, 2000 et Copus et al (2000).
In most regions, with the exception of Grampian, Övre and Troms, the proportion of population of active age is lower than the national average (table 7b). Also, aside from Grampian Övre and Troms, the proportion of elderly is higher. Pohjois, which incorporates Lappi territory, is the only region where there is a much higher proportion of youths than the national average, although it should be noted that the Norwegian regions also have a fairly high proportion of youths. In sum, northern peripheral regions in Europe have a more elderly and fewer “active” people than nationally. The exeptions to this are Grampian, Övre, Pohjois and Troms.
Considerable differences exist between the regions studied in terms of economic and employment structure (table 8). Swedish and Norwegian regions are much more tertiarised than their Scottish and Finnish counterparts. This does not necessarily reflect the overall national economic structure (table 4). While regions in Scotland and Finland have less than 68% of their workers employed in the service sector, the Swedish and Norwegian regions, with the exception of Norra (67.5%), have more than 70% of
workers in these sectors. In Norway, there is a high percentage of service providers (especially business services). In Sweden, it is the public service sectors (including government, education, medical services etc.) that are strongly represented.
Table 8 – Economic structure, 1994 (% of employed)
Scotland Sweden Finland Norway
H&I Gramp .
Övre Mell. Norra Pohj. Itä Väli Trond Nord Troms
Agriculture, fishing and forestry 5.7% 6.1% 2.6% 3.4% 3.0% 8.7% 12.7% 12.4% 9.0% 9.5% 8.3% Secondary, mines, energy 30.4% 17.2% 17.4% 22.9% 20.5% 19.0% 24.3% 15.1% 14.1% 9.9% Construction 26.1% 6.8% 8.3% 6.6% 6.1% 5.0% 5.0% 5.9% 5.9% 6.2% Retail 63.2% 9.9% 10.2% 10.5% 8.9% 9.1% 9.3% 12.8% 11.1% 12.2% Tourism 2.3% 2.9% 2.2% 2.9% 2.3% 2.0% 2.9% 3.1% 3.5% Transpo and commun. 6.7% 7.1% 5.5% 6.9% 6.6% 6.0% 6.7% 9.9% 8.4% Business services. 1.3% 1.7% 1.2% 2.0% 2.1% 2.0% 6.1% 4.5% 5.3% Public services & other 68.0% 53.2% 49.0% 48.1% 43.9% 43.2% 39.1% 41.8% 42.0% 46.2% TOTAL 134 400 274 300 219 902 168 655 351565 163 363 201 628 216 579 154 607 93 903 62 187 ratio pop 95 : employ 94 2.08 1.94 2.39 2.33 2.45 3.42 3.49 3.25 2.48 2.57 2.43 unemploy 87 13.8% 10.0% unemploy 97 8.4% 4.8% 13.3% 13.0% 12.3% 18.6% 18.7% 14.9% 5.7%** 6.2%** 5.5%**
* For Scotland, only three sectors were available : agriculture, industry and services (EU, 2000). The numbers for Scotland are for 1997.
** For Norway the unemployment rates are for 1996 (NCM, 1997).
Source : Calculated from : EU (2000) and NCM (1997).
The agricultural, fishing and forestry sectors in Sweden are relatively unimportant in comparison to Norway and Finland, where they account for 8% or more of total employment. Scottish regions are marked by a relatively weak tertiary sector and average proportions of employment in the renewable resource sector. In Scotland, and particularly in Grampian, a high proportion of jobs can be found in manufacturing, construction and extraction activities, more so than in any other region analysed.
In socio-economic terms, Scottish regions stand out: they have an unemployment rate that is low, as is the case for Norway, as well as a low population to work ratio (also known the dependency ratio). Each job “sustains” only two people whereas all of the other regions are marked by ratios of 2.3 or more. On the other hand, the situation is more worrisome in the Swedish and Finnish regions where the unemployment and dependency rates are significantly higher. These are the same regions that experienced a decline in GDPper person (table 5a). It should be noted that differences in age structure do not account for all of this variation in dependency ratios since age structures do not differ radically across the regions studied whereas dependency ratios do. Higher dependency ratios can be explained by
of available workers, technologies, growth/decline in certain sectors, unemployment...) and demographics.
This brief statistical survey makes no claim to being exhaustive. However, in the absence of comparable data for the regions retained, these figures will at least permit general comparisons to be made across European regions, and between European and Canadian regions..
CONCLUSION : COMMON ASPECTS OF NORDIC PERIPHERAL REGIONS
Nordic peripheral regions face several common challenges which touch upon economic development in their territories. Aside from the problems generally associated with rural zones, such as a lack of services and infrastructure, the majority of the regions studied face the problem of population loss, especially of working age people: this will have direct repercussions on their future capacity to develop. Their GDPper capita is, in general, weaker that that of their respective countries and this weakness vis a vis their respective countries is increasing (except in Norway).
Despite this, the situation in certain regions – such as those in the north of Norway as well as the city of Oulu in Finland – is less worrying. Still, it is important to understand the reasons why this is so. These regions benefit from high rents accrued from resources while draining population away from their “back country” areas. In sum, it can be said that the situation of the majority of peripheral regions in Nordic countries, and especially those areas that are outside of the influence of certain urban areas, is preoccupying.
P
ART3 – R
EGIONALP
OLICY INN
ORTHERNE
UROPEWe have attempted, in this section, to identify specifically regional and territorial policies. However, overlap between different policies has rendered the task difficult. Indeed, policies that affect particular territories are not always territorial or regional policies. Rather, it is emphasised repeatedly in reports by the Rural Development Committee of Scotland (RDC 2001 a, b, c, d) that the policies which have the most marked effect on regions are those operating at the national level. For example, the difficulties experienced by Scottish fisheries can be attributed to the value of the pound sterling relative to the other European currencies (RSC 2001d, p. 111), and this same phenomenon has also negatively affected tourism. The price of fuel, which is very high in Europe, has had a dissuasive effect on tourism in outlying areas (RSC 2001d, p. 93). Fuel price also poses other more general problems for economic development in distant regions (RSC 2001d, p.88).
Our comparative tables in the preceding section confirm the importance of the “national effect”. Whilst each region has some specificity, the best way of predicting the economic health of a region is to observe the health of the country to which it belongs. The only exception is Scotland where Highlands and Islands