Contents lists available atScienceDirect
Forest Ecology and Management
journal homepage:www.elsevier.com/locate/forecoWhat controls local-scale aboveground biomass variation in central Africa?
Testing structural, composition and architectural attributes
Grace Jopaul Loubota Panzou
a,b,⁎, Adeline Fayolle
a, Ted R. Feldpausch
c, Gauthier Ligot
a,
Jean-Louis Doucet
a, Eric Forni
d, Isaac Zombo
e, Mathurin Mazengue
f, Jean-Joël Loumeto
b,
Sylvie Gourlet-Fleury
daTERRA Teaching and Research Center, Forest is life, Gembloux Agro-Bio Tech (Liège Université), Passage des Déportés, 2-5030 Gembloux, Belgium bLaboratoire de Botanique et Ecologie, Faculté des Sciences et Techniques (Université Marien Ngouabi), BP 69 Brazzaville, Republic of Congo cGeography, College of Life and Environmental Sciences, University of Exeter, Exeter EX4 4RJ, UK
dCIRAD, Forêts et Sociétés, Université de Montpellier, 34398 Montpellier, France eCIB-Olam, BP 41 Ouesso, Republic of Congo
fMokabi S.A., BP 97 Impfondo, Republic of Congo
A R T I C L E I N F O Keywords: Tree allometry AGB estimation Basal area Wood density Total height Crown size Central Africa A B S T R A C T
Tropical forests play a key role in regulating the terrestrial carbon cycle and climate change by storing a large amount of carbon. Yet, there is considerable uncertainty about the amount and spatial variation of aboveground biomass (AGB), especially in the relatively less studied African tropical forests. In this study, we explore the local-scale variation and determinants of plot-level AGB, between and within two types of forests, the Celtis and Manilkara forests, growing under the same climate but on different geological substrates in the northern Republic of Congo. In each forest site, all trees≥10 cm diameter were censured in 36 × 1-ha plots and we measured tree height and crown size using a subsample of 18 × 1-ha of these plots. We developed height-diameter and crown-height-diameter allometric relationships and tested whether they differed between the two sites. For each 1-ha plot, we further estimated the AGB and calculated structural attributes (stem density and basal area), composition attributes (wood density) and architectural attributes (tree height and crown size), the latter being derived from site-specific allometric relationships. We found strong between-site differences in height-diameter and crown-height-diameter allometries. For a given height-diameter, trees were taller in the Celtis forest while they had larger crown in the Manilkara forest. Similar trends were found for the sixteen species present in both forest sites, suggesting an environmental control of tree allometry. Although there were some between-site differences in forest structure, composition and architecture, we did not detect any significant difference in mean AGB between the Celtis and the Manilkara forests. The AGB variation was related to the heterogeneous distribution of large trees, and influenced by basal area, height and crown dimensions, and to a lesser extent wood density. These forest attributes have strong practical implications on emerging remote-sensing technologies for carbon monitoring in tropical forests.
1. Introduction
Tropical forests play a key role in regulating the terrestrial carbon cycle and climate change by storing carbon in the wood (Pan et al., 2011). The above ground biomass (AGB) of trees indeed constitutes the major carbon pool in tropical forests (Eggleston et al., 2006). Current efforts to map and monitor carbon stocks in tropical forests worldwide (Saatchi et al., 2011; Avitabile et al., 2016), that are needed for the implementation of climate change mitigation strategies, such as REDD +, rely on robust AGB estimates in specific sites that are used for the
calibration of remotely-sensed products. AGB estimates at large-scale are still fraught with uncertainty (Mitchard et al., 2014), because en-vironmental variation is rarely accounted for when local AGB estimates are extrapolated at these scales.
A huge variation in plot-level AGB has been demonstrated, at large scale in old-growth tropical forests between continents (Slik et al., 2013) and across tropical Africa (Lewis et al., 2013), and at local scale in central Africa (Gourlet-Fleury et al., 2011; Doetterl et al., 2015; Fayolle et al., 2016; Imani et al., 2017). Plot-level AGB variation is determined by variation in forest structure, composition, and
https://doi.org/10.1016/j.foreco.2018.07.056
Received 11 June 2018; Received in revised form 23 July 2018; Accepted 29 July 2018
⁎Corresponding author at: Passage des Déportés, 2-5030 Gembloux, Belgique.
E-mail address:[email protected](G.J. Loubota Panzou).
0378-1127/ © 2018 Published by Elsevier B.V.
architecture (Asner et al., 2012). Firstly, the two main structural at-tributes driving forest AGB are forest basal area and the density of large trees. As tree AGB increases with tree diameter, there is logically a strong relationship between plot-level AGB and basal area. Indeed, among all structural attributes, basal area is recognized as the most important determinant of plot-level AGB, and the relationship between AGB and basal area has been evidenced throughout tropical forests (Lewis et al., 2013; Imani et al., 2017). More recently, the importance of large trees has been highlighted (Bastin et al., 2015; Lutz et al., 2018), and specifically the density of trees greater than 70 cm in dia-meter has been shown to explain AGB variation between and within continents (Slik et al., 2013). These large trees could be more easily monitored with remote sensing techniques and then could be an in-teresting predictor of AGB at large scale (Meyer et al., 2018). Secondly, the variation in species composition, and specifically in mean plot-level wood density, has been found to determine spatial patterns in AGB across forests in Amazonia (Baker et al., 2004) and Africa (Lewis et al., 2013). Forests dominated by dense-wooded species often have high AGB. In central Africa, the high wood density of forests growing on sandy soils has particularly been shown to store large amounts of AGB despite showing relatively low basal area (Gourlet-Fleury et al., 2011). Thirdly, architectural attributes, through canopy height and area computed from tree height and crown measurements, are also im-portant determinants of plot-level AGB. Among architectural attributes the plot-aggregate allometry based on Lorey's height, which is the basal area-weighted height of all trees in a plot, is the most popular ones, because of its widespread use in AGB maps through LiDAR sensors (Saatchi et al., 2011). Plot-level canopy area could also explain AGB variations, as recently evidenced in the Neotropics (Meyer et al., 2018). Structural, composition and architectural attributes at the plot level are typically computed from forest inventory data, i.e. from all or a sub-sample of trees in a plot. In most tropical forest inventories, only tree diameter and species names are recorded which allow quantifying the forest structural (basal area, density) and composition (mean wood density from species average) attributes. In contrast, architectural measurements (tree height and crown size) are rarely available for all trees and frequently modelled from a subsampling of trees within in-ventory plots. As a consequence, height-diameter and crown size allo-metric models are applied to estimate the height and crown size for the remaining trees (Feldpausch et al., 2012), in order to compute archi-tectural attributes at the plot level. Several studies showed that using height-diameter allometric relationships established at a global scale (Lewis et al., 2009) and at a regional scale (Feldpausch et al., 2012; Lewis et al., 2013) leads to significant biases in plot-level AGB esti-mates. There is a consensus on the need for local site-specific allometric models to provide reliable AGB estimates at the tree (Chave et al., 2014) and the plot level (Sullivan et al., 2018) across the tropics, and in central Africa (Kearsley et al., 2013; Fayolle et al., 2016). Furthermore, it has been recently demonstrated that crown radius improves AGB estimates for tropical trees, in addition to more classical AGB de-terminants, namely tree diameter, wood density and total tree height (Goodman et al., 2014; Ploton et al., 2016). The variation in crown-diameter allometry (Antin et al., 2013; Blanchard et al., 2016) and the consequences on plot-level AGB variation has yet been little explored in tropical forests.
The relative contribution of forest structure, composition, and ar-chitecture to plot-level AGB variation has been poorly explored, spe-cifically in central Africa, where little is known about the amount and spatial variation of AGB (Loubota Panzou et al., 2016) and which re-main relatively understudied (Verbeeck et al., 2011). There is a need for efficient methods to monitor forest AGB that could adapt to local site conditions, given the huge variability of AGB across tropical forests and the multiplicity of factors in play. We thus explored, using a new net-work of 72 × 1 ha permanent plots, the local-scale variation and de-terminants of plot-level AGB, between and within the two mixed forest types, Celtis and Manilkara forests, growing under the same climate but
on different geological substrates (Fayolle et al., 2012, 2014). These forest types show contrasted successional dynamics and traits ( Réjou-Méchain et al., 2014), and vastly different composition and structure in the later successional stage, but similar AGB (Gourlet-Fleury et al., 2011). Wefirst tested whether height-diameter and crown allometries differed between the two forest sites. Then, we investigated how be-tween and within-site AGB variation were related to structural, com-position and architectural attributes, the latter being derived from our site-specific allometries.
2. Material and methods 2.1. Study sites
Two study sites, representative of the Celtis and Manilkara forests which are mixed forest types, were inventoried in the northern Republic of Congo. The Celtis forest site is located in the Loundoungou-Toukoulaka forest concession (2°20′N, 17°32′E) managed by the CIB-Olam company. The canopy of this forest type is dominated by light demanding tree species such as Celtis spp., Erythrophleum suaveolens and Petersianthus macrocarpus (Fayolle et al., 2014). The geological sub-strate consists of alluvium (Fayolle et al., 2012). The Manilkara forest site is located in the Mokabi-Dzanga forest concession (3°19′N, 16°76′E) managed by the Rougier company. The canopy is enriched by many slow-growing shade tolerant species that have a high mean wood density, such as Manilkara, Staudtia species (Fayolle et al., 2014). The geological substrate consists of sandstone that led to poor and highly drained soils (Fayolle et al., 2012). In both forest sites, the mean annual precipitation is around 1600 mm with a distinct dry season (December until March, with < 100 mm·month−1). The mean annual temperature is 25 °C. The topography is slightly undulating, with elevation varying between 400 and 550 m.
2.2. Tree measurements
In each forest site,field work was carried out in an unlogged area within a 800-ha experimental design (DynAfFor project,www.dynaffor. org). In this experimental design, 36 permanent 1-ha plots were in-stalled and distributed within four blocks. Each block contained nine juxtaposed plots of 100 × 100 m (1 ha) and all trees with diameter ≥10 cm were inventoried and identified to species level by a botanist. A subsample of two blocks was used to measure tree height and crown dimensions. In each block, all trees≥10 cm diameter were measured in the central 1-ha plot and one large tree was additionally sampled in the remaining 8 plots following a grid of 20 m × 20 m. A total of 2202 trees (n = 1040 trees for the Celtis forest and n = 1162 trees for the Manilkara forest) were measured in the plots over a large range of diameters from 10 to 162 cm. Moreover, we selected the most abundant species shared by the two forest sites (n = 16 species,Appendix A) and sampled their whole diameter range using additional trees measured outside the plots but within the 800-ha experimental design to complete the diameter range.
Tree diameter (D in cm) was measured with a tape at 1.3 m for regular stems or above the top of the buttresses for irregular stems. Total height (H in m) and height to thefirst branch (Hb in m) were measured with a VERTEX IV Rangefinder. Crown depth (Cd in m) was defined as the length of the crown, calculated from the difference be-tween H and Hb. Crown radius (Cr in m) was defined as the average of four perpendicular projected crown radii measured according to the four cardinal directions.
2.3. Site-specific allometric models
We developed site-specific height-diameter allometric equations using the Michaelis-Menten model. Asymptotic models have been de-monstrated to better describe height-diameter allometry for AGB
estimation in tropical forests (Sullivan et al., 2018), and the Michaelis-Menten model was found to provide goodfit to height-diameter data in central Africa (Fayolle et al., 2016). The model form is:
= × +
His as Dis/(bs Dis) (1)
where asand bsare site-specific parameters, His(in m) and Dis(in cm)
represent, respectively, the total height and the diameter of tree i within each site s.
The height to thefirst branch-diameter, the crown depth-diameter and the crown radius-diameter allometries were fitted using power models that were linearized using log-log transformation:
= × ↔ = +
yis as Disbs log( )yis log( )as bslog(Dis) (2) where asand bsarefitted parameters, y is alternatively the height to the
first branch (Hbisin m), the crown depth (Cdisin m) or the crown radius
(Crisin m) of tree i belonging to site s.
To test for a significant difference in tree allometry between the two sites, wefitted on the whole data set four models: (i) a general model withfixed parameters (a and b) for all sites, (ii) varying asand bs, (iii)
varying asandfixed b, and (iv) fixed a and varying bs. For each
allo-metric relationship, the model selection was based on (i) the likelihood ratio test that is a statistical test used for comparing the goodness offit of two statistical models (the null model withfixed coefficients, and the alternative model with varying coefficients); and (ii) the Akaike’s Information Criterion (AIC) for model selection, with the lowest AIC indicating the best model (Akaike, 1974).
2.4. AGB estimation
To estimate the AGB (in Mg) of each tree in the 36 × 1-ha plots sampled in the Celtis and Manilkara forests, we used the most recent pantropical allometric equation ofChave et al. (2014):
= ×
AGB 0.0673 (ρD H2 )0.976 (3)
Tree diameter (D in cm) was directly available from the forest in-ventory. Each stem in the plot was assigned a wood density value (ρ in g·cm−3), corresponding to the species average from the global wood density database (Chave et al., 2009; Zanne et al., 2009) when possible, and if not, to a genus-, family- or plot level average. Tree diameters from the forest inventory data were converted into tree height estimates (H in m) using the site-specific height-diameter allometric model(1). Lastly, tree AGB was summed at the 1–ha plot level.
2.5. Forest structural, composition and architectural attributes
For each 1–ha plot, we calculated five structural attributes: stem density (SD), basal area (BA in m2), stem density and basal area of large
trees (≥70 cm diameter, named SD70 and BA70) and maximum tree
diameter (Dmaxin cm). SD was the number of trees greater than or equal
to 10 cm diameter per hectare. BA was calculated as the sum of the cross-section area at 1.30 m, or above buttresses, of all trees≥10 cm diameter. Dmaxwas calculated as the 98-percentile stem diameter of the
sampled trees for each plot.
The forest composition has been assessed through the mean wood density (WDm in g·cm−3) and BA-weighted wood density (WDBA in
g·cm−3) at 1-ha plot level.
The forest architecture is the expression of the vertical (tree height and crown depth) and horizontal (crown radius) structure. We con-verted the diameter of all trees in the 36 × 1-ha permanent plots into tree height and crown dimensions (radius and depth) using the site-specific height-diameter and crown allometric equations. Similarly forest composition, two architectural attributes (mean across all trees and BA-weighted mean) were calculated at the plot-level for the height, for the crown depth, and for the crown radius.
2.6. Data analysis
Two-way ANOVA including block and site as random factors was used to test the plot-level AGB variation between the two forest sites. We then provided for each forest site, pooling the 36 permanent plots, the AGB distribution by 10-cm wide diameter class. The AGB dis-tribution was completed with the cumulative curve of AGB, showing the increase of AGB from the smallest to the largest diameter class. We used two-way ANOVA to test the between-site differences in AGB for three diameter size classes: the lower stratum with small trees (10≤ D < 30 cm), the middle stratum with large trees, most of which reach the canopy (30 cm≤ D < 70 cm), and the upper stratum corre-sponding to the largest trees, which were either in the canopy or emergent, with diameter≥70 cm (Slik et al., 2013).
We tested the plot-level forest attributes variation between the two forest sites using two-way ANOVA including block and site as random factors. To determine whether 1–ha plot AGB was related to forest structural, composition and architectural attributes, we computed Pearson correlations within and between the two forest sites as well as more integrative mixed linear models in which forest attributes were included as a covariate and site and block were included as random variables in order to account for the nestedness of the data. In addition, we studied the relationships between AGB and forest attributes using ordinary least-square regressions to determine the importance of forest attributes on AGB variation within each forest site at plot-level.
All the above statistical analyses were performed within the open source R environment (R version 3.4.1,R Core Team, 2017) using the nlme package (Pinheiro et al., 2017) and BIOMASS package ( Réjou-Méchain et al., 2017). The conditions of normality and homo-scedasticity of residuals were checked graphically and with Shapiro-Wilk and Breusch-Pagan tests, respectively. For the ANOVA test, the null hypothesis was“no difference between means for each variable”. When the null hypothesis was rejected, we conducted post-hoc pairwise multiple comparisons between means. All significant differences re-ported to P-value < 0.05.
3. Results 3.1. Tree allometry
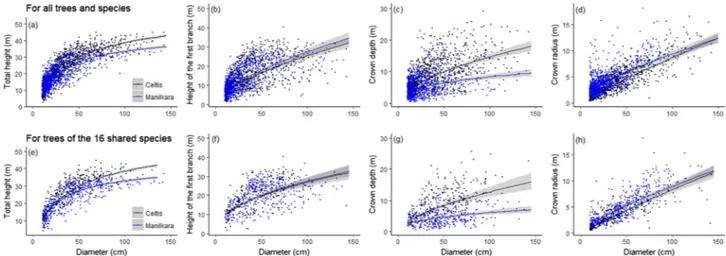
We identified a significant variation in tree allometry between the Celtis and the Manilkara forests (Fig. 1). Based on AIC, we found a site effect on one model parameter for height-diameter allometry, and on the two model parameters for the height to thefirst branch-diameter, the crown depth-diameter and the crown radius-diameter allometries (Table 1). For a given diameter, trees were taller and had a deeper crown in the Celtis forest whereas the height to thefirst branch was higher, and the crown larger in the Manilkara forest. Similar trends were found in height-diameter and crown allometries for the sixteen species shared by both forest sites (Fig. 1,Table 1). We did not evidence strong variation in thefirst branch height-diameter allometry for shared species and only little variation for all species. This result indicates that total height-diameter allometry is mostly governed by crown depth. 3.2. AGB distribution
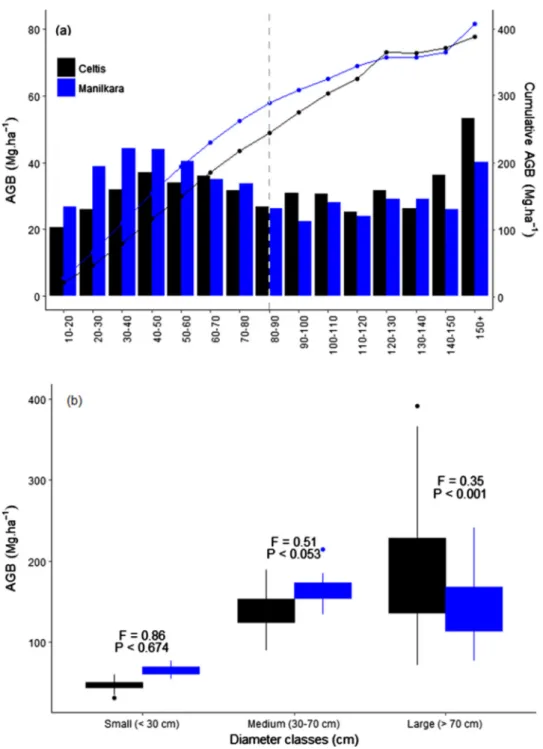
We did not detect any significant difference in mean AGB between the Celtis and the Manilkara forests (Table 2), and for the two forest sites, a large fraction of AGB is stored in the largest stems, with 50% of the total AGB stored in the trees larger than 80 cm (Fig. 2a). However, AGB distribution among 10 cm wide diameter classes reflected site-specific patterns, with higher AGB stored in the largest stems in the Celtis forest (Fig. 2a). Indeed, the AGB of the trees with diameter ≥70 cm significantly differed between the two forest sites with a higher AGB in the Celtis forest (Fig. 2b). In contrast, the AGB stored in the two lower strata (10–30 cm and 30–70 cm in diameter) was not significantly
different between the two forest sites, despite the larger number of small trees in the Manilkara forest, their respective AGB was only slightly higher (Fig. 2b).
In both sites, we detected strong local-scale variation in plot-level AGB estimates that ranged from 242 to 549 Mg ha−1with a coefficient of variation of 18% in the Celtis forest, and from 305 to 464 Mg ha−1 with a coefficient of variation of 10% in the Manilkara forest. In the Celtis forest, the AGB stored in the largest trees was even more variable across plots (Fig. 2b).
3.3. Forest attributes and relationships with AGB
At plot-level, we found that the Celtis and the Manilkara forests vastly differed in forest structure, composition and architecture (Table 2). The Celtis forest had a significantly higher density of large trees (SD70), greater maximum tree diameter (Dmax), higher total tree
height (Hmand HBA), deeper crown (Cdmand CdBA) and larger crown
(Crmand CrBA); while the Manilkara forest had a significantly higher
stem density (SD) and wood density (WDmand WDBA).
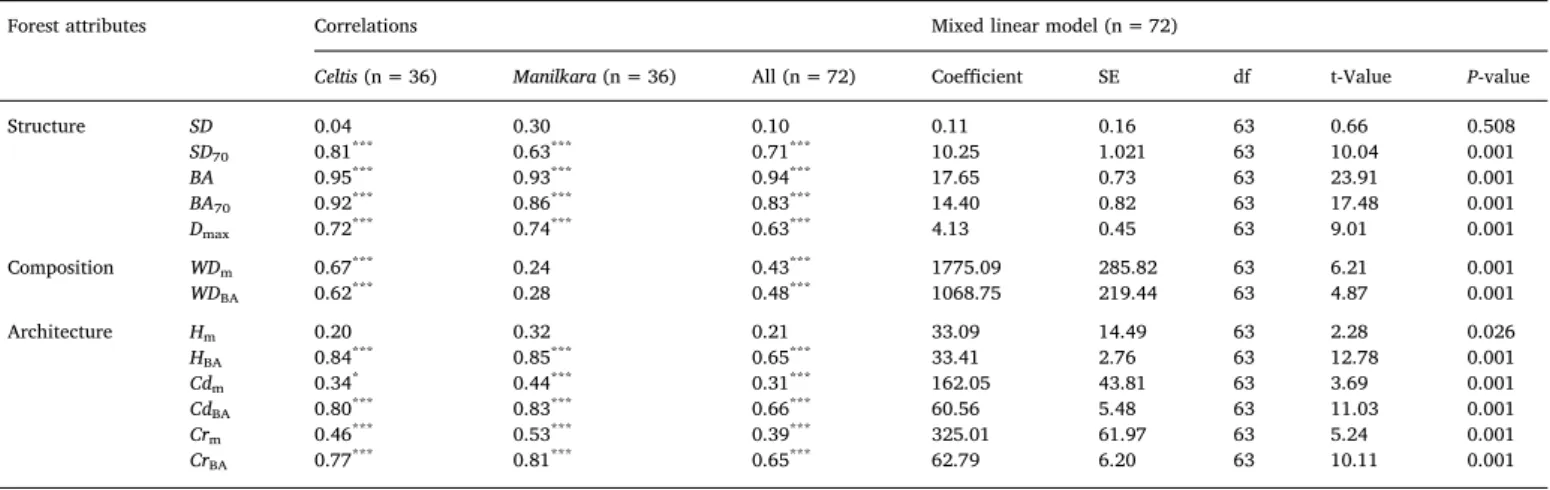
Plot-level AGB, including between- and within-site variation, was found to be correlated to most forest attributes (Table 3). With the exception of SD and Hm, we found strong correlations between
plot-level AGB and most structural and architectural attributes. These re-lationships were retrieved, separately for the Celtis and for the Man-ilkara forest, and using the combined dataset. In contrast, composition
Fig. 1. Site-specific allometric relationships between tree diameter and total height fitted with the Michaelis Menten model, and between tree diameter and height to thefirst branch, crown depth, and crown radius, fitted with a power model, for all trees and species (a–d) and for the trees of the 16 species shared by the two forest sites (e–h). The colour of symbols and curves corresponds to the forest site, i.e. the Celtis (black) and the Manilkara (blue) forests. The 95% confidence intervals of model predictions are shown in grey. (For interpretation of the references to color in thisfigure legend, the reader is referred to the web version of this article.)
Table 1
Between-site differences in allometric relationships between tree diameter (D) and: total tree height (H), height to the first branch (Hb), crown depth (Cd), and crown radius (Cr), for all inventoried trees and species, and for the 16 shared species. For each allometric relationship, we compared a general model withfixed parameters and three alternative models including a site effect on the parameters (site-specific asand bs, site-specific as, and site-specific bs) using the AIC values and likelihood
ratio tests (P-value). The best models are shown in bold.
H-D allometry Hb-D allometry Cd-D allometry Cr-D allometry
AIC P-value AIC P-value AIC P-value AIC P-value
For all trees and species
General model (without site effect) 12,791 – 2118 – 3188 – 2701 –
Site-specific asand bs 11,652 0.001 2111 0.001 3007 0.001 2229 0.001
Site-specific asand common b 11,325 0.001 2109 1.000 3035 0.001 2289 0.001
Site-specific bsand common a 12,463 0.001 2109 1.000 3014 1.000 2368 1.000
For trees of the 16 shared species
General model (without site effect) 4432 – 498 – 1201 – 642 –
Site-specific asand bs 4322 0.001 502 0.945 1093 0.001 575 0.001
Site-specific asand common b 4311 0.001 500 0.911 1096 0.017 584 0.001
Site-specific bsand common a 4403 0.001 500 0.875 1091 1.000 594 1.000
Table 2
Between-site differences in forest attributes: forest structure (stem density, SD, basal area, BA in m2, stem density of large trees, SD
70, basal area of large trees,
BA70in m2and maximum tree diameter, Dmaxin cm), composition (mean wood
density, WDmand BA-weighted wood density, WDBA, in g·cm−3), and
archi-tecture (mean total height, Hm, BA-weighted total height, HBA, mean crown
depth, Cdm, BA-weighted crown depth, CdBA, mean crown radius, Crm, and
BA-weighted crown radius, CrBA, in m) and in AGB (in Mg) at the 1-ha plot level.
Different letters indicate a significant difference (P < 0.05) according to the post-hoc tests.
Forest attributes Celtis Manilkara P-value
Structure SD 350 ± 35a 430 ± 22b 0.001 SD70 15 ± 4a 12 ± 2b 0.008 BA 29.49 ± 3.44a 29.48 ± 2.42a 0.162 BA70 11.28 ± 4.21a 8.74 ± 2.30b 0.002 Dmax 86.59 ± 11.06a 77.5 ± 7.53b 0.001 Composition WDm 0.65 ± 0.02a 0.68 ± 0.01b 0.001 WDBA 0.65 ± 0.03a 0.67 ± 0.02b 0.001 Architecture Hm 18.31 ± 0.53a 18.03 ± 0.32b 0.009 HBA 30.31 ± 1.58a 28.47 ± 0.91b 0.001 Cdm 6.29 ± 0.17a 6.17 ± 0.10b 0.001 CdBA 10.88 ± 0.90a 9.99 ± 0.49b 0.001 Crm 2.46 ± 0.11a 2.35 ± 0.06b 0.001 CrBA 5.90 ± 0.85a 5.14 ± 0.44b 0.001 AGB 370 ± 67a 375 ± 41a 0.707
attributes were only correlated with plot-level AGB in the Celtis forest, and using the combined dataset. Similar results were found with mixed linear models in which site and block were included as random factors to account for the nestedness of the data (Table 3).
Because we found significant differences between the two forest sites in linear models relating plot-level AGB to forest attributes (ANCOVAs; results not shown), we fitted site-specific regression lines between plot-level AGB and forest attributes (Fig. 3). Specifically, plot-level AGB was positively and linearly related with structural attributes (SD70, BA, BA70and Dmax) and architectural attributes (HBA, Cdm, CdBA,
Crmand CrBA), and all relationships appeared site-specific. Within both
the Celtis and the Manilkara forests, BA was the most important forest attributes for plot-level AGB variation, with almost 90% of explained variance, followed by BA70, HBA, CdBA and CrBA with almost 70% of
explained variance (Fig. 3). Including site as a covariate in the linear model between plot-level AGB and BA was found to be significant, but the site-specific relationships appeared relatively close, in contrast with
the other forest attributes. The picture was slightly different for com-position attributes (Fig. 3): plot-level AGB increased slightly with WDm
and WDBAin the Celtis forest but not in the Manilkara forest (Table 3).
4. Discussion
In this study, we found that forest structure (basal area), composi-tion (wood density) and architecture (tree height and crown dimen-sions) were all significant indicators of 1-ha plot-level AGB variation. The new plot network presented here confirmed the specific structure and composition of the Celtis and Manilkara forests, already identified byGourlet-Fleury et al. (2011). Here, we also showed contrasted ar-chitecture, with the site-specific allometries developed for the precise estimation of AGB at the tree and the plot levels. Interestingly, despite these differences, the two forests store the same amount of AGB, due to compensatory effects.
Fig. 2. Distribution of AGB (in Mg ha−1) among 10-cm wide diameter classes (a) and between small (tree diameter < 30 cm); medium (tree diameter between 30 and 70 cm) and large trees (tree diameter≥70 cm, b). The cumulative AGB among 10-cm wide diameter classes is also given (a, lines). The vertical da-shed line represents the mid-point in cumula-tive AGB distribution, with 50% of biomass above and below; this midpoint was found to be the same for the Celtis (black) and the Manilkara (blue) forests. ANOVAs (F-value and associated P-value) were used to determine significant between-site differences in AGB contained in the small, medium and large trees.
4.1. Crown allometry shapes height-diameter allometry
In agreement to previous studies in central Africa (Doetterl et al., 2015; Fayolle et al., 2016; Imani et al., 2017), we found that height-diameter allometry varied between the Celtis and the Manilkara forests, confirming the need of local height-diameter relationships for AGB
estimation (Chave et al., 2014; Sullivan et al., 2018). Likewise, the al-lometric relationship between crown depth and diameter varied be-tween the two forest sites. For a given diameter, trees were taller and had deeper crown in the Celtis forest than in the Manilkara forest. In-terestingly, we found that total height-diameter allometry is mostly governed by crown depth rather than height to thefirst branch between Table 3
Relationships between forest attributes and plot-level AGB (in Mg) using Pearson correlation coefficients and mixed linear models. Forest attributes include forest structure (stem density, SD, stem density of large trees, SD70, basal area, BA in m2, basal area of large trees, BA70in m2and maximum tree diameter, Dmaxin cm),
composition (mean wood density, WDmand BA-weighted wood density, WDBA, in g·cm−3), and architecture (mean total height, Hm, BA-weighted total height, HBA,
mean crown depth, Cdm, BA-weighted crown depth, CdBA, mean crown radius, Crm, and BA-weighted crown radius, CrBA, in m). For each relationship, we provided
the value and significance (*P < 0.05;**P < 0.01;***P < 0.001) of Pearson correlations coefficients and the results of mixed linear models including site and block
as random factors to account for the nestedness of the data (coefficient, standard error (SE), degrees of freedom (df), t-value and P-value).
Forest attributes Correlations Mixed linear model (n = 72)
Celtis (n = 36) Manilkara (n = 36) All (n = 72) Coefficient SE df t-Value P-value
Structure SD 0.04 0.30 0.10 0.11 0.16 63 0.66 0.508 SD70 0.81*** 0.63*** 0.71*** 10.25 1.021 63 10.04 0.001 BA 0.95*** 0.93*** 0.94*** 17.65 0.73 63 23.91 0.001 BA70 0.92*** 0.86*** 0.83*** 14.40 0.82 63 17.48 0.001 Dmax 0.72*** 0.74*** 0.63*** 4.13 0.45 63 9.01 0.001 Composition WDm 0.67*** 0.24 0.43*** 1775.09 285.82 63 6.21 0.001 WDBA 0.62*** 0.28 0.48*** 1068.75 219.44 63 4.87 0.001 Architecture Hm 0.20 0.32 0.21 33.09 14.49 63 2.28 0.026 HBA 0.84*** 0.85*** 0.65*** 33.41 2.76 63 12.78 0.001 Cdm 0.34* 0.44*** 0.31*** 162.05 43.81 63 3.69 0.001 CdBA 0.80*** 0.83*** 0.66*** 60.56 5.48 63 11.03 0.001 Crm 0.46*** 0.53*** 0.39*** 325.01 61.97 63 5.24 0.001 CrBA 0.77*** 0.81*** 0.65*** 62.79 6.20 63 10.11 0.001
Fig. 3. Relationships between forest attributes and plot-level AGB (in Mg) using linear models. Forest attributes include forest structure (stem density, SD, stem density of large trees, SD70, basal area, BA in m2, basal area of large trees, BA70in m2and maximum tree diameter, Dmaxin cm), composition (mean wood density,
WDmand BA-weighted wood density, WDBA, in g·cm−3), and architecture (mean total height, Hm, BA-weighted total height, HBA, mean crown depth, Cdm,
BA-weighted crown depth, CdBA, mean crown radius, Crm, and BA-weighted crown radius, CrBA, in m). Continuous regression lines when the relationship is significant
(P < 0.05) and broken regression lines when the relationship is not significant (P > 0.05) for each forest site. The 95% confidence intervals of model predictions in grey and the coefficient of determination (r2) are given for each regression line.
the two forest sites for a given diameter. This result implies that volume equations may be applicable in the two types of forest, despite large differences in total tree height.
Contrary to Antin et al. (2013) in the Western Ghats and to Blanchard et al. (2016)infive tropical biogeographic areas that found only little variation in crown allometries, here we showed strong be-tween-site variation in northern Congo, between the Celtis and the Manilkara forest, growing under the same climate but on different geological substrates (Fayolle et al., 2012, 2014). Trees tended to de-velop large crowns in the Manilkara forest dominated by slow-growing shade tolerant species, that need to develop wide crowns supported by robust branches to minimize self-shading and achieve reproduction at small sizes (King, 1996).
As already underlined above, trees were taller in the Celtis forest, while they tend to develop larger crowns in the Manilkara forest for a given diameter. We found similar trends for the sixteen (16) species shared by both forest sites, suggesting an environmental control of tree allometry. In Borneo,Aiba and Kitayama (1999)already showed that tree allometry is influenced by the geological substrate. In addition, other ecological factors could also be invoked to explain the between-site variation in tree allometry, such as competition during early suc-cession since stem density and species composition vastly differ be-tween the two forests (Gourlet-Fleury et al., 2011; Réjou-Méchain et al., 2014). The hypothesis of a genetic differentiation can probably be discarded since for shared species, the populations of the Celtis and of the Manilkara forests most likely belong to the same gene pool (Hardy et al., 2013).
4.2. AGB variation is related to forest structure, composition and architecture
Among the forest structural attributes, basal area (BA) was found to be the most important determinant of AGB variation, between and within the two forest sites. BA effectively captures the degree to which trees pack and utilize space aboveground (Jucker et al., 2015), which in turn is a key determinant of light interception and growth (Coomes et al., 2014). A strong correlation was found between AGB and BA for the two forest sites, confirming that denser forests have greater AGB, as already shown in central African forest (Lewis et al., 2013; Doetterl et al., 2015; Fayolle et al., 2016). More importantly, we found almost the same relationship between AGB and BA for the two forest sites that, however, vastly differ in forest structure, composition and architecture. This result suggests compensatory effects between forest horizontal and vertical structure, and species composition. Our relationship based on local-scale variation in AGB, is comparable to that ofLewis et al. (2013) obtained with 260 plots across tropical Africa.
High basal area and high AGB were more related to few trees with a large basal area, each containing a disproportionately large AGB, than to many small trees, confirming the importance of large trees for AGB stocks (Bastin et al., 2015; Lutz et al., 2018). Though less important than total BA, our results also showed the importance of large trees (tree diameter≥70 cm), in basal area (BA70), and to a lesser extent in
density (SD70), to explain the AGB variation between the two forest
sites, in agreement with the results ofLutz et al. (2018) and Slik et al. (2013)across the tropics.
Thefloristic composition, through mean wood density (WDm), was
an important explicative variable of AGB variation, specifically for depicting between-site AGB variation, in agreement with the results of Gourlet-Fleury et al. (2011)studying the same forest types but using commercial inventory data. The old-growth Manilkara forest that de-veloped on sandy soils and with a canopy enriched with slow-growing shade tolerant species showed higher wood density on average than the
old-secondary Celtis forest that developed on richer soils (Fayolle et al., 2014). Variation in wood density has also been found to determine spatial patterns in forest AGB across Amazonia, with regional scale pattern of species composition linked with a broad gradient of AGB (Baker et al., 2004). Interestingly, we found that wood density was positively correlated with AGB within the Celtis forest, in addition to the between-site variation. The larger species turnover within the Celtis forest, than in the relatively homogenous Manilkara forests (Douh et al., 2018), was indeed associated with a larger range of plot-level wood density.
Ploton et al. (2016) and Jucker et al. (2017)showed that tree AGB was strongly related to tree height and crown size across the tropics. Here for thefirst time, we demonstrated that architectural attributes (height, crown depth, and crown radius) derived at the plot level from site-specific allometries were good indicators of AGB variation. Plot-level AGB was correlated to BA-weighted total height named Lorey’s height, largely used in remote-sensing studies to derive AGB maps (Saatchi et al., 2011) and to BA-weighted crown radius, in agreement with the recent results ofMeyer et al. (2018)in the Neotropics. The strong relationships found between architectural attributes and AGB offer practical implications to predict plot-level AGB from remotely-sensed data (Asner et al., 2012). However, the site-specificity of the relationships is a challenge for the generalization of the approach. In the near future, we believe that these two forest sites established in contrasted ecological conditions will be useful for the calibration of remote-sensing products, since there are a strong local variation in both tree allometry and forest AGB. Linking the ground truth with high-re-solution remotely-sensed data, in order to derive architectural attri-butes seems to be the next step forward for the estimation of AGB at a large scale, without the time-intensive collection of forest inventory data.
5. Conclusions
Our study provides important advances for the understanding of local-scale AGB variation in tropical forests. We confirmed that the AGB variation in central African forests depends on forest structure (basal area) and architecture (height and crown dimensions), and to a lesser extent composition (wood density). These results offer the opportunity for practical implications for AGB and carbon stocks monitoring in central Africa, and specifically for the calibration of remote-sensing products.
Acknowledgements
This work was supported by the DynAfFor project supported by a French Fund for the Global Environment (grant numbers Nos. CZZ1636.01D and CZZ1636.02D); International Foundation for Science (grant number D/5822-1); F.R.S-FNRS (grant number 2017/v3/5/332– IB/JN – 9500), Nature+ (asbl, Belgium) and the Republic of Congo (OGES-Congo). Thefieldwork of this study was conducted in the per-manent design of DynAfFor and P3FAC projects, supported by the French Fund for the Global Environment, implemented by ATIBT/ COMIFAC/Nature+/CIRAD/Gembloux Agro-Bio Tech/CIB-Olam and Mokabi SA logging companies. We thank the team members of CIB-Olam and MOKABI SA logging companies. The authors are specifically thankful to Mercier Mayinga (CIB-Olam) and Arnaud N'Gokaka (Mokabi SA) for facilitatingfield measurements. We are grateful to Dr. Jean-François Gillet for help with plant identification. We are deeply grateful to Ecology group of the School of Geography during our re-search visit at the University of Exeter (UK).
Appendix A
(in cm) are indicated for each species.
Species Family Sampling effort: number of trees [diameter range in cm]
Celtis Manilkara
Angylocalyx pynaertii De Wild. Fabaceae 19 [11–73] 30 [10–59]
Anonidium mannii (Oliv.) Engl. & Diels Annonaceae 17 [11–76] 22 [12–78]
Blighia welwitschii (Hiern) Radlk. Sapindaceae 17 [13–141] 25 [10–88]
Celtis mildbraedii Engl. Cannabaceae 21 [12–98] 13 [12–85]
Entandrophragma cylindricum (Sprague) Sprague Meliaceae 12 [13–162] 22 [11–131]
Hexalobus crispiflorus A. Rich. Annonaceae 15 [10–96] 20 [12–79]
Manilkara mabokeënsis Aubrév. Sapotaceae 23 [10–106] 77 [11–137]
Nesogordonia kabingaensis (K. Schum.) Capuron ex R. Germ. Malvaceae 21 [10–73] 13 [15–66]
Panda oleosa Pierre Pandaceae 16 [12–56] 15 [14–74]
Pentaclethra macrophylla Benth. Mimosaceae 20 [10–84] 26 [11–95]
Petersianthus macrocarpus (P. Beauv.) Liben Lecythidaceae 32 [18–129] 35 [20–132]
Pterocarpus soyauxii Taub. Fabaceae 18 [11–142] 24 [11–115]
Pycnanthus angolensis (Welw.) Warb. Myristicaceae 15 [15–91] 32 [19–104]
Staudtia kamerunensis var. gabonensis (Warb.) Fouilloy Myristicaceae 32 [11–95] 58 [12–75]
Strombosia pustulata Oliv. Olacaceae 12 [15–101] 21 [14–69]
Tessmannia africana Harms Caesalpiniaceae 13 [13–71] 13 [12–72]
Appendix B. Supplementary material
Supplementary data associated with this article can be found, in the online version, athttps://doi.org/10.1016/j.foreco.2018.07.056.
References
Aiba, S.I., Kitayama, K., 1999. Structure, composition and species diversity in an altitude-substrate matrix of rain forest tree communities on Mount Kinabalu. Borneo. Plant Ecol. 140, 139–157.
Akaike, H., 1974. A new look at the statistical model identification. IEEE Trans. Automat. Control 19 (6), 716–723.
Antin, C., Pélissier, R., Vincent, G., Couteron, P., 2013. Crown allometries are less re-sponsive than stem allometry to tree size and habitat variations in an Indian monsoon forest. Trees– Struct. Funct. 27, 1485–1495. https://doi.org/10.1007/s00468-013-0896-7.
Asner, G.P., Mascaro, J., Muller-Landau, H.C., Vieilledent, G., Vaudry, R., Rasamoelina, M., Hall, J.S., van Breugel, M., 2012. A universal airborne LiDAR approach for tro-pical forest carbon mapping. Oecologia 168, 1147–1160.https://doi.org/10.1007/ s00442-011-2165-z.
Avitabile, V., Herold, M., Heuvelink, G.B.M., Lewis, S.L., Phillips, O.L., et al., 2016. An integrated pan-tropical biomass map using multiple reference datasets. Glob. Chang. Biol. 22, 1406–1420.https://doi.org/10.1111/gcb.13139.
Baker, T.R., Phillips, O.L., Malhi, Y., Almeida, S., Arroyo, L., Di Fiore, A., et al., 2004. Variation in wood density determines spatial patterns in Amazonian forest biomass. Glob. Chang. Biol. 10 (5), 545–562.https://doi.org/10.1111/j.1365-2486.2004. 00751.x.
Bastin, J.-F., Barbier, N., Réjou-Méchain, M., Fayolle, A., Gourlet-Fleury, S., Maniatis, D., et al., 2015. Seeing Central African forests through their largest trees. Sci. Rep. 5, 13156.https://doi.org/10.1038/srep13156.
Blanchard, E., Birnbaum, P., Ibanez, T., Boutreux, T., Antin, C., Ploton, P., Vincent, G., et al., 2016. Contrasted allometries between stem diameter, crown area, and tree height infive tropical biogeographic areas. Trees – Struct. Funct. 30, 1953–1968. https://doi.org/10.1007/s00468-016-1424-3.
Chave, J., Coomes, D., Jansen, S., Lewis, S.L., Swenson, N.G., Zanne, A.E., 2009. Towards a worldwide wood economics spectrum. Ecol. Lett. 12, 351–366.https://doi.org/10. 1111/j.1461-0248.2009.01285.x.
Chave, J., Réjou-Méchain, M., Búrquez, A., Chidumayo, E., Colgan, M.S., et al., 2014. Improved allometric models to estimate the aboveground biomass of tropical trees. Glob. Change Biol. 20, 3177–3190.https://doi.org/10.1111/gcb.12629. Coomes, D.A., Flores, O., Holdaway, R., Jucker, T., Lines, E.R., Vanderwel, M.C., 2014.
Wood production response to climate change will depend critically on forest com-position and structure. Glob. Change Biol. 20, 3632–3645.https://doi.org/10.1111/ gcb.12622.
Doetterl, S., Kearsley, E., Bauters, M., Hufkens, K., Lisingo, J., Baert, G., Verbeeck, H., Boeckx, P., 2015. Aboveground vs. belowground carbon stocks in African tropical lowland rainforest: Drivers and implications. PLoS One 10, 1–14.https://doi.org/10. 1371/journal.pone.0143209.
Douh, C., Daïnou, K., Loumeto, J.J., Moutsambote, J.M., Fayolle, A., Tosso, F., Doucet, J.L., 2018. Soil seed bank characteristics in two central African forest types and implications for forest restoration. For. Ecol. Manage. 409, 766–776.https://doi.org/ 10.1016/j.foreco.2017.12.012.
Eggleston, H.S., Buendia, L., Miwa, K., Ngara, T., Tanabe, K., 2006. Guidelines for na-tional greenhouse gas inventories Technical Report 4 Intergovernmental Panel on Climate Change (IPCC) IGES, Japan Prepared by the National Greenhouse Gas Inventories Programme.
Fayolle, A., Engelbrecht, B., Freycon, V., Mortier, F., Swaine, M., et al., 2012. Geological substrates shape tree species and trait distributions in African moist forests. PLoS One 7, 12–14.https://doi.org/10.1371/journal.pone.0042381.
Fayolle, A., Picard, N., Doucet, J.L., Swaine, M., Bayol, N., Bénédet, F., Gourlet-Fleury, S., 2014. A new insight in the structure, composition and functioning of central African moist forests. For. Ecol. Manage. 329, 195–205.https://doi.org/10.1016/j.foreco. 2014.06.014.
Fayolle, A., Loubota Panzou, G.J., Drouet, T., Swaine, M.D., Bauwens, S., et al., 2016. Taller trees, denser stands and greater biomass in semi-deciduous than in evergreen lowland central African forests. For. Ecol. Manage. 374, 42–50.https://doi.org/10. 1016/j.foreco.2016.04.033.
Feldpausch, T.R., Lloyd, J., Lewis, S.L., Brienen, R.J.W., Gloor, M., et al., 2012. Tree height integrated into pantropical forest biomass estimates. Biogeosciences 9, 3381–3403.https://doi.org/10.5194/bg-9-3381-2012.
Goodman, R.C., Phillips, O.L., Baker, T.R., 2014. The importance of crown dimensions to improve tropical tree biomass estimates. Ecol. Appl. 24, 680–698.https://doi.org/10. 1890/13-0070.1.
Gourlet-Fleury, S., Rossi, V., Rejou-Mechain, M., Freycon, V., Fayolle, A., et al., 2011. Environmentalfiltering of dense-wooded species controls above-ground biomass stored in African moist forests. J. Ecol. 99, 981–990. https://doi.org/10.1111/j.1365-2745.2011.01829.x.
Hardy, O.J., Born, C., Budde, K., Daïnou, K., Dauby, G., et al., 2013. Comparative phy-logeography of African rain forest trees: a review of genetic signatures of vegetation history in the Guineo-Congolian region. Comptes Rendus - Geosci. 345, 284–296. https://doi.org/10.1016/j.crte.2013.05.001.
Imani, G., Boyemba, F., Lewis, S., Nabahungu, N.L., Calders, K., et al., 2017. Height-diameter allometry and above ground biomass in tropical montane forests: Insights from the Albertine Rift in Africa. PLoS One 12, 1–20.https://doi.org/10.1371/ journal.pone.0179653.
Jucker, T., Bouriaud, O., Coomes, D.A., 2015. Crown plasticity enables trees to optimize canopy packing in mixed-species forests. Funct. Ecol. 29, 1078–1086.https://doi. org/10.1111/1365-2435.12428.
Jucker, T., Caspersen, J., Chave, J., Antin, C., Barbier, N., et al., 2017. Allometric equations for integrating remote sensing imagery into forest monitoring programmes. Glob. Chang. Biol. 23, 177–190.https://doi.org/10.1111/gcb.13388.
Kearsley, E., de Haulleville, T., Hufkens, K., Kidimbu, A., Toirambe, B., et al., 2013. Conventional tree height-diameter relationships significantly overestimate above-ground carbon stocks in the Central Congo Basin. Nat. Commun. 4, 2269.https://doi. org/10.1038/ncomms3269.
King, D.A., 1996. Allometry and life history of tropical trees. J. Trop. Ecol. 12, 25–44. https://doi.org/10.1017/S0266467400009299.
Lewis, S.L., Lopez-Gonzalez, G., Sonké, B., Affum-Baffoe, K., Baker, T.R., et al., 2009. Increasing carbon storage in intact African tropical forests. Nature 457, 1003–1006. https://doi.org/10.1038/nature07771.
Lewis, S., Sonké, B., Sunderland, T., Begne, S.K., Lopez-Gonzalez, G., et al., 2013. Above-ground biomass and structure of 260 African tropical forests. Philos. Trans. R. Soc. Lond. B. Biol. Sci. 368, 20120295.
Loubota Panzou, G.J., Doucet, J.L., Loumeto, J.J., Biwole, A., Bauwens, S., Fayolle, A., 2016. Biomasse et stocks de carbone des forêts tropicales africaines (synthèse bib-liographique). Biotechnol. Agron. Soc. Environ. 20, 508–522.
Lutz, J.A., Furniss, T.J., Johnson, D.J., Davies, S.J., Allen, D., Alonso, A., et al., 2018. Global importance of large-diameter trees. Glob. Ecol. Biogeogr.https://doi.org/10. 1111/geb.12747.(in press).
Meyer, V., Saatchi, S., Clark, D.B., Keller, M., Vincent, G., et al., 2018. Canopy area of large trees explains aboveground biomass variations across neotropical forest land-scapes. Biogeosciences 15, 3377–3390.https://doi.org/10.5194/bg-15-3377-2018. Mitchard, E.T.A., Feldpausch, T.R., Brienen, R.J.W., Lopez-Gonzalez, G., Monteagudo, A.,
et al., 2014. Markedly divergent estimates of Amazon forest carbon density from ground plots and satellites. Glob. Ecol. Biogeogr. 23, 935–946.https://doi.org/10. 1111/geb.12168.
Pan, Y., Birdsey, R., Fang, J., Houghton, R.A., Kauppi, P., et al., 2011. A Large and Persistent Carbon Sink in the World’s Forests. Science 333, 988–994. Pinheiro, J., Bates, D., DebRoy, S., Sarkar, D., R Core Team, 2017. nlme: Linear and
Nonlinear Mixed Effects Models. R package version 3.1-131, <https://CRAN.R-project.org/package=nlme> .
Ploton, P., Barbier, N., Momo, S.T., Rejou-Mechain, M., Boyemba Bosela, F., et al., 2016. Closing a gap in tropical forest biomass estimation: taking crown mass variation into account in pantropical allometries. Biogeosciences 13, 1571–1585.https://doi.org/
10.5194/bg-13-1571-2016.
R Core Team, 2017. version 3.4.1. R: A Language and Environment for Statistical Computing. R Foundation for Statistical Computing, Vienna, Austria.
Réjou-Méchain, M., Flores, O., Pélissier, R., Fayolle, A., Fauvet, N., Gourlet-Fleury, S., 2014. Tropical tree assembly depends on the interactions between successional and soilfiltering processes. Glob. Ecol. Biogeogr. 23, 1440–1449.https://doi.org/10. 1111/geb.12222.
Réjou-Méchain, M., Tanguy, A., Piponiot, C., Chave, J., Hérault, B., 2017. Biomass: an R package for estimating above-ground biomass and its uncertainty in tropical forests. Methods Ecol. Evol. 8, 1163–1167.https://doi.org/10.1111/2041-210X.12753. Saatchi, S.S., Harris, N.L., Brown, S., Lefsky, M., Mitchard, E.T., Salas, W., et al., 2011.
Benchmark map of forest carbon stocks in tropical regions across three continents. PNAS 108 (24), 9899–9904.https://doi.org/10.1073/pnas.1019576108. Slik, J.W.F., Paoli, G., McGuire, K., Amaral, I., Barroso, J., et al., 2013. Large trees drive
forest aboveground biomass variation in moist lowland forests across the tropics. Glob. Ecol. Biogeogr. 22, 1261–1271.https://doi.org/10.1111/geb.12092. Sullivan, M.J.P., Lewis, S.L., Hubau, W., Qie, L., Baker, T.R., et al., 2018. Field methods
for sampling tree height for tropical forest biomass estimation. Methods Ecol. Evol. 9, 1179–1189.https://doi.org/10.1111/2041-210X.12962.
Verbeeck, H., Boeckx, P., Steppe, K., 2011. Tropical forests: include Congo basin. Nature 479 (7372), 179.https://doi.org/10.1038/479179b.
Zanne, A., Lopez-Gonzalez, G., Coomes, D.A., Ilic, J., Jansen, S., et al., 2009. Towards a worldwide wood economics. Spectrum.https://doi.org/10.5061/dryad.234.