HAL Id: hal-01314822
https://hal.archives-ouvertes.fr/hal-01314822
Submitted on 12 May 2016
HAL is a multi-disciplinary open access
archive for the deposit and dissemination of sci-entific research documents, whether they are pub-lished or not. The documents may come from teaching and research institutions in France or abroad, or from public or private research centers.
L’archive ouverte pluridisciplinaire HAL, est destinée au dépôt et à la diffusion de documents scientifiques de niveau recherche, publiés ou non, émanant des établissements d’enseignement et de recherche français ou étrangers, des laboratoires publics ou privés.
Mobility model for user’s realistic behavior in mobile ad
hoc network
Shiddhartha Raj Bhandari, Gyu Myoung Lee, Noel Crespi
To cite this version:
Shiddhartha Raj Bhandari, Gyu Myoung Lee, Noel Crespi. Mobility model for user’s realistic behavior in mobile ad hoc network. CNSR 2010 : 8th Annual Conference on Communication Networks and Ser-vices Research, May 2010, Montreal, Canada. pp.102 - 107, �10.1109/CNSR.2010.27�. �hal-01314822�
Mobility Model for User’s Realistic Behavior in Mobile Ad Hoc Network
Shiddhartha Raj Bhandari, Gyu Myoung Lee, and Noel Crespi
Department of Wireless Networks and Multimedia Services Institut Telecom, Telecom SudParis
9 rue Charles Fourier 91011 Evry Cedex – France {Shiddhartha_raj.Bhandari, gm.lee, noel.crespi}@it-sudparis.eu
Abstract
Mobile ad hoc network (MANET) can be the best option in developing seamless communication environment in various application scenarios where there is no any pre-defined infrastructure. A mobility model which represents movement behavior of considered application scenarios should incorporate important features that may change characteristics of mobile nodes. In most of the cases, mobile nodes used to move along predefined paths toward their destination. We propose a new mobility model which represents movement of mobile nodes in case of pre-defined structured area including attraction points to incorporate realistic behavior. We simulate performance of Ad hoc on-demand distance vector (AODV) routing protocol varying speed, load and node density. In terms of performances, average end-to-end delay is less in case of proposed mobility model. However, packet delivery ratio is found lower compare to random way point. The goal of our proposal is to model user’s realistic behavior in conventional routing protocols.
Keywords; MANET, Mobility Model, Random Way Point, AODV
1. Introduction
Mobile ad hoc network (MANET) is a kind of network consisting of mobile or fixed wireless devices communication among without any centralized infrastructure. It can be the best option creating seamless communication environment. Mobile nodes act co-operatively to relay packet within the network. Because of highly dynamic nature of MANET, there are some challenges to be considered before deploying it in real time application scenarios such as conferences, exhibitions, ad hoc meeting etc. Nodes are allowed to move freely with in the application area; so, network topology changes in no time. Routing protocols should be well aware of such frequent changes and disseminate proper information timely to continue communication smoothly.
A mobility model which represents movement behavior of considered application scenarios should incorporate important features that may change characteristics of mobile nodes. It describes how speed, acceleration and direction of the node changes over time. As the mobility
models emulate the real mobile scenario of the network, selection of the proper models plays an important role.
Considering the importance of mobility, new appropriate mobility model is proposed for the case of pre-defined structured area including attraction points. Evaluation of proposed model is conducted implementing it in reactive ad hoc on-demand distance vector (AODV) routing protocol varying speed, load and node density. We compare proposed model with widely used general mobility model called random way point mobility model. Our concern is to compare mobility models rather than evaluating particular performance of routing protocol. In terms of performances average end-to-end delay is less in case of proposed mobility model. However, packet delivery ratio is found lower compare to random way point (RWP). The goal of our proposal is to model user’s realistic behavior in conventional routing protocols. This mobility model better represents true MANET implementation. Our mobility model can be used to simulate realistic scenario as it considered some important factors: attraction points and pre-defined structured area of application.
The organization of paper is as follows. Section 2 describes some related work about mobility modeling. In Section 3, we propose a new mobility model to represent user’s realistic behavior. Section 4 shows detail simulation results. Finally, Section 5 concludes the paper.
2. Related Work
For MANET, we can categorize several mobility models based on the degree of randomness, etc [1]. In this section, we describe key characteristics of mobility models in literatures.
2.1. Trace based mobility model
This model [2] is suitable to emulate the real scenarios in MANET. Traces are the best information to find the mobility patterns of node, if we have traces of long period and involvement of many participants. Traces reflect the movement histories of the nodes in the network. We can expect mobility patterns provided by them lead to realistic mobility modeling. Because of not widely deployed MANET applications, there are fewer traces for evaluation. Another issue related to traces is, the nature of network is
decentralized and difficult to collect the real time traces of all mobile nodes.
2.2. Synthetic mobility model
Synthetic models represent the movements of the mobile nodes without using mobility traces. Synthetic models mimic the real situations with some known patterns of movement. It is not realistic compared to the trace based mobility model; still there are many synthetic mobility models that are used to mimic random mobility behavior of the ad hoc network nodes.
2.3. Entity mobility model
Entity mobility model represents mobile node as a random entity which moves randomly over the observed area independent of speed and direction.
2.3.1. Randon way point mobility model
RWP mobility model is the most common mobility model used in research community [3]. Because of its simplicity and random emulating behavior, it is popular in the MANET research. In this model initially, all the mobile nodes are distributed over the simulation area randomly. Node selects its destination randomly among the others in simulation area. After choosing the random destination it chooses the velocity from a uniform distribution. After reaching the destination node, it stops for small time which is called the “pause time”. After the pause time duration it again chooses the destination randomly and moves toward that destination.
2.3.2. Random walk mobility model
This model has provided solution to the problem of random walk mobility model. When mobile node reaches boundary of the simulation area, in first approach called random walk with wrapping, it wraps to the opposite edge and continues its movement. Another approach called random walk with reflection, node’s angle of movement changed by 180 degree while speed remains constant.
2.3.3. Restricted random way point model
In restricted random way point model [4], nodes do not move randomly from one place to another which is at long distance. To emulate large area, this model has divided the large area as combination of small subsections called specific area. Mobile nodes are also considered as the combination of ordinary nodes and commuter nodes. We can consider this model as the networking of several cities with highways. Each specific area has its ordinary nodes. Ordinary nodes move with random way point model within their boundary.
2.3.4. Manhattan mobility model
Manhattan mobility model emulate the mobility in city area with the connected grids. In this model, mobile nodes are allowed to move in to the horizontal and vertical path
that crosses each other forming the scenario of the urban area. Nodes are allowed to take turn while moving in predefined path.
3. Proposed Mobility Model
3.1. Attraction point and user’s realistic behavior In real scenarios, people do not roam randomly from one point to another [5] [6]. They used to set some fixed destination to reach. We consider this fact in our proposed mobility model. Subscribers used to move in deterministic way. Whenever people visit some city section, conference, exhibition area, they used to be attracted by some specific points. Incorporating those factors we propose to implement attraction points. Users move in group towards the attraction points. More number of nodes will be around the most attractive point compare to less attractive. When mobile node selects the attraction point to visit, there will be other nodes too who are also visiting the same attraction point and forming the group. Therefore, we propose a new mobility model considering attraction points in order to represent user’s realistic behavior. 3.2. Our mobility model considering attraction points
3.2.1. Implementation area
We consider an application area of exhibition. There are different types of exhibitions, food fair, book exhibitions, electronics and communication exhibitions and many more. Mobility in such scenario is the mobility of the exhibitors and visitors. In exhibition area, there used to be some exhibition stations, where most of the visitors used to be accumulated.
In case of such scenarios, there used to be defined paths where nodes are allowed to move. Movement is not random compare to other cases. There used to be sideways with location information. Visitors move on such defined path looking signs and information. There are many exhibitors which are sitting to exhibit their respective products. All the exhibition stalls are the attraction points of our mobility model. All attraction point can not have similar attraction point value. Each of them has their attraction point value. Node visits such stalls which has high attraction point value. It is customary that most people visit some interesting exhibition stalls. Such highly visited stall is considered as the attraction point with high attraction point value. Tendency of exhibitors is to visit the important point first.
3.2.2. Movement of the nodes
At the beginning, mobile nodes are randomly distributed along the horizontal and vertical lanes. Nodes are only
allowed to move along the predefined paths. After initial distribution, each node searches for the possible attraction points to visit. Each attraction point has its own attractivity. Attractivity value is a uniform random number between 0 and 1. Each node first calculates its distances to all the attraction points present. Based on distance and attractivity value each mobile node calculates selection factor S for all the available attraction points. When it calculates S for all the attraction points, it sorts out value using sorting algorithm. Attraction point with which it gets maximum value of selection factor is the next destination to follow.
Mobile node moves along the horizontal and vertical paths to reach their concerned attraction point. To select which attraction point to visit, node calculates
• Distance factor (d) • Attractivity factor (a)
Nodes calculate selection factor S for each attraction point using d and a. Factor S is inversely proportional to euclidean distance from node to attraction point.
1
d
euclidean distance from node to attraction point
α
a is uniform random number between 0 and 1.
Node calculates selection factor S for all the attraction points: Si=dixai
Node selects the attraction point which gives maximum value of S. It selects near node with lower attractivity rather than farther with higher attractivity.
If a node finds two or more attraction points having same selection factor S, random number will be generated and based on that node selects one of them as their next destination.
3.2.3. Operation of proposed mobility model
In this section, we describe algorithm of movement of mobile nodes of proposed mobility model. Initially, they are distributed in the simulation area randomly. They select their respective attraction points and start following it. Pseudo codes below shows how nodes use distance and attractivity factor to calculate selection factor to choose the right attraction point.
Fig. 1. Pseudo code of our proposed mobility model
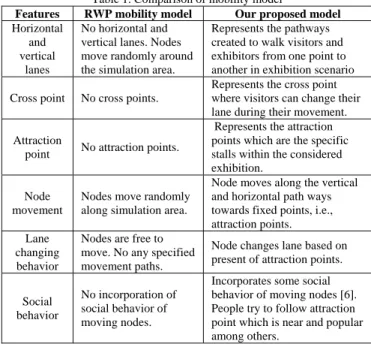
3.3. Comparison of mobility models
In proposed mobility model, we consider some inherent characteristics of user’s movement and environment. It considers some features which has not considered before in MANET mobility modeling. Table 1 compares the characteristics of proposed mobility model with highly used RWP.
Table 1. Comparison of mobility model
Features RWP mobility model Our proposed model
Horizontal and vertical
lanes
No horizontal and vertical lanes. Nodes move randomly around the simulation area.
Represents the pathways created to walk visitors and exhibitors from one point to another in exhibition scenario
Cross point No cross points.
Represents the cross point where visitors can change their lane during their movement.
Attraction
point No attraction points.
Represents the attraction points which are the specific stalls within the considered exhibition.
Node movement
Nodes move randomly along simulation area.
Node moves along the vertical and horizontal path ways towards fixed points, i.e., attraction points. Lane
changing behavior
Nodes are free to move. No any specified movement paths.
Node changes lane based on present of attraction points.
Social behavior
No incorporation of social behavior of moving nodes.
Incorporates some social behavior of moving nodes [6]. People try to follow attraction point which is near and popular among others.
4. Performance Comparison
4.1. Performance evaluation metrics
There are mobility metrics which can be used to observe the mobility policies. Relative velocity, maximum velocity, acceleration, pause time are some examples. Those metrics can be observed for different mobility model and can conclude some facts regarding the mobility characteristic of those models. Varying those characteristics, we can draw how much those metrics are important for a protocol operation. We use following parameters as performance evaluation metrics of our proposed mobility model.
4.1.1. Packet delivery ratio
Packet delivery ratio counts the number of packets originated by the source and number of packets received by the receiver. During communication, nodes move from its position continuously with different velocity. We can compare the ratio of packets send by sender and received by receiver to evaluate the effect of our changes parameter of mobility over the performance of network [7].
. .
No of packet received destination PDratio
No of packets generated source
=
do {
Step 1: Search available attraction points for (i =0; i < number of attraction points; i++) {
Step 2: calculate distance factor di
Step 3: calculate attractivity ai
Step 4: calculate Si =dixai
}
Step 5: choose attraction point with highest selection factor Si
Step 6: follow selected attraction point }
4.1.2. Average end to end delay
Packet delay is time that packet takes from source node to destination. In MANET, packet relays from several intermediate nodes. So, delay of a path is summation of all the links along that path. Link fluctuates during the mobility of nodes. Some links along path may have high delay comparing to others. Average value gives the value that can be compared with other results. Average packet delay increases with mobility in MANET.
4.2. Simulation Results
We performed simulation using ns-2 a discrete event simulator targeted at networking research. In ns-2 mobile nodes are allowed to move in a three dimensional topology. Third dimension (z-direction) has not been used. So, nodes are assumed to move in two dimensional planes all the time. Nodes can be initialized in some position and make them travel to specified destination point. We can explicitly define movement of nodes or we can generate movement trace file and implement on the simulation.
Table 2. Common simulation parameters Channel type Wireless channel Propagation model Two Ray Ground Interface type Wireless physical MAC layer protocol IEEE 802.11 Interface queue type Priority queuing Interface queue length 50
Antenna type Omni direction Transmission range 250m Simulation area 1000mX1000m
Mobility model Our proposed model and RWP model (pause time 1 second)
Initial position of nodes Uniformly distributed along the moving pathways
Observation parameters Data delivery ratio, average end-to-end delay
Routing protocols AODV
4.2.1. Simulation varying nework load
Different routing protocol reacts separately when we vary load within the network. From this simulation, we observe performance of AODV routing protocol varying network load. Proposed mobility model is compared with RWP at different level of network loading. Number of random connections of source and destination changed. Network load increases and decreases changing number of connection among the simulated nodes. Results obtained from this simulation show the impact of network load in performance of MANET.
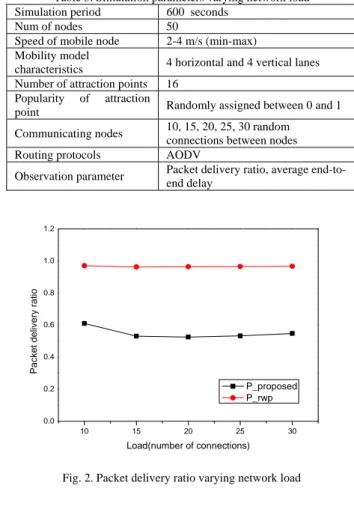
Fig. 2 shows our observation of packet delivery ratio while we increase load within the network. When we compare packet delivery ratio of two mobility models, we found packet delivery ratio in case of proposed mobility model is low. In case of proposed mobility model, packet delivery ratio decreases while increasing network load. When load is increased within the network, there will be
congestion of network traffic which causes more packet loss.
Table 3. Simulation parameters varying network load Simulation period 600 seconds
Num of nodes 50
Speed of mobile node 2-4 m/s (min-max) Mobility model
characteristics 4 horizontal and 4 vertical lanes Number of attraction points 16
Popularity of attraction
point Randomly assigned between 0 and 1 Communicating nodes 10, 15, 20, 25, 30 random
connections between nodes Routing protocols AODV
Observation parameter Packet delivery ratio, average end-to-end delay 10 15 20 25 30 0.0 0.2 0.4 0.6 0.8 1.0 1.2 P a ck et del ivery rat io Load(number of connections) P_proposed P_rwp
Fig. 2. Packet delivery ratio varying network load
10 15 20 25 30 0.00 0.01 0.02 0.03 0.04 0.05 0.06 0.07 Dela y
Load (number of connections) d_proposed d_rwp
Fig. 3. Average end to end delay varying network load
From Fig. 3, in both mobility models, average end-to-end delay increases while we increase network load. When load increases there will be congestions within the network. Because of congestions, it takes longer time to reach data packet to destination compare to normal load within the network.
4.2.2. Simulation varying speed of the node
In this simulation, we vary speed of mobile node keeping all the other parameters same. Speed of the mobile node represents realistic scenarios. Result obtained from this simulation gives us the impact of speed in performance parameters.
Table 4. Simulation parameters varying node speed Simulation period 600 seconds Num of nodes 50
Node speed 1, 2, 3, 4, 5 m/s
Mobility model characteristics 4 horizontal and 4 vertical lanes
Number of attraction points 16
Popularity of attraction point Randomly assigned between 0 and 1
Communicating nodes 20 random connections between nodes Routing protocols AODV
Observation parameter Packet delivery ratio, average end-to-end delay 1 2 3 4 5 0.0 0.2 0.4 0.6 0.8 1.0 1.2 P a cket del iver y rat io Speed P_proposed P_rwp
Fig. 4. Packet delivery ratio varying speed of mobile node
From Fig. 4, we observe packet delivery ratio decreases when we increase speed of mobile nodes. In our proposed model, nodes used to select different attraction points based on attractivity and distance factor. Nodes will move away from each other during their movement towards attraction points and forms small groups around them. It causes more packet loss compared to RWP mobility model. In case of RWP mobility model, nodes move through the center part of simulation area. So, packet delivery ratio is high compare to other mobility models.
In Fig. 5, average end to end delay increases with speed. In case of AODV, when source wants to send data to destination, it needs to find the possible paths. Sources sends RREQ message all of its neighbors and wait for the RREP message that ultimately form route between them. Because of mobility network topology changes and node could not get right destination to send. When node does not get route to destination, it stores packets in buffer. Mobility changes network topology that changes node’s
neighborhood which finally causes delay reaching packets from source to destination.
1 2 3 4 5 0.00 0.01 0.02 0.03 0.04 0.05 0.06 0.07 0.08 De lay Speed d_proposed d_rwp
Fig. 5. Aerage end to end delay varying speed of mobile node
Delay increases with increase in speed of mobile nodes. When node moves faster, it leaves neighbors quickly. If neighbor leaves its communication range there will be less chance to get the destination. Previously known path would have been gone i.e. false routing information will be in the routing table that causes buffering the packets and wait for another route to find toward destination that causes increase in delay.
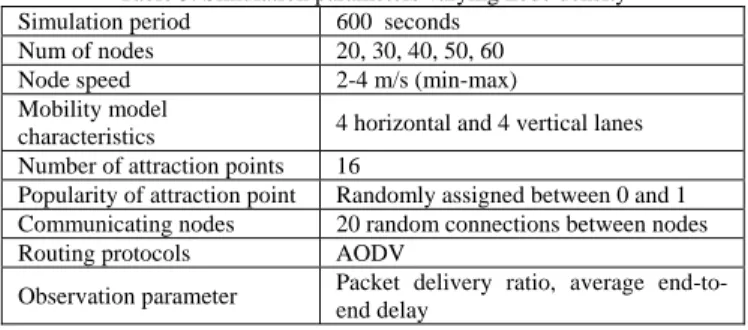
4.2.3. Simulation varying node density
Varying node density causes variation in number of nodes within the simulation area. Performance of network is different if there are large number nodes compare to less. Network will be sparse if there are less number of nodes on the other hand network will be crowded if there are large number of nodes. This simulation gives us variation in performance parameters at various levels of node densities. Node density is increased at various levels so that impact of it can be well understood.
Table 5. Simulation parameters varying node density Simulation period 600 seconds
Num of nodes 20, 30, 40, 50, 60 Node speed 2-4 m/s (min-max) Mobility model
characteristics 4 horizontal and 4 vertical lanes Number of attraction points 16
Popularity of attraction point Randomly assigned between 0 and 1 Communicating nodes 20 random connections between nodes Routing protocols AODV
Observation parameter Packet delivery ratio, average end-to-end delay
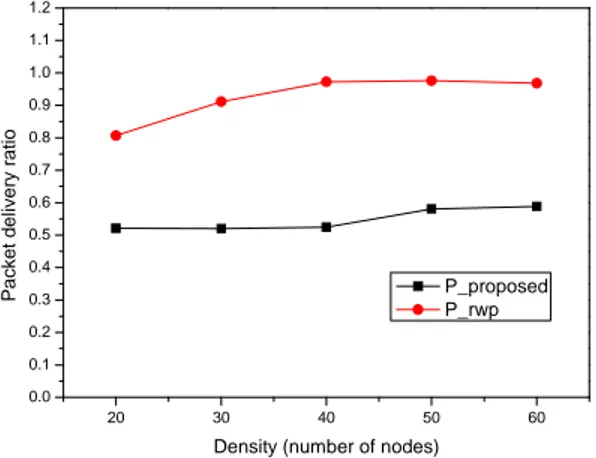
Fig. 6 shows the result of packet delivery ratio varying density of nodes within the network. From observation, we see packet delivery ratio increases with number of nodes within the network. When numbers of nodes within the simulation area is less, network will be sparse and
numbers of possible connections between nodes are less, hence packet delivery ratio is low. When node density increases, there will be enough intermediate nodes which relay packets up to destination.
20 30 40 50 60 0.0 0.1 0.2 0.3 0.4 0.5 0.6 0.7 0.8 0.9 1.0 1.1 1.2 Pa cket de liv er y ra ti o
Density (number of nodes)
P_proposed P_rwp
Fig. 6. Packet delivery ratio varying node density
20 30 40 50 60 0.00 0.05 0.10 0.15 0.20 0.25 Del a y
Density (number of nodes) d_proposed d_rwp
Fig. 7. Average end-to-end delay varing node density
From Fig. 7, we found, increasing density of node decreases average end to end delay. If there are enough number of nodes within the network, route setup will be quick. Quick route set up decreases end-to-end delay within the network. In case of RWP mobility model, we observe average end-to-end delay decreases with increase in number of nodes. In case of sparse network, end to end delay is high. When there is less number of nodes, there are less number of possible links between source and destination. Data packets may need to store in intermediate node buffer if right link from source to destination is not available. When node density increases, there will be sufficient links between communicating nodes. Packets do not need to be stored in intermediate buffers that mean delay is less.
In case of our proposed mobility model, nodes used to be accumulated around the attraction points. Buffering
data packets in intermediate node is not necessary, so end-to-end delay is less.
5. Conclusion
In this research, we have conducted detailed study of several entity and group mobility models that have been proposed in MANET research. We have proposed the new mobility model that covers some specific implementation area. Through simulations, we have found significant effect of attraction points in MANET performance. Because of attraction points, mobile nodes used to be accumulated in certain parts of simulation area forming small groups. Such accumulation around attraction point causes low packet delivery ratio compare to RWP mobility model. This result came because, nodes accumulate around attraction points, if source and destination node belongs in same cluster; delivering packets from source to destination does not take long time. If source and destination belongs to different cluster, packet gets lost or remains in buffer of some neighboring nodes.
Further study should be devoted in realistic mobility modeling taking into account all the specificities of deploying scenarios. Random mobility models which are highly used in researches should be modified to represent real scenarios.
References
[1] Zheng, Q., Hong, X., and Ray, S., “Recent advances in mobility modeling for mobile ad hoc network research,” In Proceedings of
the 42nd Annual Southeast Regional Conference. ACM-SE 42.
ACM, New York, NY, 70-75. DOI= http://doi.acm.org /10.1145/986537.986554 J. Clerk Maxwell, A Treatise on Electricity and Magnetism, 3rd ed., vol. 2. Oxford: Clarendon, pp.68–73, April 2004.
[2] Vetriselvi, V. and Parthasarathi, R., “Trace based mobility model for ad hoc networks,” In Proceedings of the Third IEEE
International Conference on Wireless and Mobile Computing,
Networking and Communications. WIMOB. IEEE Computer
Society, Washington, DC, pp.81-81, 2007.
[3] Camp, T., Boleng, J. and Davies, V., “A survey of mobility models for ad hoc network research,” Wireless Communication and Mobile
Computing (WCMC):Special issue on Mobile Ad Hoc Networking
Vol.2, No.5,pp.483-502, 2002.
[4] Blazevic, Lj., Le Boudec, J.-Y and Giordano, S., “A Location Based Routing Method for Mobile Ad Hoc Networks,” IEEE
Transactions on Mobile Computing, Vol. 3, No. 4, December 2004.
[5] Venkateswaran, P., Ghosh, R., Das, A., Sanyal, S.K., and Nandi, R., “An obstacle based realistic ad-hoc mobility model for social networks.” International Workshop on Distributed Computing –
IWDC,IIT, Kharagpur, India, pp.37-44, 2005.
[6] Borrel, V., Amorim, M.D. De, and Fdida, S., “On natural mobility models,” In Workship on Automatic Communication. Lecture Notes
in Computer Science, pp.243-253, 2005.
[7] Jayakumar, G. and Gopinath, G., “Perfomance comparison of MANET protocols based on manhattan grid mobility model,”