HAL Id: hal-01664103
https://hal.archives-ouvertes.fr/hal-01664103
Submitted on 7 Nov 2019
HAL is a multi-disciplinary open access
archive for the deposit and dissemination of
sci-entific research documents, whether they are
pub-lished or not. The documents may come from
teaching and research institutions in France or
abroad, or from public or private research centers.
L’archive ouverte pluridisciplinaire HAL, est
destinée au dépôt et à la diffusion de documents
scientifiques de niveau recherche, publiés ou non,
émanant des établissements d’enseignement et de
recherche français ou étrangers, des laboratoires
publics ou privés.
Principal component analysis for characterising
homogeneity in powder mixing using image processing
techniques
Henri Berthiaux, V Mosorov, L Tomczak, Cendrine Gatumel, Jean-François
Demeyre
To cite this version:
Henri Berthiaux, V Mosorov, L Tomczak, Cendrine Gatumel, Jean-François Demeyre. Principal
com-ponent analysis for characterising homogeneity in powder mixing using image processing techniques.
Chemical Engineering and Processing: Process Intensification, Elsevier, 2006, 45 (5), p. 397-403.
�10.1016/j.cep.2005.10.005�. �hal-01664103�
Principal component analysis for characterising homogeneity in powder
mixing using image processing techniques
H. Berthiaux
a,∗, V. Mosorov
b, L. Tomczak
b, C. Gatumel
a, J.F. Demeyre
aaLaboratoire de G´enie des Proc´ed´es des Solides Divis´es, UMR CNRS 2392, Ecole des Mines d’Albi-Carmaux,
Campus Jarlard, Route de Teillet, 81 000 ALBI, France
bComputer Engineering Department, Technical University of Lodz, 18/22 Stefanowskiego 90-924, Poland
Abstract
The many methods which exist to characterise the quality of a powder mixture have been recently reviewed and linked with mixing mechanisms in current literature. In this paper, we try to develop a novel methodology for defining and characterising homogeneity using principal component analysis (PCA) as an alternative to well-known statistical methods, such as auto-correlation functions or variances. We apply this to image analysis for the case of a powder mixture flowing out of a continuous mixing device. An emphasis is placed on the calculation in real-time of the degree of homogeneity of loose materials on the conveyor belt, carrying this mixture. Mass flow disturbances applied to a binary mixture are studied by the proposed methodology, which is found to be sensitive to small structural defaults.
Keywords: Powder mixing; Homogeneity criterion; Image analysis; Principal component analysis
1. Introduction—state of the art
Powder mixing is a widely used unit operation in the pharma-ceutical, agro-food, cement or chemical industries. The process is complex as it depends on many factors operating at vari-ous scales: single particle properties, bulk particle properties, general mixer design and operation, combination of operating conditions, mixture formulation, etc. The quality of a mixture, which may be the degree of homogeneity of loose material at the outlet of a mixer, is important for end-user properties as perceived by customers and/or for in-process properties used by manufacturers for normative procedures. In addition, mixing process optimisation is a matter of reducing mixing time and saving electrical energy, especially for low added-value prod-ucts.
The definition of mixture quality first requires the knowledge of the scale at which it has to be defined, that is the scale of scrutiny of a mixture. For example in the case of pharmaceutical tablet the size of scrutiny is probably equal to a tablet size, that
∗Corresponding author.
E-mail address: [email protected] (H. Berthiaux).
is to say the size of the patients dose. However, this may not be so when the patient interferes, such as when he is allowed to sample himself in the package (if the patient take a piece of tablet for example).
The many methodologies that exist to characterise mixture homogeneity and its structure were recently reviewed and linked with mixing mechanisms by Gyenis[1]. A distinction must be made between the techniques that calculate a structural crite-rion and those which generate an overall critecrite-rion, which are well known in industrial practice. The standard deviation of the composition of a certain number of samples, as well as the cor-responding variance, coefficient of variation, or mixing indices belong to this latter category. Weinekotter[2]illustrated the lim-its of such analyses by discussing two continuous processes having the same variance but radically different organisation: (a) 12 samples with compositions alternating on both sides of the mean; (b) six samples of identical composition higher than the mean followed by six samples of identical composition lower than the mean. When compared to each other from a “customer” end-used property, it is obvious that process (b) is inadequate while it may satisfy a pharmaceutical quality criterion.
On the other hand, fractal analysis, phase-space techniques and the study of auto-correlation functions allows taking into
account the structure of a powder mixture, as the relative posi-tions of the samples are not destroyed by the analysis. Danck-werts [3] was probably the first to suggest the use of auto-correlation functions to describe the scale of segregation of a mixture, that is the maximum size of segregated regions in a mixture· · · or the sample size above which powder homogene-ity is only due to random effects. The auto-correlation function
R characterises the interdependence of the compositions of any
two samples of a series of samples, separated by a distance r (or by a given number of samples). If no correlation exists, then the value of R(r) is equal to zero and the mixture can be considered as homogeneous at this scale. In other words, the scale of seg-regation becomes equal to the scale of scrutiny. In practice, the first “distance” r0for which R equals zero can be read from a plot
of R versus r, called a correlogram. This distance is the param-eter for characterising the structure of the mixture, as it gives a measure of the maximum length of no correlation between samples. However, the determination of r0is not always easy, at
least because a correlogram may exhibit asymptotic behaviour, or because it is very sensitive to a small variations in the compo-sition of the samples. Indeed, there is still a need for developing new, meaningful, industry-pertinent methodologies for quanti-fying the homogeneity of powder mixtures.
From the point of view of the techniques used for obtaining such information, recent emphasis has been placed on on-line methods which avoid the interference of thief sample probes
[4] and the related statistical problems. Optical measurement techniques have received wide attention in the scientific com-munity, especially in the past decade, from the pioneering work of Harwood et al.[5], to that of Berntsson et al.[6](one may also refer to Weinek¨otter and Reh [7]or Steinmetz et al.[8]). Near Infrared (NIR) spectroscopy is now beginning to be used in industrial R&D for measuring powder blends. However, many of the workers involved in such projects find difficulties in the calibration procedures and time stability of the signals. Also concerning these type of methods, but very much at the research stage, we may cite laser induced fluorescence as a very promis-ing tool for pharmaceutical mixtures[9]. Electrical capacitance tomography (ECT) has been under rapid development since the mid-nineties and has been applied to real cases in general pow-der technology[10–12], and in powder mixing in particular[13]. While it seems to be a valuable alternative to optical methods, it seems better suited for coherent pipe flows, that is to say with low disturbance of the flow rates because porosity changes have a strong influence on data reliability. In comparison to other measurement techniques, image analysis is non-destructive and is characterised by a great speed, which is very important in on-line systems. In the recent scientific literature, Muerza et al.
[14]have proposed such a method. In this work the method is applied to two free-flow powders differing in colour mixed by a continuous static mixing unit and poured for transport by a belt conveyor without disturbance. A CCD camera placed on the con-veying line captures images of the moving belt. These images are then treated and analysed using the auto-correlation technique to obtain the characteristic distance r0. Because this required a
critical analysis of the correlograms, with respect to their shape, it was performed off-line from the measurement chain.
From the above, one may understand that a single method cannot cover the whole range of possible powder blends. Also, when considering its applicability to industrial problems, the exactitude of the method comes after other type of considera-tions, such as the stability of the measurement with time, easy calibration procedures or no calibration required at all, sam-pling needed or not, compatibility with industrial conditions, real-time data analysis, . . .. Therefore, working on new on-line methodologies for accurate data treatment in real-time is still an important field of investigation. This paper proposes a novel method based on real-time principal component analysis of pow-der mixture images captured by a CCD camera with the claim that this methodology of data processing may be adapted to other types of on-line techniques, such as capacitance measurements or NIR spectroscopy.
2. Powder mixture measurement based on image analysis
The method developed in this paper aims to measure the degree of homogeneity of loose materials on a conveyor belt using image processing techniques. For this, one powder (semolina; particle size, 100–250 !m) and a tracer (semolina coloured by iodine adsorption) were used as particulate systems having identical properties except colour. The measurement chain consists of a CCD camera placed over the conveyor belt which transports the mixture of the loose materials, as well as a PC computer. The schematic diagram of this system is presented inFig. 1.
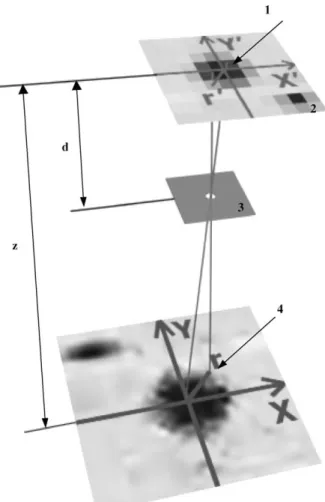
A time sequence of images is captured by the camera and represents the solid mixture on the belt during conveying. These images are treated with specially designed computer software to calculate the homogeneity ratio of the mixture. Each image represents a two-dimensional sample of analysed mixture. The pinhole camera model used (seeFig. 2) is detailed inAppendix
and provides a continuous brightness function corresponding to each frame. Digitizing a frame consists in sampling and quantifying the function, it gives a grey scale image contain-ing information about tracer concentration. Indeed the black tracer concentration is directly linked with the brightness as its reflectance is different from that of the white particles.
In the example shown onFig. 3, a sample and a quantized binary mixture image is shown. The diameter φ of any particle in the mixture is approximately equal to five pixels.
Fig. 2. Pinhole camera model (1, image coordinates; 2, image plane; 3, pinhole camera; 4, world coordinates).
Fig. 3. Example of sampled and quantized binary mixture image.
3. Homogeneity definition based on PCA
3.1. What is PCA?
Each image transformed as described above consists of rows of pixels describing the solids concentration of the powder stream. Taking into account the rows of an image that comprise information about powder mixture we further assume that the
number of such rows is equal to N. Typical brightness changes within any row have a probabilistic character, so that they can be treated as any stochastic stationary process Xn(m), n = 0, . . .,
N − 1, m = 0, . . ., M − 1, where M is a number of pixels for each
row, and n is a row number. Hence a mathematical model of an image can be defined by a stochastic N-dimensional image vector
X =[Xn(m)], n = 0, . . ., N− 1 where each vector element is called
an elementary process (EP). Statistical relationships among EP processes have been determined by a covariance matrix CXof
size N× N, where a matrix term Cijis determined as
Cij= 1 M M!− 1 m=0 (Xi[m]· Xj[m]), i, j= 0, . . . N − 1 (1)
In this, Xi[m], Xj[m] are denoted as the EPiand the EPjprocesses.
Furthermore, we suggest assuming that each EP process is a stationary process and its statistical parameters are constant for single sample.
For defining a homogeneity criterion we propose using the principle component analysis (PCA) of EP processes[15]. The PCA technique, which uses the singular-value decomposition method, detects a ratio correlation among the EPs processes. The PCA has been chosen for its high efficiency for categorizing and classifying huge data sets such those of EP processes.
The PCA technique consists of finding linear transforma-tions called clouds of data of the original processes {EPn}
n = 0, . . ., N − 1, that have the property of being uncorrelated.
This transformation is done by first normalizing the variables so that they have means of zero and a variance of one. The PCA determines the perpendicular axes (called eigenvectors), which are defined by the dimensions of a covariance matrix. The principal components are the eigenvectors obtained from an eigenvector–eigenvalue decomposition of the covariance matrix of the EP processes. The eigenvalue λr corresponding to an
eigenvector represents the amount of variability between EP processes explained by that eigenvector. The eigenvector of the largest eigenvalue is the first principal component. The eigen-vector of the second largest eigenvalue is the second principal component and so on. There will be the same number of axes as variables (dimensions). The longest axis is the first principle component (PC1), and next major axis is the second principle
component (PC2). We make a slice through the cloud of EP
pro-cesses using the R-dimensional space defined by PCr, r = 1, . . .,
R and project all of the EP processes onto this space, then obtain
a R-dimensional representation of the EP processes retaining the maximum variation (information) contained in the multivariate data. The space PCrprovides maximum separation between the
EP processes. The percentage crof the variability explained by
the rth principal component is:
cr(%)=
λr
λ1+ λ2+ · · · + λR × 100
(2)
For analysis of EP processes we choose those of PCr, with the
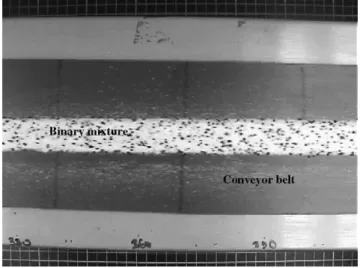
Fig. 4. Photograph of the binary powder layer as seen by the CCD camera.
3.2. Application of PCA to powder mixtures
Analysing a solid mixture involves the formation of a pow-der layer of constant width and thickness which is continuously filmed by a CCD camera. The recorded film is further treated to obtain an unlimited series of frames that represents the sur-face of the mixture layer (15 frames per second).Fig. 4shows a typical example frame as captured by our set-up.
Matlab 5.2 was used for image analysis. First, the mixture sample is divided up into L rectangular areas of the same size (Fig. 5b), L value being fixed empirically. Next we perform the
Table 1
Percentages cr, r = 1, 2, 3 of the variability explained by first, second and third
principal component for some rectangular areas
Rectangular area number, l c1(%) c2(%) c3(%)
1 97.892 1.691 0.212 2 97.027 1.807 0.685 3 94.871 4.211 0.483 4 97.648 1.795 0.446 70 99.322 0.559 0.088 80 98.205 1.107 0.488 90 99.314 0.303 0.18 100 98.722 1.03 0.152
PCA analysis for each rectangular area. Area row data (EP pro-cesses) enable the calculation of eigenvalues λrand eigenvectors
of{Xn(m)} n = 0, . . ., K− 1, where K is the number of rows
anal-ysed in a rectangular area.
Then we present EP processes of analysed areas onto three-dimensional (3D) space. To do this, we choose PCr, r = 1, 2,
3 only because they ensure the percentage cr of the variability
greater than 98%. The example values of cr for three
princi-pal components are presented inTable 1. InFig. 5c, examples of the distributions of EP processes into the 3D space for two rectangular areas are also depicted.
A mixture can be defined as homogenous if any test element of the mixture has the same composition and properties as any other. In our approach, we use rectangular areas of analysed mixture sample as mixture test elements (scale of scrutiny of the mixture).
For the definition of a criterion of homogeneity of a powder mixture in any frame, we first compare each rectangular area of the analysed mixture sample to another using the similarity index slwhich we define as
sl= 1 L· K L ! j=1 K ! i=1 × " (PCpi1 − PCji1) 2 + (PCpi2 − PC ji 2) 2 + (PCpi3 − PC ji 3) 2 . (3) In the above, l = 1, . . ., L; l̸= j, K is the number of rows in the analysed rectangular areas, L the number of areas of the mixture sample and PCjik is the kth principle component calcu-lated for ith row in jth rectangular area. Comparing rectangular areas is fast and easy by PCA which is an important feature with respect to other methods cited in the Section 1 of this paper.
Fig. 6. (a) Mixture sample no. 104; (b) similarity indexes as grey scale values of a) (L = 426).
We confirm that the s value is smaller for similar rectangles and higher when differences between them are greater. For an ideal homogeneous mixture s all rectangular areas are identical and sl calculated for every area is equal to 0. InFig. 6b,
simi-larity indexes slare presented for the mixture sample no. 104 as
grey scale images. They were rescaled to range [0, . . ., 1]. For instance, inFig. 6a region A is more homogeneous than region B.
Then we calculate the sum S of the slvalues specified for all
rectangular areas of nth mixture sample:
Sn= L
!
l=1
sl[n]. (4)
Finally for nth mixture sample, we define a homogeneity crite-rion hnas hn(%)= # 1− Sn S0 $ × 100. (5)
In Eq.(5), S0is a sum of slvalues which are calculated for the
perfectly segregated mixture sample, which is used as hetero-geneity pattern.
4. Experimental results
The loose material transported on the conveyor belt and cap-tured by the CCD camera arrangement was analysed in terms of the above homogeneity criterion (Eq.(5)).Fig. 7presents the results for 21 mixtures corresponding to the motion of the belt. As it can be seen inFig. 7, a part of conveyor belt does not contain any particle of the mixture (samples from 84 to 104). The samples ranging from no. 108 to 164 correspond to a mix-ture as leaving a continuous mixer, or at the discharge of a batch mixer. The part of conveyor belt without a mixture can be inter-preted as area of one mixture component, therefore it disturbs homogeneity of the tested mixture. The value of the homogene-ity ratio is the lowest for 84th mixture sample and it increases for the following samples because the part of the belt without mixture becomes smaller.
To calculate a homogeneity ratio we first choose a rectangular area numbered L. The single rectangular area should represent quality of the mixture and its size must be adapted to the dimen-sions of the loose material particles and to a specified scale of scrutiny. Choice of rectangular area number is important because measurement results are dependent on it. Homogeneity ratio val-ues calculated for different L valval-ues are presented inFig. 8. The homogeneity ratio decreases when L decreases, meaning that mixtures are always worse when analysed at a smaller scale of
Fig. 8. Homogeneity ratios calculated for different rectangular area number L, showing the effect of the small structural default (circle line).
scrutiny, as common sense would suggest. Indeed, the intensity of segregation (variance) of a random mixture is known to be inversely proportional to the number of particles per sample. Furthermore, one can also focus on a small area that contains practically no coloured particles and located in the middle of sample no. 96. This area disappears for sample no. 124 and can only be detected for the three lowest L values (L = 30–100) in
Fig. 7by a small rise of homogeneity. For the highest value of L, the scale of scrutiny is much higher than the scale of segregation (that of the segregated area) and nothing can be detected. This seems to indicate that the methodology employed is sensitive to the structure of the mixture, so that a structural defect can be detected and perhaps withdrawn from the production line.
5. Concluding remarks
This paper presents a methodology based on principle com-ponent analysis for defining and characterising powder mixture homogeneity as it flows out of a continuous mixer or at the dis-charge of a batch process. Image analysis is used here and seems to be well suited to illustrate the method, but the method can be applied to other measuring techniques (electrical capacitance, NIR, etc.).
Images of a mixture of black and white particles of semolina transported on a conveyor belt are taken by CCD camera. These are treated with a classical pinhole model and digitized on a grey scale to give information about the concentration of black par-ticles. Each image is considered to be a series of rows of pixels. Each row is treated as a stochastic process. PCA methodol-ogy leads to a three-dimensional representation of the processes retaining the maximum variation (information) contained in the multivariate row data. The similarity index values, which are derived from this data treatment, allow the calculation of a cri-terion of mixture homogeneity.
The mixture is decomposed into rectangular areas whose size corresponds to the scale of scrutiny. First results show that the homogeneity criterion is dependent on the scale of scrutiny cho-sen. The method allows the detection of small structural defaults in the mixture – that may lead to rejection of part of a production – in an easier way than other types of analysis (auto-correlation or phase portrait).
The use of image analysis illustrates the concepts of scales of segregation and scrutiny, as well as being relatively easy to perform in real-time with few calibration procedures. However, the sensitivity should be verified if it is to be used for industrial applications. Because of the complex phenomena at play and the diversity of powder properties, there is no doubt that no single technique will be able to treat all kinds of powder blend. Therefore, focussing on the development of a range of different techniques and trying to define their domain of applicability for a single and sensitive methodology for data treatment (such as PCA) should be encouraged.
Appendix
The pinhole camera consists of a non-transparent plane with a small hole. The model used is equivalent to simply describing
the image formation with such a lens system. The image plane is located parallel to the plane of the camera at a distance d. Light radiated by the mixture of loose material passes through the hole and illuminates the image plane.
The relationship between world co-ordinates (x, y) on the initial frame and image co-ordinates (x′, y′) on a plane situated at the distance z is as follows:
x′= − x· d
z− d and y
′= − y· d
z− d. (6)
Using Eq.(6)it is easy to prove that the relationship between a length r in world co-ordinates and the corresponding length r′ in image co-ordinates is:
r′= d· r
|z − d|. (7)
From Eq. (7) it follows that r′ is dependent on r but also on distances z and d.A typical image formation model can be described by a continuous image function g(x′, y′), whose value corresponds to the brightness at image points
[16]. g(x′, y′)= % x % y h(x′− x, y′− y) · f (x, y) dx dy (8)
where f(x, y) represent the radiant intensity of the surface of an object and h(x′− x, y′− y) is the point spread function.
The point spread function reflects the response of the imag-ing device to a simag-ingle point source. Indeed, this function takes into account the effect that objects lose their sharpness in the image.
Brightness at the image point (x′, y′) depends on the radiance emitted by the surface of an object in the scene. It is determined by two factors: the illumination falling on the surface and illumi-nation reflected by the surface of the object, which is dependent on its material properties (e.g. reflectance). In our experiments illumination reflected by the mixture depends on the properties of its components. It directly affects the brightness of the image points, therefore we can use images as a data source to analyse solid concentration.
To make a digital image from a continuous-tone image, it must be divided up into individual points of brightness. The process of breaking up a continuous-tone image is referred to as sampling. The 2D continuous image g(x′, y′) is divided into
N rows and M columns. The intersection of a row and a
col-umn is termed a pixel. The appropriate digital brightness data value is assigned to the integer coordinates [n, m] with n = 0, . . .,
N − 1 and m = 0, . . ., M − 1 is p[n, m]. The quality of a digital
image is directly related to the number of pixels and the range of brightness values. A continuous image function g(x′, y′) can be sampled using a discrete grid of sampling points x = n∆, y = m∆ in the plane. Two neighbouring sampling points are separated by distance ∆ along x axis and along y axis. The ideal sampling
s(x′, y′) in the regular grid can be represented using a collection
of Dirac distributions: s(x′, y′)= N!− 1 n=0 M!− 1 m=0 δ(x′− n∆, y′− m∆) (9)
where ∆ is the sampling distance or interval and δ(·, ·) is the ideal impulse function. The sampled image gs[n, m] is then the product
of the continuous image g(x′, y′) and the sampling function s(x′,
y′): gs[n, m]= g(x′, y′)· N!− 1 n=0 M!− 1 m=0 δ(x′− n∆, y′− m∆) (10)
The process of determining digital brightness values ranging from black, through grey tones, to white is referred to as quanti-zation. The combination of sampling and quantization processes is referred to as image digitization.
References
[1] J. Gyenis, Assessment of mixing mechanisms on the basis of concen-tration patterns, Chem. Eng. Process. 38 (1999) 655–674.
[2] R. Weinek¨otter, H. Gericke, Mixing of Solids, Particle Technology Series, Kluwer Academic Publishers, Dordrecht, 2000.
[3] P. Danckwerts, Theory of mixtures and mixing, Research (London), 6, 1953, 355–361.
[4] F.J. Muzzio, P. Robinson, C. Wightman, D. Brone, Sampling practices in powder blending, Int. J. Pharm. 155 (1997).
[5] C.F. Harwood, R. Davies, M. Jackson, E. Freeman, An optic probe for measuring the mixture composition of powders, Powder Technol. 5 (1971/1972) 77–80.
[6] O. Berntsson, L.G. Danielsson, B. Lagerholm, S. Folestad, Quantita-tive in-line monitoring of powder blending by near infrared reflection spectroscopy, Powder Technol. 123 (2002) 185–193.
[7] R. Weinek¨otter, L. Reh., Characterisation of particulate mixtures by in-line measurements, Particle Particul. Syst. Charact. 11 (1994) 284–290. [8] D. Steinmetz, B. Hocine, M. Poux, C. Lagu´erie, Analyse du m´elange de poudres en fluidisation gazeuse `a l’aide de la m´ethode de d´efluidisation et par capteur `a fibre optique, Powder Technol. 89 (1996) 139–147. [9] C.K. Lai, D. Holt, J.C. Leung, C.L. Clooney, G.K. Raju, P. Hansen,
Real-time non-invasive monitoring of dry powder blend homogeneity, AIChE J. 47 (11) (2001) 2618–2622.
[10] T. Dyakowski, L.F.C. Jeanmeure, A.J. Jaworski, Applications of electri-cal tomography for gas–solids and liquid–solids flows—a review, Powder Technol. 112 (2000) 174–192.
[11] K.L. Ostrowski, S.P. Luke, M.A. Benett, R.A. Williams, Application of electrical capacitance tomography for on-line and off-line analysis of flow pattern in horizontal pipeline of pneumatic conveyer, Chem. Eng. J. 77 (2000) 43–50.
[12] W. Warsito, L.S. Fan, Measurement of real-time flow structures in gas–liquid and gas–liquid–solid flow systems using electrical capaci-tance tomography, Chem. Eng. Sci. 56 (2001) 6455–6462.
[13] N. Ehrhardt, M. Montagne, H. Berthiaux, B. Dalloz-Dubrujeaud, C. Gatumel, Assessing the homogeneity of powder mixtures by on-line electrical capacitance, Chem. Eng. Process. 44 (2005) 303–313. [14] S. Muerza, H. Berthiaux, S. Massol-Chaudeur, G. Thomas, A dynamic
study of static mixing using on-line image analysis, Powder Technol. 128 (2002) 195–204.
[15] B.R. Horn, Robot Vision, MIT Press, 1986.
[16] D.F. Morrison, Multivariate Statistical Methods, McGraw-Hill Book Company, 1976.