HAL Id: hal-01633655
https://hal.archives-ouvertes.fr/hal-01633655
Submitted on 7 Feb 2018
HAL is a multi-disciplinary open access
archive for the deposit and dissemination of
sci-entific research documents, whether they are
pub-lished or not. The documents may come from
teaching and research institutions in France or
abroad, or from public or private research centers.
L’archive ouverte pluridisciplinaire HAL, est
destinée au dépôt et à la diffusion de documents
scientifiques de niveau recherche, publiés ou non,
émanant des établissements d’enseignement et de
recherche français ou étrangers, des laboratoires
publics ou privés.
Detection of Micro-Cracks on Highly Specular
Reflectors: Dimensioning a Vision Machine Based on
Optical Properties
Rémi Gilblas, Thierry Sentenac, Jean-José Orteu, Mickaël Sauvée, Guillaume
Sierra, Florian Gacoin, Olivier Guillaumon
To cite this version:
Rémi Gilblas, Thierry Sentenac, Jean-José Orteu, Mickaël Sauvée, Guillaume Sierra, et al.. Detection
of Micro-Cracks on Highly Specular Reflectors: Dimensioning a Vision Machine Based on Optical
Properties. IEEE Sensors Journal, Institute of Electrical and Electronics Engineers, 2017, 17 (23),
p.7901 - 7907. �10.1109/JSEN.2017.2762359�. �hal-01633655�
Detection of micro-cracks on highly specular
reflectors: dimensioning a vision machine based on
optical properties
R´emi Gilblas, Thierry Sentenac, Jean-Jos´e Orteu, Mickael Sauv´ee, Guillaume Sierra, Florian Gacoin and Olivier
Guillaumon
Abstract—This article describes the complete dimensioning of a method and apparatus dedicated to the automatic detection of defects on optical mirror-like components called OSR, which are used to ensure the thermal control of satellites. Firstly, the requirements of the method are defined according to the properties of the OSR (multilayer and semitransparent) and the defects to be detected. The defect dimensions are then measured and exhibit very dispersed micrometric dimensions. Secondly, the optical characterization of the OSR and its sublayers is conducted, enabling the dimensioning of the machine with regard to the localization of the defect (surface, interface or volume). Thirdly, a semi-industrial prototype is developed and evaluated through two kinds of experiments. The first experiment illus-trates the production capacity of the prototype and the second the measurement capability. Results showed that the prototype exceeded the initial requirements and could be used to replace the currently-used control with confidence.
Keywords—Defect detection, Optical properties, Spectrometry, Optical microscopy, Satellite protection
I. INTRODUCTION
Satellites placed in space conditions are exposed to extreme environmental conditions. They are surrounded by very low temperatures and half of them are illuminated by the sun. In such conditions, as convection cannot take place in a vacuum, the only way energy can be exchanged between the satellite and its environment is by radiation. This results in two phenomena: first, a high thermal gradient may appear on the surface located at the frontier of the illuminated/shaded area. In other words, each part of the satellite’s surface is submitted to a thermal cycling which may induce the mechanical degradation of the surface. Thus, for the preservation of the satellite, it is essential to limit the thermal gradient, i.e. to homogenize the surface temperature. Another important consideration is the evacuation of the internal energy created in the satellite. Each electronic component inside the satellite is being heating under the Joule effect. This heat energy is conducted towards the surface of the satellite and contributes to its internal
ICA (Institut Clement Ader),Universit´e de Toulouse; CNRS, Mines Albi, INSA, UPS, SUPAERO-ISAE, ICA (Institut Cl´ement Ader); Campus Jarlard, F-81013 Albi cedex 09, France.
ALCI, ZAC Fr´ejorgues Est, 317 rue du Salaison, 34130 MAUGUIO, France. MAP-Coatings, ZI-2, Rue Cl´ement Ader, 09100 Pamiers, France Airbus Defence & Space, 31 Rue des Cosmonautes, Z.I. du Palays, 31400 Toulouse
temperature. Once again, a thermal gradient appears in the depth of the satellite, and the evacuation of this energy is a priority for the satellite’s health. Solutions involving heat pipes are currently used to spread the heat over the satellite walls [12].
Alternatively, optical solar reflectors (OSR) cover part of the surface of the satellite [16] and enable thermal regulation through their radiative properties. The high solar reflectivity limits the absorption of solar energy and the high thermal emissivity enables the evacuation by radiation of the internal energy caused by electronic components. However, these com-ponents are mechanically fragile and, as they are mirror-like components, their surfaces are subject to scratches and surface damage. Each Telecom satellite is covered by approximately 15000 OSR. Consequently, on the ground, a prolonged sorting phase is required to equip the satellite with safe OSR. This sorting phase is currently performed by human operators, and there is great interest today in automating this process in order to improve objectivity and increase the production rate. The method selected for this operation must be able to detect small defects (around 100µm) like scratches, pinholes or dust, on a 4cm ⇥4cm specular material. The final prototype will be a control device, or, if possible, a measurement device, which can operate at a high production rate.
Contact techniques exist (penetrant testing [7], magnetic par-ticle testing [10]) but are not adapted to very small defects and a high production rate. Non-contact techniques are thus a good alternative. Techniques based on ionizing radiation (X-ray [13], Gamma, electron, neutron) show high sensitivity but are difficult to adapt to an industrial context and a high pro-duction rate. Semi-intrusive methods (ultrasound control [14], Eddy current) are already used in the aeronautical and micro-electronics industry, but they can harm fragile components like OSR.
The remaining methods are optical ones, which exploit the transmission, reflection or emission of visible or infrared light. The first category of optical methods are based on transmission ones. In this configuration, the optical source faces one part of the sample and the detector (in the same spectral band) faces the other part. If the material is semi-transparent, or if the defects create empty areas, a signal variation will be detected. This technique is used to detect some defects in Kevlar samples [4].
The second class of method is based on the self-emission of radiation. Electroluminescence [15] or photoluminescence [19]
lead to the emission of visible light, but the first is semi-invasive (contact with the electrodes) and the second requires a high-speed sophisticated detection system. Thermography, with the emission of infrared light, has shown great promise in the past 10 years ([5], [6]). Stationary, flying spot or laser-line thermography exhibit very good results. The main limitation of these techniques is the lower definition of the infrared cameras compared to the visible ones.
Finally, the largest family of detection methods use the re-flection of light. Some methods simply use the rere-flection of incoherent light. On specular materials, the problem of over/under exposure is solved by the use of annular lighting systems. In so doing,“dark-field” conditions are obtained and the defects appear bright on a dark background [3]. Other methods are based on a priori knowledge about the reflec-tion properties of a given material in a given configurareflec-tion, and where extraordinary reflections are identified (see [17]). Alternatively, coherent sources are used in references [11] and [9], where a calibrated laser pattern is projected and reflected on a sample, and the distortion is analysed.
The same idea is used for deflectometry techniques [8], where a reference pattern is reflected by the sample, and the final detection capacity is greatly enhanced. Phase deflectometry, in particular, seems well adapted to the analysis of micro defects on specular surfaces. However, and like for interferometric, holographic [18] or Moir´e techniques, they require a very well-controlled reference phase, which may complicate the experimental set-up. Alternatively, 3D reconstruction methods like time of flight, stereovision, triangulation and shape from focus and/or polarization may be used for defect detection. However, they are difficult to extrapolate for micro-defects because of the lack of texture of the OSR’s image.
This paper addresses the problem of controlling a multi-layer material, where the defects to be detected may appear at the surface and/or the interface of each layer. To do so, a coupling of the aforementioned methods would probably be the right solution. To rationalize this choice, a fine optical characterization was performed on the entire OSR and on each sublayer. Then, a semi-industrial prototype was developed and evaluated on a set of OSR.
Three parts compose this article. The first devoted to the definition of the requirements of the method, regarding the constitutive materials and the defect dimensions and morphol-ogy. In the second part, the dimensioning of the machine is given, based on the optical characterization of the OSR. Finally, part 3 presents the performances of the final prototype on a representative dataset.
II. ISSUES AND REQUIREMENTS OF THE DETECTION METHOD
In this section, the OSR and their defects are presented in order to indicate the requirements of the final method. A. Description of the OSR
The OSR studied in this paper were manufactured by QI Optics R. They are 4⇥4cm2squares with a 100µm thickness
[1]. They are constituted as multi-layer materials, the structure
of which is presented in Figure 1.
The internal face (NiCr) has to conduct heat from the
Fig. 1. Description of the QI Optics OSR.
inside of the satellite towards the surface. The external face (CMXGlass) has to evacuate it by radiation. The perfor-mances of an OSR are guided by two parameters: 1) Solar absorptivity (i.e. absorptivity integrated between 250 and 2500 nm) equal to0.06. Absorptivity must be low to avoid radiative heating of the OSR. 2) Thermal emissivity (emissivity inte-grated between 5 and 50 µm). Thermal emissivity must be high (here0.83) to evacuate internal heat by radiation. To sum up, the ratio of solar absorptivity over thermal emissivity must be as low as possible (here0.07).
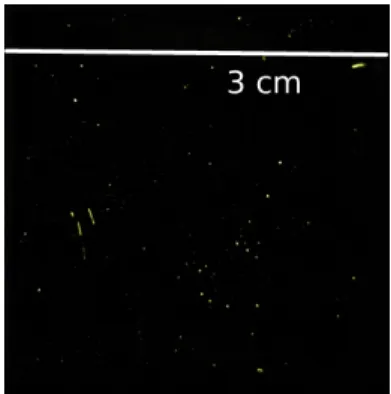
OSR are mirror-like optical components, so multiple defects can appear during the production process and/or manipulation before flight. They appear in contrast with their surroundings, so a healthy OSR is supposed to be perfectly uniform. We discriminate have defined four classes of defects detected by the visual inspection already in place. An example of an OSR with defects is presented in Figure 2. This photograph has been taken with a back lighting and a black mask around the OSR to avoid overexposure. If the defects are revealed by this technique, it means that the defect is crossing the opaque layers (NiCr + Ag), and can be observed by transmission. Note that the surface defects cannot be observed by this technique.
Four classes of defects are defined as follows:
Fig. 2. Photograph of an OSR with defects at the lighting table.
1) Scratches: defects whose length are much higher than their width, such as a line. Probably caused by mechan-ical stretching.
3) Nebula: group of pinholes and/or a blurred diffuse illuminated area. Global oxidation.
4) Pollution: an organic particle or dust which has been adsorbed by the surface and can potentially be removed. Note that the quality of the OSR is normalized by the MIL-PRF-13830B standard [2] which imposes less than 2 particles per mm2.
B. Dimensions of the defects
The first observations of the OSR with a standard micro-scope equipped with an annular lighting system revealed a large number of surface defects like dust or organic pollutants. Thus, in a non white room environment, it would be very dif-ficult to dissociate pollution defects from real surface material defects. It was then decided to restrict the calculation of the OSR defects to the crossing ones, i.e. scratches, pinholes or nebula that can be seen by transmission.
A typical picture of a scratch and a pinhole observed with a transmission optical microscope is displayed in Figure 3.
The measurement of the dimensions of these defects was
Fig. 3. Transmission micrography of a scratch (a) and a pinhole (b).
performed with the same microscope, on a set of 200 OSR and by approximating every defect shape to rectangles defined by a width and length. The dimensions are given in Table I.
As regards the scratches, the very low width/length ratio was verified. For this defect, the length was measured with the light table, because it is too large for microscopy. The width was about 4 µm, with a high dispersion around this value (60%). The conclusion is that the mean width is inferior to 10 µm, which makes it difficult to measure with a camera system. With regard to the pinholes, the relative dispersion (140%) and the dimensions were higher. Finally, the nebula were bigger but composed of small pinholes. Automatic detection should
TABLE I. DIMENSIONS OF CROSSING DEFECTS INOSRMEASURED BY TRANSMISSION OPTICAL MICROSCOPY
Scratch Pinhole Nebula Population 36 35 32 Length (µm) ⇡ 10000 75 ± 106 109 ± 409 Width (µm) 3.6 ± 2.2 18 ± 11 107 ± 156 Depth (µm) > 0.17 > 0.17 > 0.17 Perimeter (µm) - - 460 ± 1351 Surface (µm2) - 1422 ± 1210 18332 ± 140780
involve the detection of a diffuse illuminated area.
To conclude, the dimensions of the defects were very dis-persed, with no characteristic sizes. The measurement of the defect dimensions was possible above the of the prototype, under which only detection was possible. The final prototype must thus be very flexible, and the performances will depend on the size of the defect.
C. Final requirements of the method
The requirements of the method are given in this part. They are critical to the future satellite’s health and ageing. Indeed, if a part of the metallic layer is missing (crossing defect), the OSR will no longer reflect correctly, and it might locally absorb solar light. This phenomenon induces hot spots on the satellite, which accelerate degradation and ageing. Alternatively, if the thickest layer of the glass is damaged, it can produce a mechanical weakening of the OSR and a local point where radiative losses are weaker.
The minimum requirements for the prototype developed are the following:
• Automaion (or, if possible, improvement) of the present visual control: control of the OSR and detection of crossing defects.
• Resolution: detection of the defects in the depth (maxi-mum 170 nm) and laterally from 10 to 100 µm. • Cadence: possibility to reach industrial cadence, with
rapid acquisition and treatment.
• Low cost: simplicity of the apparatus (camera, optics and optical source).
To reach these requirements, the selected approach is based on a fine characterization of the optical properties of the OSR. This knowledge will enable us to tune the prototype for the appropriate defect detection and eventually to adapt it if other defects need to be detected.
III. DIMENSIONING THE VISION MACHINE BASED OF THE OPTICAL PROPERTIES
This section presents the results of optical characterization to deduce the dimensioning of the machine.
A. Optical characterization strategy and results
In this part, the measurement of the spectral coefficients (reflection, transmission and absorption) is performed.
TABLE II. COMPOSITION OF NON-ENTIREOSRSAMPLES
Sample number 1 2 3 CMX GLASS X X X
Ag X X
NiCr X
1) Methods and apparatus: To completely understand the radiative properties of the OSR, we need to examine the constitutive sub-layers of the OSR. These components are presented in Table II.
Sample 1 is the CMX glass constituting the OSR, conferring rigidity and high thermal emissivity to the component. Sample 2 represents the effect of the Ag layer, and sample 4 the NiCr layer (entire OSR).
The apparatus used for the radiative properties characterization was a Bruker FTIR spectrometer, equipped with two sources and two detectors enabling measurement of optical properties from 0.9 to 20 µm. The first source was a Halogen lamp, covering the visible (VIS) and near infrared (NIR), typically between 0.6 to 2.5 µm and the second was a hot SiC globar for the middle infrared (MIR). The first detector was based on an InGaAs technology for the NIR (0.9 to 2.5 µm) and the second was a DLaTGS (from 2 to 25µm). Sensitivity of DLaTGS is high up to 20 µm and decreases thereafter. For the reflectance measurement, we used an integrating sphere made of Infragold, which is a good reflective/diffuser from the NIR to the MIR. For the transmission measurement, a specific module was installed in the measurement chamber. Finally, the calculation of absorptivity is done was carried out using thanks to Kirchhoff’s law, stating that the sum of the radiative properties is equal to one (see Eq.1):
↵( ) + ⇢( ) + ⌧ ( ) = 1 (1) With : wavelength; ↵ : absorptivity; ⇢ : reflectance; ⌧ : transmission.
Note that on this kind of semi-transparent multi-layer material, some interference may appear, in which fringe spacing is a multiple of the wavelength. This effect must not be considered by this study, as it is not significant for the energy balance of the material. For this reason we decided to average the spectrum when we noted the presence of interference.
2) Results of sub-layer optical coefficients spectra: This part describes the spectrometry results for the sub-layer optical coefficients.
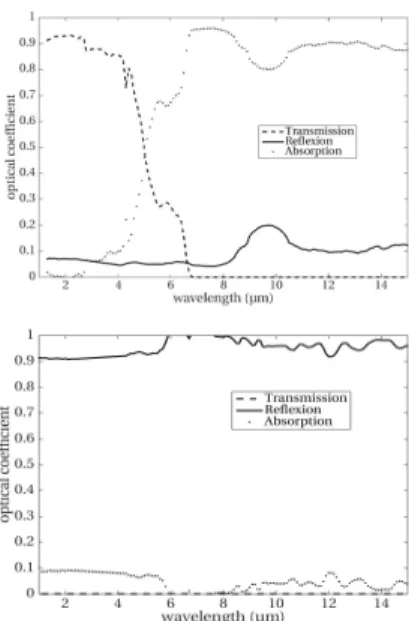
a) Optical coefficient of the CMX glass layer: To begin, Figure 4a shows the radiative properties of the CMX glass layer.
The transmission spectrum of the CMX glass shows a sudden drop after 5µm. This layer then becomes opaque after this wavelength. The reflectance is almost constant and around the value 0.1. Following Kirchhoff’s second law, which states that at thermal equilibrium, emissivity equals absorptivity (" = ↵), it proves that the CMX glass layer confers good thermal emission properties to the OSR.
b) Optical coefficient of the Ag layer: Figure 4b shows the radiative properties of the silver layer. At this thickness, the layer is completely opaque, and the transmission spectrum
Fig. 4. Optical Coefficients for : a) CMX Glass layer; b) Silver layer.
is null. The reflectance is very high, close to one, and increases with wavelength, which is very coherent with a metallic behaviour. The increase in reflectivity from 6µm to 8µm is an artefact caused by the water absorption peak. To sum up, the Ag layer plays the role of a good solar reflector.
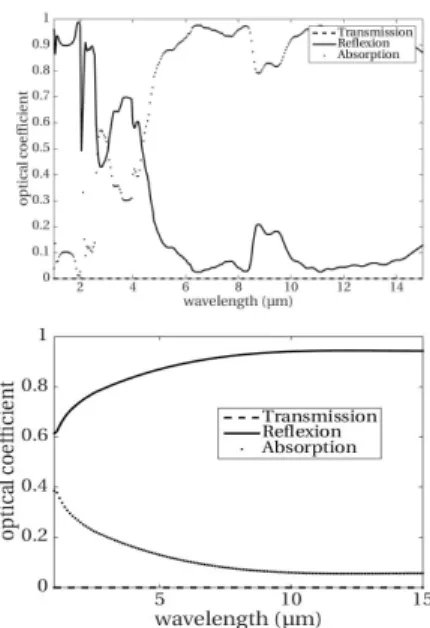
c) Optical coefficient of the entire OSR: Figure 5 shows the radiative properties of the OSR, from the CMX Glass side (a), and from the NiCr side (b).
¿¿From the CMX Glass side, the reflection properties can be considered as a combination of the reflection at the air/CMX glass interface, transmission through the CMX glass and the reflection on the silver layer. As seen on the spectrum of Figure 5a, the MIR reflectance is mainly guided by the reflections at the air/CMX Glass interfaces, as the CMX glass absorbs radiation. The peak at 9µm testifies to this behaviour and can be encountered in the reflection spectrum of the CMX glass only. On the contrary, in the VIS and NIR spectrum, the reflectance spectrum is mainly controlled by the transmission of the CMX glass and the reflection of the silver layer. The high level of reflectance below 2µm reveals the silver layer. The peaks appearing at 2 and 3 µm are signatures of water and CO2.
The spectrum of the NiCr layer (see figure 5b) is representative of a metallic behaviour, with an increasing reflectance with wavelength.
The important conclusion of this part is that it is possible to obtain information on layers in the thickness of the material, by adjusting the spectral domain.
B. Technological considerations for the vision machine In this part, detection methods are considered with regard to the localization of the defect in the OSR. The main results
Fig. 5. Optical Coefficients for the entire OSR viewed from : a) the CMX Glass side; b) The NiCr side.
TABLE III. DETECTION METHODS IN RELATION TO DEFECT LOCALIZATION
Defect localization Sublayer(s) Method Spectral domain Surface NiCr Reflectometry NIR/MIR Volume NiCr Thermography MIR Interface NiCr-Ag Thermography MIR Volume Ag Thermography MIR Interface Ag/CMX Glass Reflectometry NIR Volume CMX Glass Thermography MIR Surface CMX Glass Reflectometry MIR
are presented in Table III.
First of all, areflectometric method seems an obvious choice for surface defect detection. It can be used for the NiCr and the CMX glass layers in their opacity spectral bands, respectively over the whole spectral band and after 5 µm. If reflectometry is performed for wavelengths inferior to 5 µm, the Ag/CMX interface will be inspected. Moreover, as OSR are specular materials, one way to enable good detection is to work in darkfield conditions.
Secondly, transmitography should enable the detection of crossing defects, whatever the spectral band.
Thermography seems interesting for the detection of simul-taneous surface, interface and volume defects but was not retained because of its low speed capacities (time of sample heating and long analysis).
To reach the requirements of the method, we decided to develop a vision machine which couples transmitography and reflectometry. The transmitography enables the detection of crossing defects thanks to a backlight system and a high-resolution camera. The reflectometry system, in darkfields conditions (achieved using an annular lighting system) enables the detection of Ag/CMX glass layer interface defects. The
prototype developed is presented in Figure 6.
The camera used is an Illunis 30MP i (6576 ⇥ 4384 pixels)
Fig. 6. Photograph of the detection prototype
visible camera equipped with a telecentric lens to minimize the distortions. This configuration leads to a projection of the pixel on the OSR of 10 µm. The annular lighting system is an Effilux LED ring, which emits an almost monochromatic red light of 2.5W power for the reflection method. Monochromatic light minimizes the refraction at the defect edges. The backlight system is a 50 ⇥ 50mm2Effilux square red diffused light to
perform the transmission method. Performances are evaluated in the next part.
IV. EVALUATION OF THE PERFORMANCES OF THE MACHINE
The evaluation of the prototype is separated into two steps. The first is meant to test the capability of the prototype com-pared to an operator doing the current control on a unknown set of OSR. The second compares the results provided by the prototype to the results obtained on a transmission microscope. A. Control performances of the prototype
A set of 98 unused OSR was observed by an operator, who decided if the OSR should be scrapped or not. After each visual inspection, the OSR was installed in the developed prototype and the inspection was performed. On this set, the same decision was taken in 82.5% of the cases, which is a very good result for this kind of inspection.
Analysing the mismatch cases, 11 were considered as valid by the operator and invalid by the prototype. Those cases corresponded to defects located near the border of the OSR. In this case, the operator is blinded by the surrounding lighting whereas the prototype is able successfully to detect the defect, even for those areas. The prototype is thus more rigorous than
TABLE IV. COMPARISON OF THE DIMENSIONS PROVIDED BY THE PROTOTYPE AND TRANSMISSION MICROSCOPE
Prototype dimensions (µm) defect Type Optical
microscopy dimensions (µm)
Transmission
mode Reflection mode Scratch Width 1 1.15 37 -Scratch Width 2 3.48 50 42 Scratch Width 3 5.95 - 80 Scratch Width 4 1.67 52 43 Scratch Width 5 2.72 - 55 Scratch Width 6 2.04 - 21 Scratch Length 1 46.79 - 74 Scratch Width 7 1.2 36 57 Pinhole Radius 1 23.91 49 -Pinhole Radius 2 20.88 45 -Pinhole Radius 3 107.64 123
-the operator, but this quality is interesting for those critical defects, which are possible sources of general oxidations and premature ageing of the OSR.
Other mismatch cases (6) were those defined as valid by the prototype and invalid by the operator. For those cases, either the size of the pinholes were smaller than the resolution of the prototype, or their shapes were not circular (i.e. elliptical or rectangular), thus leading to detection failure. For the first case, a more defined camera should solve this detection problem. For the second case, a more robust detection algorithm would achieve the detection of non-circular shapes.
To conclude, this evaluation showed very good results for the prototype compared to the operator control, with a high correlation between the two controls.
B. Measurement performances of the prototype
This test aims to give an overview of the measuring pos-sibilities of the prototype. On a set of 12 calibrated OSR, the population of defects were localized and identified by optical transmission microscopy. 8 scratches were found and 3 pinholes. Their dimensions are shown in Table IV.
The dimensions of the scratch widths are very consistent with Table I, between 1 and 10 µm. These dimensions are compara-ble with the resolution of the prototype, so a real measurement is impossible. Indeed, this width is largely overestimated by the prototype. For dimensions higher than 40 µm, the difference in results between the two methods are less significant. To illustrate these two behaviours, the dimensions retrieved by the prototype are plotted versus the microscopy dimensions, and represented in Figure 7 :
In this figure, two populations are present. The first is located around the resolution of the prototype (minimum size detection). Then, for real dimensions lower than 20µm, the prototype measures at least 20 µm. The eventual local saturation can induce overflows on the neighbouring pixels, which favours overestimation of the dimensions.
On the other hand, after 20 µm of defect dimensions, the cor-relation is almost linear. The overestimation of the prototype may be due to local saturation or an approximate scaling factor. However, the capacity of the prototype to perform dimension measurements above 20µm is demonstrated.
Fig. 7. Cross correlation of microscopy results and the prototype
To conclude, the prototype has shown very good initial capa-bilities. It can already be used to replace the operator’s visual control and its performances for the dimension measurement are very encouraging.
CONCLUSION
This article addresses the problem of the automatic detection of microscopic defects on optical components called OSR. This application leads to the replacement of the actual visual inspection by a faster, more reliable and robust control. In the first section, the definition of the requirements of the method is provided. Considering the dimensions of the defects measured by optical transmission microscopy (inferior to 100 µm), and their possible localization, the optical method selected needed to show a very good spatial definition, high speed characteristics and a comparatively low cost. It must at least exhibit the same performances as then current visual control.
The second section is devoted to the dimensioning of the machine, based on the optical characterization of the OSR and its sub-layers. The CMX glass sub-layer confers good mechanical rigidity to the OSR and good thermal emissivity. The Ag sublayer enables good solar reflectivity. Alternating dark-field reflectography and transmitography, the majority of the defects (except the volume ones) could be detected. The third part presents the performances of the final prototype which associates dark field reflectography and transmitogra-phy. Its performances were evaluated on two experiments: one with an unused set of 98 unknown OSR to test the production capacity and the other one on 12 “defect-calibrated” OSR, to test the measurement capacity. The results are promising: the first experiment proved that the prototype can effectively replace the actual visual inspection. The second revealed good measurement capacities for defect dimensions higher that 20 µm, i.e. higher than the prototype’s resolution.
To conclude, this complete dimensioning leads to a rational choice of the method for the automatic detection of defects on OSR. Moreover, the fine knowledge of optical properties makes it possible to determine which method and spectral domain address which surface, interface or volume of the
multilayer component. This study has led to the development of a semi-industrial prototype, whose performances are very satisfactory.
The improvement of the prototype can be achieved using a camera with a higher definition and developing a more robust detection algorithm. However, a more fundamental study should be performed to identify which defects, and in which localization (surface, interface, volume), are the most critical for the thermal regulation properties of the OSR. To do so, the sorting phase would need to be rationalized, and important savings could be achieved by reducing the rejection rate. Finally, a fine chemical study of the OSR’ oxidation and its influence on optical properties would allow a complete understanding of the OSR’s ageing process.
ACKNOWLEDGMENT
The R&D project OSRAS, winner of the AEROSAT call for papers, is funded by the French government via the FNADT. We thank the OSRAS partners (Airbus D&S, MAP Coatings, Alci and Mines Albi) for their help and contribution to this project.
REFERENCES
[1] OSR Technical Datasheet, http://www.qioptiq.com/space.html, Accessed: 2016-06-08
[2] U.S. Department of Defense, Mil-PRF-13830B, 1963
[3] David M. Aikens, The Truth About Scratch And Dig, International Optical Design Conference and Optical Fabrication and Testing, Interna-tional Optical Design Conference and Optical Fabrication and Testing, , Optical Society of America, 2010
[4] A. Bendada and S. Sfarra and M. Genest and D. Paoletti and S. Rott and E. Talmy and C. Ibarra-Castanedo and X. Maldague, How to reveal subsurface defects in Kevlar composite materials after an impact loading using infrared vision and optical {NDT} techniques?, Engineering Fracture Mechanics, vol.108, pp.195 - 208, 2013 [5] M.S. Benmoussat and M. Guillaume and Y. Caulier and K. Spinnler,
Automatic metal parts inspection: Use of thermographic images and anomaly detection algorithms, Infrared Physics And Technology, vol. 61, pp. 68 - 80, 2013
[6] J. Bushell and P. Sherlock and P. Mummery and B. Bellin and F. Zacchia, An investigation of pulsed phase thermography for detection of disbonds in HIP-bonded beryllium tiles in {ITER} normal heat flux first wall (NHF FW) components, Fusion Engineering and Design, vol. 98-99, pp. 1244 - 1249, 2015
[7] Bray, D. E. and McBride, D., Nondestructive testing techniques, NASA STI/Recon Technical Report A, vol. 93, 1992
[8] E.R. Fotsing and A. Ross and Edu Ruiz, Characterization of surface de-fects on composite sandwich materials based on deflectrometry, {NDT} And E International, vol. 62, pp. 29 - 39, 2014
[9] Min Su Kim and Hyeun-Seok Choi and Seung Hee Lee and Chanjoong Kim, A high-speed particle-detection in a large area using line-laser light scattering, Current Applied Physics, vol. 15, num. 8, pp. 930 - 937, 2015 [10] Mix, Paul E., Magnetic Particle Testing,John Wiley And Sons, Inc., pp.
247-299,2005
[11] Nikolay Nazaryan and Claudio Campana and Saeid Moslehpour and Devdas Shetty, Application of a He3Ne infrared laser source for detection of geometrical dimensions of cracks and scratches on finished surfaces of metals, Optics and Lasers in Engineering, vol. 51, number 12, pp. 1360 - 1367, 2013
[12] R.V. Rao and K.C. More, Optimal design of the heat pipe using TLBO (teaching-learning-based optimization) algorithm, Energy, vol. 80, pp. 535 - 544, 2015
[13] Vincent Revol and Bernhard Plank and Rolf Kaufmann and Johann Kastner and Christian Kottler and Antonia Neels, Laminate fibre structure characterisation of carbon fibre-reinforced polymers by X-ray scatter dark field imaging with a grating interferometer, {NDT} And E International, vol. 58, pp. 64 - 71, 2013.
[14] V.Y. Senyurek, Detection of cuts and impact damage at the aircraft wing slat by using Lamb wave method, Measurement, vol. 67, pp. 10 - 23, 2015
[15] Marco Seeland and Roland Rsch and Burhan Muhsin and Gerhard Gobsch and Harald Hoppe, Electroluminescence as Characterization Tool for Polymer Solar Cells and Modules, Energy Procedia, vol. 31, pp. 167 - 172, 2012
[16] Sierra, G and Guillaumon, O. and Sacramento, D., Development of a Specific OSR Automated Bonding Process, Proceedings of ISMSE-12 : 12th International Symposium on Materials in the Space Environment, 2013
[17] Sills, Ken and Bone, Gary M. and Capson, David, Defect identification on specular machined surfaces, Machine Vision and Applications, vol. 25, number 2, pp. 377–388, 2013
[18] SMIGIELSKI, Paul, Holographie optique Interfromtrie holographique, Techniques de l’ingnieur Mtrologie optique et photonique, 2014 [19] Trupke, T. and Bardos, R. A. and Schubert, M. C. and Warta, W.,
Photoluminescence imaging of silicon wafers, Applied Physics Letters, vol. 89, number 4, 2006