Titre:
Title:
Economic Assessment of Rural District Heating by Bio-Steam
Supplied by a Paper Mill in Canada
Auteurs:
Authors:
Mariya Marinova, Catherine Beaudry, Abdelaziz Taoussi, Martin
Trepanier et Jean Paris
Date: 2008
Référence:
Citation
:
Marinova, Mariya, Beaudry, Catherine, Taoussi, Abdelaziz, Trepanier, Martin et Paris, Jean (2008). Economic Assessment of Rural District Heating by Bio-Steam Supplied by a Paper Mill in Canada. Bulletin of Science, Technology & Society, 28(2), p. 159-173. doi:10.1177/0270467607313953
Document en libre accès dans PolyPublie
Open Access document in PolyPublieURL de PolyPublie:
PolyPublie URL: http://publications.polymtl.ca/2297/
Version: Version finale avant publication / Accepted versionRévisé par les pairs / Refereed Conditions d’utilisation:
Terms of Use: CC BY-NC-ND
Document publié chez l’éditeur commercial
Document issued by the commercial publisher Titre de la revue:
Journal Title: Bulletin of Science, Technology & Society Maison d’édition:
Publisher: SAGE URL officiel:
Official URL: http://dx.doi.org/10.1177/0270467607313953 Mention légale:
Legal notice: When posting or re-using the article please provide a link to the appropriate DOI for the published version of the article on SAGE Journals (http://online.sagepub.com)
Ce fichier a été téléchargé à partir de PolyPublie, le dépôt institutionnel de Polytechnique Montréal
Economic assessment of rural district
heating by bio-steam supplied by a
paper mill in Canada
Mariya Marinova Catherine Beaudry*
Abdelaziz Taoussi Martin Trépanier Jean Paris
École Polytechnique de Montréal
The feasibility of implementing district heating in a small town adjacent to a kraft pulp mill in Eastern Canada has been investigated. A detailed heat demand analysis was performed for all buildings using a Geographical Information System and archived data provided by the municipality. It was first shown that the total space heating requirement of the town could be supplied by exportable steam produced by the mill from forest biomass even during exceptional peak demands. However a screening test based on load density indicators revealed that a district heating serving the entire town would probably not be economically viable. Partial districts incorporating zones of relatively high load density were subsequently developed by sectorial analysis. The economics of selected partial districts were subsequently assessed by preliminary engineering cost estimating methods. It was found that a district covering about half of the town could be economically viable with the proper balance between the price of the steam sold by the
mill to the district operator and the cost of the energy sold to the customers. A government incentive program assisting the district operator or the building owners who must assume the installation of new heating systems would definitely increase the chance of success of the district.
Keywords: district heating, economic assessment, industry-based district heating, demand
analysis, eco-industrial cluster, sustainable development, bio steam
Introduction
The term district heating refers to the distribution of thermal energy generated by a single power plant to a group of buildings that can be residential, commercial, industrial or institutional. The energy supplied to buildings is primarily used for space heating but can also be used for domestic hot water pre-heating and, increasingly, for air conditioning by adding a heat pump to the power plant [ASHRAE, 2000]. The advantage of district heating over single building systems is the higher efficiency of a large power plant over small individual systems. It can be particularly advantageous for dense urban districts where heat losses in the distribution network are small. However, there are also successful district heating systems in low density zones. As an example, one can cite the system serving the small community of Oujé-Bougoumou, in northern Quebec [Canadian District Energy Association, 2007].
The thermal energy required by the district is often supplied by a dedicated power plant but excess or waste energy from an industrial site can be an attractive alternative because depreciation and maintenance costs for the power plant are then shared [Trygg et al.,
used by district power plants [Holmgren, 2006]. More recently, mixed systems incorporating renewable or alternative energy production and conversion technologies have entered the field: solar collectors, heat pumps, polygeneration, seasonal heat storage, and now, biomass [Philibert, 2005].
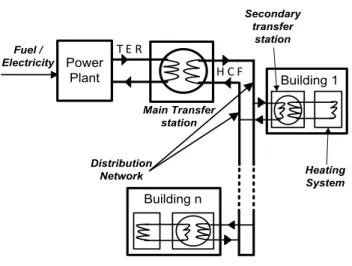
The general structure of a district heating systems consists of the following components (Figure 1):
• A power plant which produces the district thermal energy requirement (TER) by converting into heat, generally in the form of steam, the energy content of fuel, electricity or other primary sources of energy;
• A main transfer station in which the TER is transferred to a heat carrying fluid (HCF) such as hot water. The main transfer station will typically incorporate a steam to water heat exchanger, pumps to circulate the HTF and a data acquisition and control console;
• A distribution network through which the HCF is delivered to the individual customers, i.e. the buildings to be heated by heat purchased from the district;
• Each consumer is connected to the distribution network by a secondary transfer station in which heat is transferred from the HCF to the building’s heating system. This system utilizes water or air as the heating medium and the transfer station consists of a small water-to-water or water-to-air heat exchanger replacing the
conventional equipment such as fired or electrical furnaces and distributed electrical radiators.
Three main economic factors must be considered in the feasibility analysis of a district heating implementation: the cost of producing the TER, the heat distribution network cost which depends largely on the district heat load density, and the investment required for the customer connections. The latter will be less of a burden if the district heating system is designed and built at the same time as the site is developed than if it is retrofitted in a fully developed site. In the first instance, the buildings can be equipped with appropriate compatible units at the construction stage.
Power Plant T E R Main Transfer station Distribution Network H C F Building 1 Fuel / Electricity Heating System Secondary transfer station Building n
Figure 1. Schematic representation of a district heating network.
The case study presented in this paper assesses the economic viability of the use of the excess steam production capacity of a kraft pulp mill to supply the space heating requirement of its small adjacent town. This 2 500 inhabitants town is typical of small single industry towns in Eastern Canada (the forestry sector in this case, consisting of a
kraft mill and a saw mill). Although the TER can be supplied by the mill at a relatively low cost, the challenges of this type of district clearly are the low demand density and the retrofitting installation of compatible heating systems in existing buildings to be connected. Those issues are examined later in the paper.
Survey of current developments
This review first presents an overall assessment of district heating installations worldwide and in its second part focuses on R&D work on the TER supply by industrial plants, the design of the distribution network and economic issues.
Existing networks
District heating systems are not new and have been used in Europe since the 14th century,
with one system in France in continuous operation (Chaudes-Aigues thermal station) [Lemale and Jaudin, 1998]. In North America; the first system reported was constructed by the U. S. Naval Academy on the Annapolis campus in 1853, and the first commercial network was installed in Lockport (NY) in 1877 [IDEA, 2007]. In Canada the first system was developed in 1924 in Winnipeg’s commercial core [Enwave, 2007].
Todays, northern European countries are leaders in the field. In 2000, Sweden had an installed district heating capacity of 40 TWh, which represents more than 50% of the total heating capacity of the country [Gebremedhin, 2003]. In Latvia and Lituania, the percentage of district-heated homes is about 65%. The presence of such systems is related to the nature of the heating energy supply. In Norway, an oil and hydroelectricity producer, the percentage drops under 10% [Pavlas et al., 2006].
The town of Borlänge (Sweden) has had a district heating system for more than thirty years, covering 90% of apartment blocks and 28% of single-family houses. Heat pumps provide 71% of the heat and 25% is generated from municipal incinerators [Gebremedhin, 2003]. In 1984, the town of Falun (Sweden) built a district heating system connecting more than 60% of apartment blocks and 4% of single-family houses to its network. A cogeneration plant built in 1993 provides 8 MW of electricity and 30 MW of heat [Gebremedhin, 2003]. Several sources of energy are used to generate steam or hot water for district heating purposes. Eriksson et al. (2007) report that for the year 2000, wood fuel (28%) and domestic waste (11%) are important sources in Sweden, while the use of fossil fuels (oil, coal, natural gas) is less than 15%. Other sources include waste heat from industrial plants (7%), electrical boilers and electrically driven heat pumps (19%), tall oil pitch (3%) and biogas (1%).
There is a growing interest on new energy sources. Direct-use of geothermal energy for heating had a 10% annual increase of installations during the past 30 years [Lund, 2006]. The locations using this type of energy source are found in Europe (49% of world capacity installed), Asia (29%) and the Americas (17%). According to Ozgener et al. (2007), new installations in Turkey represent 12% of the world’s capacity. Comprising of wood chips, wood waste and peat moss, natural biomass is now attracting a great deal of interest in the literature as a source of energy for district heating. Keppo and Savola (2007) have studied biomass use for small district heating and electricity generation systems. Biomass is less expensive that natural gas and other fossil fuels for heating purposes [Eriksson et al., 2007].
In Canada, less than 7% of the heating capacity is provided by district heating [Natural Resources Canada, 2005]. This situation can be attributed in part to a traditionally low cost energy supply from hydroelectricity and fossil fuels but also to the dispersion of a small population across a vast territory. Approximately 80 district heating networks are currently in operation in Canada, providing a total capacity of 1 730 MW [Canadian District Energy Association, 2007]; the most important are listed in Table 1. These major networks are servicing large non-residential buildings in urban core areas and use steam as HCF. It is expected that a district heating system will be installed at the 2010 Winter Olympics in Vancouver [Vancouver 2010 Organizing Committee, 2007].
Table 1. Major Canadian Steam Networks [CDEA, 2007].
Name Capacity (MW)
Toronto District 276
Central Heat Distribution, Vancouver 232
University of Toronto 195
Corp. de Chauffage Urbain, Montréal 100
Five Canadian networks use biomass energy systems: Charlottetown (Prince Edward Island), Chapais (Quebec), Ouje-Bougoumou Cree community (Quebec), Williams Lake (British Columbia) and Ajax (Ontario). The other districts use natural gas, propane, fuel oil and electricity for steam production.
Table 2. New district heating surface created in 2003 and 2006 [IDEA, 2007].
Building Type
Floor area (103 m2)
2003 2006
USA Canada USA Canada
Office & Com. 3 600 3 200 6 700 3 800
Industrial 2 600 800 1 300 Institutional 12 600 7 500 4 600 5 300 Hotels 1 600 1 100 1 800 1 700 Residential 2 200 1 100 3 400 300 Other 6 200 200 300 Total 26 600 5 400 17 500 12 400
The number of installations is expected to increase in coming years. Table 2 highlights the expansion of this sector in the United States and Canada. It shows that residential heating is still relatively rare. The area serviced by district heating is increasing faster in Canada that in USA [IDEA, 2007], but there are important projects in progress in that country such as, for example, the downtown district heating project in Montpellier, Vermont [City of Montpellier, 2006].
Supply of district demand by industrial plants
Industrial plants can supply the heating requirement of nearby towns when there is a large amount of heat at an appropriate temperature level which is released in the environment, or where unused power plant production capacity becomes available following the execution of a process energy efficiency improvement program. For example, a part of the energy produced by the OMV refinery in Vienna (Austria) is used to heat 19 000 homes and 400 industrial buildings [Euroheat, 2007]. In 2000, in Sweden, the
contribution of industry accounted for 3.5 TWh, which is about 9% of the total heating capacity of the country. Collaboration between industries and regional governments for the promotion of district heating are currently envisaged in a number of projects. Klugman et al. (2006) studied various perspectives of regional cooperation with an integrated chemical pulp and paper plant in Sweden. Ajah et al. (2007) examined the possibility of using low-level residual pharmaceutical waste heat for a district heating system in Delft (Netherlands). Gebremedhin (2003) studied the nature of collaborations and partnerships between various players in two different cities, Borlänge and Falun, with the aim of evaluating the impact of the pulp and paper industry implication in district heating projects to reduce the cost of electricity in Sweden. The district heating operators are required to pay considerable sums in energy tax depending on the type of fuel they use to produce heat. This tax is reduced by 50% if heat is generated by a combined heat and power plant (CHP). Heat production from biomass is also exempted from this tax.
Economic viability and relevance
Several studies on the economic assessment of district heating have been reported. Keppo and Savola (2007) found that, compared to the long term average situation in the Nordic countries, higher electricity prices or lower investment costs are needed to make CHP plants attractive in small district heating networks. Holmgren and Amiri (2007) emphasize the importance of external costs due to environmental effects. This aspect of the problem is rarely taken into account in economic models. Curti et al. (2000) propose a model that simultaneously considers economic and environment parameters. Agrell and Bogetoft (2005) insist on the necessity to involve local governments in the economic
appraisal of district heating to ensure financing and sustainability of the systems. According to the authors, government action through regulations can have significatively more impact than managerial performance on district heating benefits.
Studies were done to shed light on the environmental relevance of a district heating network project. For example, Marletta and Sicurella (2002) gathered data available on a portion of the 300 km Brescia network in Italy, and carried out an economic comparison with an equivalent system based on domestic gas boilers. It has shown that the district heating system recovers in a few years the energy costs needed to manufacture the various equipments and parts of the installation of the distribution network, plus all the relative environmental considerations. However, there remains a concern about air quality when using biomass and waste in district heating plants, especially for particulate emissions [Wierzbicka et al., 2005].
The cost of delivering the heat from the power plant to the customers is an important factor in the overall economic viability of district heating. Network parameters such as temperature of supply and return, power plant efficiency and heat losses influence the cost [Zsebik and Sitku, 2001]. Ways to increase the cost effectiveness of distribution networks such as the use of a network for air-conditioning have been suggested. Dynamic energy storage combined with demand-side management can help meet demand in peak periods. Trials were performed in a district heating system in Naestved (Denmark) to store steam in the network as backup in case of a breakdown in the cogeneration system. Also tests were performed on the district heating system of
Jyväskylä (Finland) to verify the possibility to avoid recourse to expensive fuels during the morning peak hours [Wigbels et al., 2005].
Case study
The power plant of the proposed district heating system would be the installed steam productions facility of a kraft pulping mill, and the customers would be the occupants of the buildings in the small town adjacent to the mill. The main transfer station and the distribution network would be managed by a separate entity, the district operator, which would buy the TER from the mill and sell heat (as hot water) to the customers. Each building owner would own the secondary transfer station installed on his property and which services his building. The ownership and management structure of the district is illustrated in Figure 2. The economic viability of the district is assessed from the perspective of the three participants to the project, the mill, the district operator and the customers later in the paper. In this section the context of the project and its technical feasibility, i.e. the balance between demand and supply, will first be presented. Following a preliminary economic analysis, the justification of a selective approach to the design of the distribution network will conclude the section.
Kraft Mill Power Plant District Operator Main Transfer Station Distribution Network Steam Hot water Customer Secondary Transfer Station Heating System Hot water Hot water
Figure 2. Ownership and management structure of the district.
The Mill
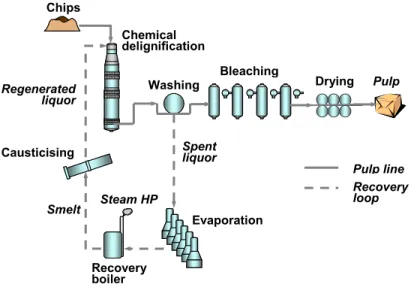
The kraft pulping process is the prevalent manufacturing process, on a world scale, by which wood chips are reduced to paper pulp, the intermediate material from which a very broad spectrum of finished or semi-finished products generically designated as paper products, are made. The core of the kraft process is a chemical delignification step in which the individual cellulosic fibers are separated to form the pulp. A key characteristic of the kraft process is that the spent delignification liquor is concentrated and burnt to utilize its energetic content (sulfonated lignin and other organic components of the wood) and recover the spent reactants which are regenerated [Smook, 2002]. The resulting complex chemical process is illustrated in Figure 3.
Chips
Chemical delignification
Washing Bleaching Drying Pulp
Evaporation
Recovery boiler
Causticising Spent liquor
Steam HP Smelt Regenerated liquor Pulp line Recovery loop
Figure 3. Schematic of the kraft process.
A large fraction of the thermal energy required for the various process operations is produced in a recovery boiler where the spent liquor is burnt. Additional heat is produced by burning bark and other wood residues and also, sometimes, by a back-up fossil fuel boiler. Wood residue and the combustible components of the spent liquor are both fuels derived from renewable forest biomass. The kraft process can therefore be almost totally biomass-based, i.e. for its main raw material and its energy requirement; only some reactants and additives remain petroleum based. In the mill considered, there is still a small back-up bunker oil boiler. Key data on the mill power plant are given in Table 3.
Table 3. Heat production by the mill (yearly averages).
106 GJ/a %
From spent liquor 3.82 64.3 From wood residues 1.57 26.4 From bunker oil 0.55 9.3
The steam produced is primarily used for process requirements (average yearly consumption: 5.63 106 GJ, varying by about 10% between summer and winter); a small
fraction is used for services (4.53 104 GJ/a) and an additional amount is sold to the saw
mill (1.83 105 GJ/a). The mill purchases its chips from this and other regional saw mills.
An in depth energy efficiency analysis in progress has shown that the steam consumption of the pulping process could be reduced by at least 1.10 106 GJ/a, and probably more, by
means of engineering optimization measures [Mateos-Espejel et al., 2007a, 2007b]. A progressive implementation program is being prepared. The main benefit of this program for the mill would be the permanent shutdown of the bunker oil boiler thus realizing a substantial saving in fuel cost. This would still leave an excess steam production capacity of 0.62 106 GJ/a by the then totally biomass-based mill power plant. This steam could be used to supply the heat demand of the district, should it be in sufficient amount. It will be shown later that the mill could indeed export enough steam to satisfy the heating demand of the town.
The district
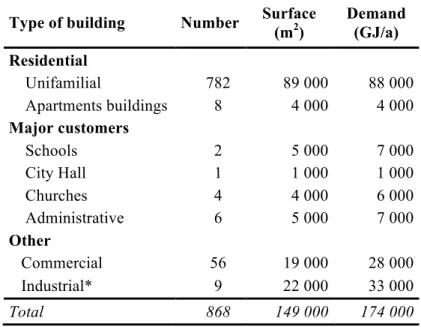
The town constituting the district is almost totally located in a sector of 155 degree angle and 1.8 km radius with the mill located at its apex (Figure 4). A detailed databank was created using a Geographical Information System (GIS) and non proprietary information from the 2005 Municipal Property Assessment Role and a Fire Department Inspection Report executed in 2006, both communicated by the municipality. The databank contains location, type, usage, and size of each building, type of heating systems installed and the total annual electrical energy consumption [Alao et al., 2007a]. The total annual thermal
energy required for space heating of each type of building and by unit surface area has been estimated on the basis of a national survey and the results are summarized in Table 4. Space heating requirements for residential buildings in Eastern Canada range from 0.6 to 0.9 GJ/m2a, depending on the construction date. For commercial buildings, a
value of 1.02 GJ/m2a is used [Natural Resources Canada, 2005]. The last column of the
table present the TER required by the main transfer station and includes an average value of 75% efficiency for the building heating systems and 8.6% losses in the piping network [Çomakli et al., 2004].
The monthly distribution of the total heating demand for the district has been estimated by means of a correlation of heating demand versus hourly outdoor temperature in Eastern Canada compiled by Environment Canada (2005). A linear correlation validated with data from a smaller comparable survey by Hydro-Quebec was assumed to apply to the district. The maximum heating demand occurs in January and represents approximately 35 000 GJ, that is 20% of the annual demand. Results are significantly different from those of a previous preliminary study of the district [Alao et al., 2007a] because they are based on more precise heating requirement estimates and complementary information on commercial buildings. Also, the efficiencies of heating units were not taken into account in the previous study.
Figure 4. District Plan.
Table 4. District space heating energy requirement (estimated annual).
Type of building Number Surface
(m2) Demand (GJ/a) Residential Unifamilial 782 89 000 88 000 Apartments buildings 8 4 000 4 000 Major customers Schools 2 5 000 7 000 City Hall 1 1 000 1 000 Churches 4 4 000 6 000 Administrative 6 5 000 7 000 Other Commercial 56 19 000 28 000 Industrial* 9 22 000 33 000 Total 868 149 000 174 000
Technical feasibility
Once the energy efficiency program has been implemented and the bunker oil boiler shut-down, the installed bio-steam producing capacity of the mill, i.e. the recovery and the wood residue boilers, will still be able to deliver 52 000 GJ per month above the mill requirements for the pulp manufacturing process, services and current sales. This energy will be available as high pressure steam (3 100 kPa, 370 °C, 2.14 GJ/t as released heat by isobaric cooling and condensation).
The TER to be supplied to the primary transfer station for the month of January will be about 35 000 GJ. This leaves a safety margin of 17 000 GJ to compensate for the demand estimation uncertainty (probably no more than a few percent), to face occasional extreme weather, and to absorb a healthy development of the town.
A constraint of the integration of the mill into the district heating is that, in case of a temporary shutdown of the mill, and of the process-dependant recovery boiler, the wood residue boiler should remain in operation. It is likely that the same constraint would apply to its service function and for the sale of steam to the saw mill.
The cost of producing high pressure steam from wood residue has been estimated by the mill at 3.3 $/t [Alao et al., 2007a]∗. For the purpose of this study, the price of steam sold
to the distribution network operator has been fixed at 10 $/t, at the gate of the mill, i.e. 4.67 $/GJ. This price, while it is reasonable and would provide a modest but steady
income to the mill, is very advantageous when compared to other sources of primary energy. As a result of global energy market pressures, the wood chips market is getting tighter and prices are increasing; the steam sale price of 10 $/t should nevertheless remain interesting for the mill for some time.
It is interesting to note that this project constitutes for the mill an additional important step into the creation of a sustainable eco-industrial cluster. Presently the mill supplies steam to a near-by saw mill as already mentioned, it also treats the municipal wastes in its effluent treatment plant and is envisaging the installation of a cogeneration unit that would supply power to the grid. Its integration to the district heating system as supplier of the TER would complete a very advanced cluster as illustrated in Figure 5.
Power Plant Process & services Cogeneration Effluents treatment plant Grid LP Steam HP Steam Steam Effluents Power Treated water to environment
Mill
Saw Mill District Exported steam Municipal waste LP Steam PulpPreliminary economic assessment
There are few data published in the scientific literature on the investment and operating costs of district heating on which to base an early, pre-engineering economic assessment. Since the heat demand for space heating in the envisaged district is well documented and in great details, the search was focused on demand-oriented methods. Guidelines based on total power load per serviced surface area (MW/km2) were first developed in the
context of the Icelandic experience with geothermal district heating [Karlsson, 1982] and are summarized in Table 5. Nargot (1985, 1986) proposed later economic viability thresholds per surface area and per length of distribution network (40 MW/km2 and 4 MW/km); those indicators were presumably developed for dense city districts in Europe and the surface load density is similar to the corresponding value given in Table 5. A value of 16 MW/km2 was computed for a university campus heating district in Turkey on the basis of total demand and was considered as economically feasible [Yildirim et al., 2006]. Furthermore, it is not known whether domestic hot water pre-heating which would significantly increase demand density is taken into account in those indicators. It can be assumed, however, that government incentives are not considered by those indicators. Table 5. Favorability for district heating based on thermal load density [Karlsson, 1982].
Favourability Load dens.
(MW/km2) Type of land-use
Very favourable > 70 Downtown; high rises Favourable 51-70 Downtown; multi-storied
Possible 20-51 City core
Questionable 12-20 Two-family residential Not possible < 12 Single-family residential
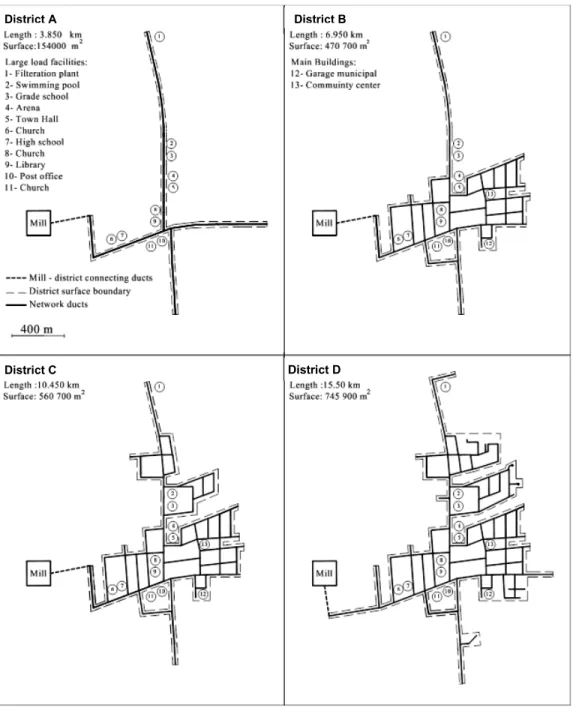
Using the GIS tool a layout of a distribution network covering the totality of the district has been designed, its total length has been estimated at 15.5 km covering a total area of 0.8 km2 (Figure 6). The load density values from other sources presented early are based
on the total demand which determine the revenue of the district operator. However, the maximum demand determines the investment of the distribution network. It was therefore considered appropriate for the purpose of this work to compute both values. The heat load linear densities for the total district are 0.3 and 1.0 MW/km for total and peak demand respectively, the corresponding heat load surface densities are 6.8 and 19.8 MW/km2. These values are in the “Questionable” to “Not possible” ranges given in Table 5. It can be expected that the installed and operating costs of a network in rural Canada would be significantly lower than in urban Europe, however it is doubtful that this factor alone would compensate the effect of the low demand densities.
Moreover, an important characteristic of the district is that the heating demand is unevenly distributed on its territory since it is a mixture of commercial streets with close clusters of buildings and small apartment blocks, of large buildings such as schools, arena and administrative buildings, characterized by high space heating demand, and at the other extreme, of single-family bungalows on spacious lots. It was therefore decided to examine the economic viability of a partial heating district based on adjacent zones of higher demand density.
The next section presents the sectorial analysis which was performed. Using the results from this analysis, a selective, partial network was selected and its economic viability assessed on the basis of preliminary engineering data. The other potentially critical issue
is the cost to customers of the retrofit installation of compatible heating systems and connection to the distribution network is also examined.
Sectorial analysis
The town is dominated by two main streets which form a cross with the long branch oriented in the N-S direction and the short one in the E-W direction (Figure 4). Most of the commercial buildings (42 out of 61) are located on these two streets as well as large public buildings with high space heating demands: the two schools, the arena, the city hall and several others. The residential neighbourhoods are adjacent to these two main streets primarily in the N-W sector formed by the cross. The decision was made, on the basis of this observation, to investigate the economic viability of districts branching out from these two streets into adjoining neighbourhoods but only to a limited extent to maintain a high enough demand density. Four district designs of increasing area have been considered (Figure 6):
• District A: limited to the two main streets truncated at both ends and linked to the mill via the side street closest to the mill boundary as a base case;
• District B: constituted of district A plus some side streets located in angles formed by the two main streets;
• District C: constituted of district B plus some side streets further north along the main cross branch;
District A District B
District C District D District C
Figure 6. Evaluated districts A, B, C and D.
The linear and surface load densities were computed for the four sectorial districts using a peak demand estimated at 100 W/m2 of heated surface (typical maximum heat load
requirement in Canada). It was assumed for computational purpose that the piping network follows the street centerlines and that connections to the buildings will be contained within a 20 m band on each side. The results are given in Table 6.
Table 6. Main characteristics of the four districts.
Characteristics Districts
A B C D
Number of buildings 263 602 772 868
Total heated surface (m2) 68 000 118 000 138 000 149 000
Space heating requirement (GJ/a) 81 000 133 000 151 000 160 000 Network requirement (GJ/a) 88 000 144 000 164 000 174 000
Network length (km) 3.9 7.0 10.5 15.5
Network surface (km2) 0.2 0.5 0.6 0.8
Heat load for total demand (MW) 2.6 4.2 4.8 5.1
Linear density (total MW/km) 0.7 0.6 0.5 0.3
Surface density (total MW/km2) 17.1 8.9 8.5 6.8
Heat load for max. demand (MW) 6.8 11.8 13.8 14.9
Linear density (peak MW/km) 1.8 1.7 1.3 1.0
Surface density (peak MW/km2) 45.3 25.0 24.7 19.8
The heat load densities for the total demand can be assessed by comparison to values from the literature given earlier. The surface density for sector A is at the limit between “Possible” and “Questionable” in Table 6 but it is slightly superior to the density of a university district heating systems in Turkey which was deemed worthy of further evaluation. The other three sectors have surface density values in the “Not possible” category. The linear densities are well below the threshold of economic viability proposed by Narjot (1986) in all cases. Considering that this case study probably has a significant advantage over other low density networks, thanks to its low primary energy cost, it was therefore decided to proceed with a more detailed economic analysis for
districts A, B and C to assess the economic viability of partial networks and to establish benchmarks.
Economic analysis
Basis for analysis
The simple payback time (PBT) will be used to further assess the economic prospect of implementing district heating in each of the three partial districts previously defined, alternatively. The price of the high pressure steam sold by the mill to the district operator will be kept at 10 $/t, i.e. 4.67 $/GJ, without consideration to the price of heat sold by the operator to its customers. Since there is an 8.6% heat loss in the distribution network, the steam purchased from the mill will account for 5.07 $/GJ of the price of the heat sold to the consumers. This establishes the absolute lower limit of the sales price range of heat to the customer.
On the other hand, in order to offer an incentive to the property owners of the town to switch from their current heating system to the district, the heat must be sold by the district at an advantageous price by comparison to other available energy sources. Cost figures for 2006 provided by energy suppliers in the Montreal region are given in Table 7. The effective energy costs given in the table provide an upper bound to the sales price of heat to the consumers. Naturally, higher energy sales prices are advantageous to the district operator but adverse to the consumer and vice versa.
In order to determine the impact of the heat sales price on the overall economics of the district three pricing scenarios bracketed by those upper and lower limits have been
Table 7. Effective Heating Energy Cost.
Energy
Source Unit Cost Heat Content
Price ($/GJ) HSE (%) Eff. C. ($/GJ) 7a. Currently available sources
Electricity R 0.074$/kWhe- 3.6 MJ/kWhe- 20.55 100a 20.55
Electricity NR 0.088$/kWhe- 3.6 MJ/ kWhe- 24.40 100a 24.40
Oil 0.76$/L 38 MJ/L 20.00 78 25.64
Wood 55$/m3 5200 MJ/m3 10.70 55 19.45
7b. Heating district scenarios
Scenario 1 10.00 75b 13.33
Scenario 2 12.00 75 16.00
Scenario 3 14.00 75 18.67
Abbreviations: HSE: Heating systems efficiency; Eff. C: Effective cost to the consumer; R: Residential; NR: Non-residential
Notes: a: Direct resistance heating; b: Overall efficiency for secondary transfer stations and water radiator heating.
The results of the economic analysis are summarized in Table10 for each district and each scenario considered. Supporting details are given below for each participant to the district heating initiative, i.e. the mill, the district operator and the customers.
Supply economics (Mill)
The mill supplies the district with the required amount of energy which it produces for 3.3 $/t (1.54 $/GJ) and sells to the operator for 10 $/t (4.67 $/GJ). It realizes a profit of 6.7$/t (3.13 $/GJ). The corresponding total annual values for each sector are presented in Table 10.
Heat distribution economics (District operator)
PBT = Investment cost/ (Revenue – Operating cost) (1)
Investment cost
The distribution system is made of two parts which contribute in a very significant way to the investment required for the implementation of a district heating of any size: the main transfer station and the distribution network (Figure 2). The main transfer station includes the following major pieces of equipment: a heat exchanger where the heat required is transferred to the hot water which circulates in the distribution network by de-superheating and condensation of the steam supplied by the mill, pumps that provide the energy to move the water in the network of pipes, and a data acquisition and control system (DACS). The exchanger, the pumps and electrical motors which entrain them were dimensioned and costed by a conventional preliminary engineering method which utilizes correlations based on key functional parameters, the surface exchange area of an exchanger and the power of a pump and drive system [Ulrich et al., 2004]. Those parameters were computed from the operating conditions of the equipment. All other costs involved with the design, installation, connection and operation of the equipment including the building in which they are located are estimated by standard multiplying factors based on correlations of actual historical data. For the DACS a fixed cost based on previous experiences was used. The precision of the method is about ±25%.
The distribution network will consist of two parallel main ducts, one for the outgoing hot water (110°C) from the main transfer station and one for the returning cooled water (90°C). The two ducts will be insulated and buried in a trench. The network will branch out into all streets forming a district. As the flow of carried water diminishes, the
diameter of sections of piping will be progressively reduced from an initial 250 mm to a final 25 mm with an average of 80 mm [Gervais et al., 2007]. The installed cost of a similar network with comparable dimensions in Sweden adjusted to 2006 was 270 000 $/km [Dahm, 2001]. This value was used in the present study with a 3% added for ancillary equipment such as sensors and signal transfer to the main station. The key investment costs for each sector are given in Table 8.
Table 8. Summary of investment and operation costs for distribution ($).
District A B C
8a. Investment
Heat exchanger 93 400 99 000 110 000
Pumps and drive 115 500 143 000 154 000
DACS 15 000 15 000 15 000
Eng., installation, structure 111 500 129 100 137 900 Total, transfer station 345 400 396 100 426 900 Distribution system 1 084 600 1 946 700 2 920 000
Total investment 1 430 000 2 342 800 3 346 900
8b. Operation
Management 130 000 130 000 130 000
Maintenance and repairs 28 600 46 800 66 900
Total operation 158 600 176 800 196 900
Operating Costs
There are three main operating costs; two are fixed and one is variable. The fixed costs are management of the district and, maintenance and repair of the equipment. The variable cost is the purchase of steam from the mill. The cost of the electricity to drive the pumps has been neglected.
It is assumed that the day-to-day management of the district will be handled by one staff reporting to a non-paid supervising body. The staff office will be in the main transfer station (10 000 $ has been included in the cost of the structure for the room, Table 8.) The operating cost of the staff office, including salary, plans and benefits and, normal expenses has been estimated at 130 000 $/a.
Maintenance and repair costs for similar installations have been estimated at 2% of the total investment per year by Vanier & Rahman (2004). This value has been used in this work. The cost of steam purchased is of course equal to the cost of steam sold by the mill.
Revenue
The district revenue is the value of heat sold to customers for each district and each tariff scenario. It must be noted that the amount of heat sold by the district to its customers is only 92.1% of the heat it buys from the mill because of heat losses in the distribution network.
Utilization economics (Customers)
It is assumed for the purpose of this analysis that all buildings in a sector, residential and non-residential, will join the district heating initiative. Furthermore, the results of the analysis are presented for the aggregate of all buildings in a district, although the analysis was done building by building using the data bank developed with the Geographic Information System. The simple payback time for the utilization side of the district as given by equation 2 is therefore an average value. The individual building payback times may vary greatly from that average value because of a number of factors such as type and age of the current heating system, type, age and size of the building:
PBT = Investment cost / Annual saving (2)
Investment costs
The changes required in each building are:
• Removal of the installed heating system and retrofit installation of a water radiator heating system. In buildings which already have a hot water heating system, the radiators would be kept but the boiler would be removed;
• Installation of a secondary transfer station (Figure 2). This station consists essentially of a water-to-water heat exchanger, of temperature and flow controls and of a pump. The heat exchanger replaces the current boiler in buildings already installed with water radiators;
• Connections to the district incoming and returning pipes.
The total investment cost for each type of building has been established by Alao (2007b); it includes materials and labor, and has been computed as a cost per unit surface of heated space. For a building with a hot water system installed, the cost of conversion and connection is 47 $/m2, and 76 $/m2 for other buildings. For commercial, it ranges from 27
$/m2 to 60 $/m2. The total investment costs for the two categories of buildings are given
in Table 9. The precision of this estimation method is probably about ±30%.
Annual savings
The saving in space heating cost that can be achieved is the difference between the current cost and the anticipated cost once the building is retrofitted with the required system and connected to the district. The current cost was based on the estimated heating
demand and the corresponding delivered energy cost for each type of energy supply given in Table 7. The anticipated district heating cost depends on the pricing scenario considered and also utilizes the delivered energy costs from Table 7. Results are summarized in Table 9.
Table 9. District heating annual savings.
District A B C
Investment ($)
For existing water systems 441 000 723 000 759 000 New system installed 3 672 000 6 675 000 8 132 000
Total 4 113 000 7 398 000 8 891 000
Heating cost with system in place ($/a)
Electricity heated 1 127 000 1 772 000 2 037 000
Other (oil, wood) 306 000 525 000 552 000
Total 1 433 000 2 297 000 2 589 000
Heating cost with district heating ($/a)
Scenario 1 (10$/GJ) 809 000 1 326 000 1 508 000 Scenario 2 (12$/GJ) 971 000 1 591 000 1 810 000 Scenario 3 (14$/GJ) 1 132 000 1 856 000 2 112 000
Results and discussion
The key results of the economic analysis are given in Table 10. The precision of those results should be of the order of ± 30%. In general the payback times are quite high by current standards of public and private investments as could be expected from the load densities presented earlier. However some interesting facts emerge from the analysis.
Table 10. Summary of economic analysis per district and scenario.
District A B C
10a. Supply (Mill)
Cost of vapor produced ($/a) 135 000 222 000 252 000
Sale of steam ($/a) 410 000 672 000 765 000
Profit ($/a) 275 000 450 000 513 000
10b. Distribution (District operator)
Investment costs ($/a) 1 430 000 2 343 000 3 347 000 Fixed operating costs ($/a) 159 000 177 000 197 000 Variable operating costs ($/a) 410 000 672 000 765 000 Total operating costs ($/a) 569 000 849 000 962 000 Revenues ($/a)
Scenario 1 (10$/GJ) 809 000 1 326 000 1 508 000 Scenario 2 (12$/GJ) 971 000 1 591 000 1 810 000 Scenario 3 (14$/GJ) 1 132 000 1 856 000 2 112 000 Payback time (a)
Scenario 1 (10$/GJ) 6.0 4.9 6.1
Scenario 2 (12$/GJ) 3.6 3.2 3.9
Scenario 3 (14$/GJ) 2.5 2.3 2.9
10c. Utilization (Customers)
Investments 4 113 000 7 398 000 8 891 000
Savings in heating cost ($/a)
Scenario 1 (10$/GJ) 624 000 971 000 1 081 000
Scenario 2 (12$/GJ) 462 000 706 000 779 000
Scenario 3 (14$/GJ) 301 000 441 000 477 000
Payback time (a)
Scenario 1 (10$/GJ) 6.6 7.6 8.2
Scenario 2 (12$/GJ) 8.9 10.5 11.4
As could be expected, the payback time for the distribution system decreases as the sale price of energy increases (from scenario 1 to scenario 3) whereas, naturally, it increases for the customers and quite sharply at that. For scenario 3, the annual savings in heating cost are small and the payback times are too long (14 to 19 years). In the case of the distribution system, the payback times are lower for district B than for either district A or C; for the customers however, there is a regular increase of payback time from district A to district C.
From those observations, it can be summarized that district B with scenario 1 or 2 are the two options worthy of further consideration. Other factors should be brought into the picture at this point.
• If the district operator is a non-profit organization rather than a private company it can be assumed that it could tolerate longer payback times,
• Government incentives could be used to make the move to district heating more attractive to building owners and,
• The profit from the sale of energy could be rebalanced between the mill and the district operator.
In view of these remarks, a new scenario (4) could be envisaged with the following parameters:
District: B;
Sale price of steam by the mill: 4.17 $/GJ; Sale of heat to customers: 8.75 $/GJ;
Government incentive to customers: 15% of investments. The key results for the partners to the district heating initiative would be:
Profit to the mill: 379 000 $/a;
Payback time of the distribution system: 6.0 a; Average payback time for the customers: 5.5 a.
For this scenario, district heating would probably be a viable endeavour. Of course, the results could be further optimized as a function of specified criteria however, other factors should be first considered: increased precision of cost estimates and impact on greenhouse gas emissions.
Finally, it should be noted that the implementation of a partial district such as proposed could be the first step of a progressive extension of district heating in the town. Factors that could stimulate extension are: amortization of the investment for the district system, rising energy prices and mounting environment pressures.
Conclusions
This study has shown that implementation of a district heating supplied by exportable steam produced by a kraft mill is technically feasible for the selected case study in the sense that the mill could supply the required heat load even during extreme Canadian winter conditions. However, this conclusion is predicated upon the fact that the mill should have first undergone a thorough thermal energy efficiency enhancement program. Importantly, the steam supplied to the district should be biomass-produced as the economics of the endeavor, as well as its environmental justifications, would be seriously
compromised if the steam were produced by a fossil fuel. Furthermore, the mill may have other, more attractive avenues such as the installation of a cogeneration unit to sell power to the grid.
The study has also shown that, considering the low density of the small town adjacent to the mill, in terms of built surface and space heating demand, a district which would attempt to serve essentially all the town’s buildings would not be economically viable. For this reason it was decided to focus on town sectors incorporating large public buildings with a high heating demand, as well as commercial building and relatively high density residential zones.
This led to the formulations of a solution incorporating the following elements: a partial district consisting of about half of the town, a non-profit management structure for the district operation, a judicious profit balance between mill and district operator and, a government incentive program to help the district customers. Such a solution could be economically viable.
To complete the assessment of this solution, an environmental impact study focused on the reduction of greenhouse gas emissions should be conducted.
Acknowledgement
This work has been supported by a grant from the Research and Development Cooperative Program of the National Science and Engineering Research Council of Canada. The contributions to the project from the industrial partners of this project are also gratefully acknowledged. Information supplied by mill staff and by the municipality
acknowledged. Finally, thanks are given to Enrique Mateos-Espejel and Keyan Bahrapour, graduate students working in different areas for their punctual albeit critical help.
References
Agrell, J., Bogetoft, P. (2005). Economic and environmental efficiency of district heating plants. Energy Policy, 33, 1351-1362.
Ajah, A.N., Patil, A.C., Herder, PM., Grievink, J. (2007). Integrated conceptual design of a robust and reliable waste-heat district heating system. Applied Thermal
Engineering, 27, 1158-1164.
Alao, H., Taoussi, A., Trépanier, M., Beaudry, C., Paris, J. (2007a). Rural district heating supplied by a Kraft pulp mill: Preliminary feasibility study. 93rd Annual Meeting of Pulp and Paper Technical Association of Canada, Reprints, A247-251.
Alao, H. (2007b). Étude de la demande énergétique pour le chauffage des édifices dans le cadre d’un projet de chauffage de district alimenté par une usine de pâte et papier. Rapport de projet de maîtrise, École Polytechnique de Montréal, 104p. ASHRAE (2000). Systems and Equipment Handbook, Chapter 11. Atlanta, GA:
American Society of Heating, Refrigerating and Air-Conditioning Engineers. Canadian District Energy Association (2007). Official website, http://www.cdea.ca/. City of Montpellier (2006). District heating project website,
http://www.montpelier-vt.org/wip/districtheat/index.cfm.
Çomakli, K., Yüksel, B., Çomakli, Ö. (2004). Evaluation of energy and exergy losses in district heating network. Applied Thermal Engineering, 24, 1009-1017.
Curti, V., von Spakovsky, M.R, Favrat, D. (2000). An environomic approach for the modeling and optimization of a district heating network based on centralized and decentralized heat pumps, cogeneration and/or gas furnace. Part I: Methodology.
International Journal of Thermal Sciences, 39, 721-730.
Dahm, J. (2001). Small district heating systems - system alternatives and costs. Euroheat
Environment Canada (2005). Canadian Climate Historical Database Online. http://www.climate.weatheroffice.ec.gc.ca/climateData
Enwave Canada (2007). Commercial website, http://www.enwave.com.
Eriksson, O., Finnveden, G., Ekvall, T., Bjorklund, A. (2007). Life cycle assessment of fuels for district heating: A comparison of waste incineration, biomass- and natural gas combustion. Energy Policy, 35, 1346-1362.
Euroheat (2007). Renewables in District Heating and Cooling. Commercial brochure, http://www.euroheat.org/documents, 16 p.
Gebremedhin, A. (2003). The role of a paper mill in a merged district heating system.
Applied Thermal Engineering, 23, 769-778.
Gervais, M.-A., Kajl, S., Schweigler, C., Paris, J. (2007). Conception et paramètres opératoires d’un réseau de chauffage de district. VIIIe Colloque Interuniversitaire Franco-Québécois: Actes Thermique des Systèmes, 323-328.
Holmgren, K. (2006). Role of a ditsrict-heating network as a user of waste-heat supply from various sources – the case of Göteborg. Applied Energy, 83, 1351-1367. Holmgren, H., Amiri, S. (2007). Internalising external costs of electricity and heat
production in a municipal energy system. Energy Policy, 35, 5242-5253.
IDEA (2007). International District Energy Association website, http://www.districtenergy.org/de_history.htm.
Karlsson, T. (1982). Geothermal district heating, the Icelandic Experience. United
Nations University Geothermal Training Programme, Report 4.
Keppo, I., Savola, T. (2007). Economic appraisal of small biofuel fired CHP plants.
Energy Conversion and Management, 48, 1212-1221.
Klugman, S. Karlsson, M., Moshfegh, B. (2006). An integrated chemical pulp and paper mill: Energy audit and perspectives on regional cooperation. Proceedings of
ECOS 2006: 19th International Conference on Efficiency, Cost, Optimization, Simulation and Environmental Impact of Energy Systems, 637-644.
Lemale, J., Jaudin, F. (1998). La géothermie, une énergie d'avenir, une réalité en Ile de France, Brochure IAURIF, 12 p.
Lund, J. W. (2006). Geothermal energy focus: Tapping the earth’s natural heat. Refocus,
7, 48-51.
Marletta, L., Sicurella, F. (2002). Environmental and energy costs of a district heating network. Ninth International Conference on the Modeling, Monitoring and
Management of Environmental Problems: Development and Application of Computer Techniques to Environmental Studies, 35-44.
Mateos-Espejel, E., Marinova, M., Marechal, F., Paris, J. (2007a). Analyse énergétique d’évaporateurs par la méthode de la double représentation. VIIIe Colloque Interuniversitaire Franco-Québécois: Actes Thermique des Systèmes, 257-262.
Mateos-Espejel, E., Madtha L., Marinova, M., Paris, J. (2007b). Energy and water in the pulp and paper industrie: the two solitudes. Chemical Engineering Transactions,
11, 695-700.
Narjot, R. (1985). Réseaux de chaleur – Transport. Techniques de l’ingénieur, Génie
énergétique, Dossier B2170.
Narjot, R. (1986). Réseaux de chaleur – Chauffage urbain. Techniques de l’ingénieur,
Génie énergétique, Dossier B2172.
Natural Resources Canada. (2005). Energy use data handbook, 1990 and 1998 to 2004 – Comprehensive energy use database. Office of Energy Efficiency, Ottawa.
Ozgener, L., Hepbasli, A., Dincer, I. (2007). A key review on performance improvement aspects of geothermal district heating systems and applications. Renewable and
Sustainable Energy Reviews, 11, 1675-1697.
Pavlas, M., Stehlík, P., Oral, J. Sikula, J. (2006). Integrating renewable sources of energy into an existing combined heat and power system
Energy, 31, 2499-2511.
Philibert, C. (2005). The present and future use of solar thermal energy as a primary source of energy. International Energy Agency Information Paper, Paris.
Smook, G.A. (2002). Handbook for pulp & paper technologists. Vancouver, BC: Angus Wilde Publications Inc.
Trygg, L., Gebremedhin, A., Karlsson, B.G. (2006). Resource-effective systems achieved through changes in energy supply and industrial use: The Volvo-Skövde case.
Applied Energy, 83, 801-818.
Ulrich, G.D., Vasudevan, P.T. (2004). Chemical engineering process design and
economics: A practical guide. Durham, NH: Process publishing.
Vancouver 2010 Organizing Committee. (2007). Sustainability – Environment stewardship and impact reduction. http://www.vancouver2010.com/.
Vanier, D.J., Rahman, S. (2004). MIIP Report: Survey on Municipal Infrastructure Assets, Institute for Research on Construction Report no. B-5123.2, 63 p.
Wierzbicka, A., Lillieblad, L., Pagels, J., Strand, M., Gudmundsson, A., Gharibi, A., Swietlicki, E., Sanati, M., Bohgard, M. (2005). Particle emissions from district heating units operating on three commonly used biofuels. Atmospheric
Environment, 39, 139-150.
Wigbels, M., Bohm, B., Sipila, K. (2005). Dynamic heat storage and demand side management strategies. Euroheat & Power – English edition, 11, 58-61.
Yildirim, N., Toksoy, M., Gokcen, G. (2006). District heating system design for a university campus. Energy and Buildings, 38, 1111-1119.
Zsebik, A., Sitku, G. (2001). Heat exchanger connection in substations – A tool of decreasing return temperature in district heating networks. Energy Engineering,
![Table 1. Major Canadian Steam Networks [CDEA, 2007].](https://thumb-eu.123doks.com/thumbv2/123doknet/8247845.277570/8.918.271.650.528.698/table-major-canadian-steam-networks-cdea.webp)
![Table 2. New district heating surface created in 2003 and 2006 [IDEA, 2007].](https://thumb-eu.123doks.com/thumbv2/123doknet/8247845.277570/9.918.254.661.197.492/table-new-district-heating-surface-created-idea.webp)


![Table 5. Favorability for district heating based on thermal load density [Karlsson, 1982].](https://thumb-eu.123doks.com/thumbv2/123doknet/8247845.277570/20.918.249.673.833.1018/table-favorability-district-heating-based-thermal-density-karlsson.webp)