Economic Properties
of Intangibles Recognized under Domestic Accounting Standards: Evidence from Pre-IFRS Major European Markets
Jean-François CASTA*
Dauphine Recherches en Management (DRM) CEREG Research Centre
Université Paris-Dauphine, 75016 Paris, France Phone: (+33)1.44.05.44.82 Fax: (+33).1.44.05.40.23 jean-francois.casta@dauphine.fr Olivier RAMOND
Dauphine Recherches en Management (DRM) CEREG Research Centre
Université Paris-Dauphine, 75016 Paris, France olivier.ramond@dauphine.fr Lionel ESCAFFRE GRANEM Université d’Angers
B.P. 13633 - 49100 Angers CEDEX 01, France
lionel.escaffre@free.fr
July 2008
* Corresponding author
Authors thank participants at the 2008 Illinois International Accounting Symposium held at Kozminski Business School, Warsaw, Poland and especially Thomas Jeanjean, Cédric Lesage, Hervé Stolowy and Piotr Wojtowicz for helpful comments and guidance on an earlier version of the paper.
Economic Properties
of Recognized Intangibles under Domestic Accounting Standards: Evidence from pre-IFRS European Markets
Abstract
This study investigates whether European domestic GAAPs used for intangibles recognition prior to the IFRS adoption exhibit major differences while examining the relationship between a firm’s economic (financial, operating and competitive) performance and its recognized intangible investment (RII). Using a five-European-country sample over the pre-IFRS compliance period 1993-2004, we first provide evidence that, independently of the intangibles accounting recognition practices, investors adopt a short-term perspective or “myopic view” while constructing their portfolios by penalizing firms with high RII. Secondly, contrary to the resource-based view, our results suggest that RII do not underpin under any accounting treatment better competitive position inside a specific industry. Finally, our findings clearly support the idea that EU continental accounting standards, while opposed to Anglo-Saxon settings, ease the relationship existing between RII and firm operating performance. This last result would suggest that IFRS adoption could lead to disconnect operating margins from RII and subsequently challenge the widespread claim that IFRS help produce higher-quality reporting about a firm’s operating activities.
JEL Classification: G31; M21; M41.
Keywords: Intangibles, Goodwill, R&D, Recognition, Domestic GAAPs, Usefulness, Relevance, Informativeness.
1. Introduction
One of the major precepts of the modern finance theory states that, in a competitive setting, the market value of a firm’s equities is equal at margin to the value of all the firm net assets minus its liabilities. As long as most of the firm assets are physicals such as plants, properties and equipments, the observed relationship between assets value and stock price is rather straightforward (Beaver, 1981). However, in a new knowledge-based economy, the market value of a company chiefly reflects its intangible assets such as brands, patents, reputation, human and organizational capital, whether recognized or not by the domestic accounting standards under which they are reported. In this respect, it has been argued that facing growing-up intangible flows1, traditional accounting frameworks relying on the “classical
transactional principle” may fail to fully meet its primary informative role (e.g. Lev, 2001; 2004). Indeed, while considering either Anglo-Saxon or European continental Generally Accepted Accounting Principles (hereafter, GAAP), intangibles appear to be partially and inaccurately recognized and reported into the financial statements (Lev, 2001; Stolowy and Cazavan-Jeny, 2001). This accounting bias is commonly attributed to national accounting standard setters who tend to make the “accurate information” principle prevail at the cost of the “relevant information” principle (Cañibano, García-Ayuso and Sánchez, 2000) by not coping with the problems of definition and recognition of intangibles (Egginton, 1990). As a result, “the current financial-reporting system struggles to handle the economic properties of intangible assets” (Powell, 2003: 797).
In the meantime, authors (e.g. Hand and Lev, 2004; Henning, Lewis and Shaw, 2000) widely claim that intangibles are increasingly becoming the major drivers of firm value and performance in most economic sectors, although the benefits from reporting and communicating on these assets to external parties have not gained much attention from managers and standard setters (Lev, 2001). However, numerous empirical researches (e.g.
Sougiannis, 1994; Lev and Zarowin, 1998; Lev, 2004; Villalonga, 2004) keep on arguing that accounting indicators for intangible investments, although incomplete and inaccurate, are still useful, informative and value-relevant2 to external and internal parties but may depend on the accounting treatment used to recognize intangibles. This last statement sketches the main hypothesis we test in this paper3.
More precisely, motivated by the current debate surrounding the international accounting standard n°38 (i.e. IAS 38) ‘Intangible Assets’ adoption and its underlying harmonization process, this paper investigates whether European domestic GAAPs used for intangibles recognition prior to the IAS adoption exhibit major differences while examining the relationship between a firm’s economic (financial, operating and competitive) performance and its recognized4 intangible investment (RII). We focus on this empirical relationship since intangibles reporting practices and accounting treatments have been largely debated from a theoretical point of view at the European level (Ding, Stolowy and Tenenhaus, 2007; Powell, 2003; Stolowy and Cazavan-Jeny, 2001) although a very few studies have attempted to address empirical relationships issues. We believe this setting to be of much interest since international accounting standards have been enforced to EU listed companies in 2005 implying a harmonization of accounting treatments and practices. Our pre-IAS results could then help better understand the potential advantages and drawbacks of such a harmonization at a European level regarding the accounting for intangibles since a wide set of accounting treatments was previously used for reporting intangibles respectively in the different EU countries (see Stolowy and Cazavan-Jeny, 2001).
Using a five-European-country sample including listed firms from UK, Germany, France, Italy and Spain, over the pre-IFRS compliance period 1993-2004, we test whether certain domestic GAAPs ease the relationship between firm economic (financial, operating and competitive) performance and their RII. RII is measured by three accounting proxies: the
change in goodwill stock, the change in recognized intangible assets stock and the research and development (R&D) expenditures. Both measures of stock are based on the Griliches’ (1981) and Hall’s (1990) perpetual inventory equation.
Assuming UK GAAPs intangible recognition requirements are the closest EU accounting standards to the IFRS setting in terms of intangibles reporting (see Nobes and Parker, 2004), we examine independently each national accounting design and gauge their differences in terms of firm performance regarding the UK framework as an IAS-like benchmark.
The empirical approach followed in this study is not innovative on its own. Indeed, since the seminal works of Griliches (1981) and Cockburn and Griliches (1988) which document the links between the firm’s market value and its intangible assets value, a large academic stream has progressively been developed which henceforth provides self-conclusive evidence about the impact of intangible investment on firm performance5. However, the conclusions drawn by this literature face currently two boundaries. Firstly, most of these studies are mainly concerned with the impact of intangible investments as proxied by research and development (hereafter R&D) expenditures (e.g. Sougiannis (1994); Lev and Zarowin (1998); Chan, Lakonishok and Sougiannis (2001); Cazavan-Jeny and Jeanjean (2006)) or firm patents (e.g. Griliches (1981); Cockburn and Griliches (1988)) on stock prices. Consequently, key intangible accounting items such as recognized intangible assets and goodwill are frequently eluded from the scope of analysis. Secondly, these studies mainly focus on US-based samples which make the relationships documented by this literature hardly extendable to other accounting and financial settings such as the European context because of the existence of obvious institutional and accounting standards practices’ divergences (Powell, 2003; Stolowy, Haller and Klockhaus, 2001).
In this respect, our paper makes three contributions to the accounting literature. We first provide evidence that, in any EU domestic GAAPs environment under scope, investors adopt
a short-term perspective or “myopic view” while constructing their portfolios by penalizing on the short-run firms with high RII. Secondly, contrary to the resource-based view, our results suggest that RII do not underpin better competitive position inside a specific industry. Finally, our findings clearly support the idea that EU continental accounting standards, while opposed to Anglo-Saxon settings, ease the relationship existing between a firm’s RII and its operating performance. This last result would suggest that IAS adoption could lead to disconnect operating margins from RII and subsequently challenge the widespread claim that IAS help produce higher-quality reporting about a firms’ operating activities.
The remainder of the paper is organized as follows. The following section reviews the literature, summarizes prior empirical results. Section 3 discusses the domestic accounting standards. Section 4 delineates the research design. The data collection process and sampling methodology are then presented in section 5. Section 6 discusses the results for RII and firm performance while robustness tests are provided in section 7. Finally, section 8 concludes.
2. Prior studies
In this section, prior studies examining the association between intangible investments and firm financial, operating and competitive performance are briefly presented.
2.1. Empirical studies on intangibles accounting informativeness
Over the last two decades, numerous empirical studies have attempted to provide evidence supporting that investment in intangibles (often roughly assimilated to R&D expenses or advertising expenditures) significantly increase the firm future performance and are then positively correlated with market value.
The first studies were US-oriented and aimed to prove to the US FASB (Financial Accounting Standards Board) that R&D and other intangible investments were associated with additional firm performance and consequently could justify the expenditures’ capitalization (Cañibano et al, 2000). However, since weak support was provided to this hypothesis (see for example, Johnston (1967)), the FASB issued in 1974 the Statement of Financial Accounting Standards (SFAS) n°2 prohibiting the capitalization of R&D expenditures. Bringing more conclusive evidence, recent studies have partly filled the gap separating additional future profitability from investments in R&D (e.g. Sougiannis, 1994; Lev and Sougiannis, 1996; Lev and Zarowin, 1998) or advertising expenses (Bublitz and Ettredge, 1989; Chauvin and Hirschey, 1993). However, since the approach of “future profitability” may vary significantly amongst empirical studies, crossing over the various results turns to be particularly complex. However, three categories of research could be identified: first, value-relevance researches examine the relationships between share return and investments in intangible assets (e.g. Sougiannis, 1994; Lev and Sougiannis, 1996; Lev and Zarowin, 1998), second, production costs-based studies investigate the association between operating income and intangible investments (e.g. Nakamura, 2004) and third, resource-based view studies are mainly concerned with the interrelationship between a firm’s competitive advantage/disadvantage and its intangible resources (e.g. Villalonga, 2004).
2.2. Value-relevance studies
The relationship between share return and the increase in R&D expenditures have been widely documented after Grabowski and Mueller (1978) suggest that firms evolving in intensive research environment exhibit on average greater stock returns. Adopting a more financial perspective, Morck and Yeung (1991), stepping Hirschey’s (1982) work, report that,
on average, R&D and advertising expenditures impact positively and significantly a firm’s market value.
Proposing an approach based on the Ohlson’s (1995) model framework, Sougiannis (1994) provides strong evidence that R&D expenditures are positively related to firm profit over a seven-year period. The author then suggests that investment in R&D can help increase future performance and market value since this latter one can be formulated as the present value of future performance. Following this idea, Lev and Sougiannis (1996) and Lev and Zarowin (1998) document a significant intertemporal relationship between R&D capital and future share return, claiming that a valuation bias may occur for stock prices of companies involved in intensive R&D investments because of an additional risk factor attributable to this activity. Similarly, Chan, Lakonishok and Sougiannis (2001) bring evidence that US listed firms involved in high R&D expenditures to market value ratio tend to exhibit weak past share returns and signs of mispricing. This last result would imply that the market does not fairly reward companies for their R&D investments and / or cannot deal correctly with R&D-related disclosures.
However, a number of studies such as Sougiannis (1994), Lev and Sougiannis (1996) and Chan et al (2001) do not find out any clear relationship between R&D expenditures level and future share returns. Following this results disparity amongst empirical studies, Lev (2004) suggests this could be explained by the different proxies used for share returns.
2.3. Production costs-based studies
In a recent study, Nakamura (2004) observes that investments in R&D made by private US companies have increased from 20 billions of USD up to 180 billions of dollars over the period 1977-2000 while production costs as a percentage of firm to total sales have substantially diminished on average, over the same period (from 12.5% to 53.5% as shown in
Exhibit 1). Following this, Nakamura (2004) claims that intangible investments sustained during at least five years could make the firm’s operational margins increase on average.
INSERT EXHIBIT 1 ABOUT HERE
These findings coupled with the ones provided earlier by Lev and Sougiannis (1996) and Lev and Zarowin (1998) would suggest that the intrinsic value of R&D expenditures would simply be equal to the present value of additional future operating income generated by these investments. Similarly, Sougiannis (1994) observes that R&D expenditures impact positively and significantly the firm operating income over at least 7 financial periods. This last result constitutes a starting point for the « resources-based view » researches which hypothesize that intangible assets are a firm’s independent resource as any physical asset and subsequently can be directly related to a firm’s competitive advantage / disadvantage.
2.4. Intangible resources and competitive advantage / disadvantage
Some recent studies have opted for the “resource-based view” (RBV) (see Itami, 1987) as research design testing that operating benefits persistence, the firm specific profit (defined conventionally as the difference between the firm’s yearly abnormal profitability within its own industry group) and the intangible investments are interrelated. In a study based on 1,992 US listed companies, over the period 1981-1997, Villalonga (2004) brings support to the claim that intangible resources6 is positively linked to the firm specific profit / loss persistence and thus to the RBV hypothesis which states that intangible assets play a key role in sustaining a firm’s competitive advantage / disadvantage. Following this, Villalonga (2004) concludes that from a strategic point of view, intangibles appear to be a double-edged sword and in this respect meet the RBV theory expectations. This argument saying that
intangibles could have a negative impact on firm’s competitive position has been shyly documented in the accounting literature (for a discussion on this point, see Lev and Zarowin, 1998).
As a summary, prior studies exhibit mixed results about the impact of intangible investments on firm performance. First, intangible investments seem to be positively related to share returns up to seven financial periods (Sougiannis, 1994; Lev and Sougiannis, 1996; Lev and Zarowin, 1998) while others (e.g. Chan et al, 2001) still do not find any conclusive results. Second, empirical studies find that operating profit is positively related to R&D expenses on a long-run perspective (Sougiannis, 1994; Lev and Zarowin, 1998; Nakamura, 2004). Finally, “resource-based” researches (e.g. Villalonga, 2004) clearly support the idea that firm intangible resources impact a firm’s competitive advantage / disadvantage. However, as noted previously, most of these studies are US-based and consequently evidences are seldom provided at the European level while considering other accounting treatments.
2.5. Empirical studies at the European level
Indeed, as reported by Powell (2003), empirical intangibles’ economic properties have rarely been examined in the European environment except in the UK, France and to a lesser extent in Germany. Over the last decade, European-based intangibles studies were chiefly focused on comparative accounting standards treatments and financial reporting practices divergences excluding OLS regression considerations (e.g. Alexander and Archer, 1996; Nixon, 1997). Studying worldwide accounting practices for intangibles, Stolowy and Cazavan-Jeny (2001) analyze accounting treatment and financial reporting divergences for R&D expenditures, goodwill, patents, licenses, brands, trademarks, and others in 21 countries including UK, Germany, France, Italy and Spain. They conclude that a lack of commonly accepted conceptual framework implies accounting treatment and reporting practices inconsistency
both inter-country and intra-country. In a similar vein, Stolowy et al (2001) point out the intricacy of an international harmonization in terms of intangibles reporting practices taking the accounting treatment for brands under French, German and International GAAPs as an illustration.
Empirical EU-based results are rarely provided but, when existing, mostly focus on two types of intangibles: R&D and brands. Using a UK sample of 10,874 firm-year observations over a 10-year period (1990-1999), Al Horani, Pope and Stark (2003) provide evidence that a measure of R&D helps explain cross-sectional variation in stock returns. Furthermore, their empirical analysis indicates that the cross section of expected stock returns, in the UK setting, is positively related to R&D activity. More recently, Cazavan-Jeny and Jeanjean (2006) examine the value relevance of R&D reporting in a sample made of 197 French listed firms over a 10-year period (1993-2002). While founding their research design on two value relevance studies (explanation of the year-end share price and explanation of the cross-sectional returns) of R&D accounting treatment (expensed vs. capitalized), they find that R&D capitalization is significantly and negatively associated with stock prices and returns. The authors then conclude that investors although concerned with react negatively to R&D capitalization.
Using a sample of 564 German listed firms (315 of which use German GAAP, 212 IAS and 140 US-GAAP) over the period 1997-2003, Ramb and Reitzig (2005) show that the value relevance of R&D disclosures under German GAAPs can be superior to that provided by US-GAAP and IAS. In this respect, they demonstrate that IAS / US US-GAAPs exhibit a risk of misleading investors during “bear market” periods exceeding their comparative advantage over the conservatism principle during “bull market” periods.
Adopting a more international perspective, Ding et al (2007) examine the impact of R&D expenditures on company performance in six countries (including Germany, Switzerland and
UK) over a 10-year period (1991-2000). Consistent with prior US-based studies (Sougiannis, 1994; Lev and Sougiannis, 1996; Lev and Zarowin, 1998), they find that R&D expenditures contribute positively to future firm performance.
Examining determinants of voluntary brand recognition in the UK environment with a sample of 33 listed firms on the London Stock Exchange (LSE) over a 9-year period (1988-1996), Muller III (1999) finds that firms’ decisions to capitalize acquired brands are mainly influenced by the impact that the immediate write-off of goodwill to equity has on the LSE’s shareholder approval requirement for future acquisitions and disposals. These findings provide evidence of contracting costs that result from stock exchange mandated shareholder approval rules for planned transactions.
In a similar way, Kallapur and Kwan (2004) examine the value relevance of brand recognized as assets by 33 UK firms, and the stock price reaction to the announcement of brand capitalization. They find that brand assets are significantly associated with market values. However, the authors note that there could be substantial differences in the extent to which brand valuations are biased depending on the firm level of contracting incentives (e.g. bonus plan compensation, debt covenants).
3. Domestic Accounting Standards for Intangibles
This section provides a brief discussion about domestic accounting standards under which intangibles disclosures are reported over the pre-IFRS compliance period of analysis (1993-2004).
3.1. UK
UK accounting standards related to intangibles chiefly include FRS 2 “Accounting for Subsidiary Undertakings” (issued in June 1992), FRS 3 “Reporting Financial Performance”
(October 1992), FRS 10 “Goodwill and Intangible Assets” (December 1997) (which supersedes SSAP 22 “Accounting for Goodwill”), FRS 11 “Impairment of Fixed Assets and Goodwill” (July 1998), SSAP 12 “Accounting for Depreciation” (December 1977) (superseded in 2000 by FRS 15 “Tangible Fixed Assets”), and SSAP 13 “Accounting for Research and Development” (December 1977). Apart of these standards issued by the private UK Accounting Standards Board, the Companies Act of 1985 also provides some general guidelines about intangibles recognition requiring that all assets with a finite life to be depreciated, if and only if the ‘true and fair’ override of ss226 and 227 of the Act is invoked. Under FRS 10, the costs of acquired intangible assets, including purchased goodwill, must be capitalized and amortized over their useful lives. According to SSAP 13, the costs of internally developed intangible assets – including R&D – must be expensed when incurred. However, if an ascertainable market value can be attributed to them, they can be capitalized. According to Hoegh-Krohn and Knivsfla (2000), this last criterion makes the capitalization of R&D expenditures rare in practice.
Purchased goodwill and intangible assets are presumably amortized over 20 years although greater useful lives are possible. Impairment reviews should be performed on a regular basis to ensure that any intangible assets (including goodwill) are not reported above their recoverable amounts.
Concerning R&D expenditures, SSAP 13 states that “expenditure incurred on pure and applied research can be regarded as part of continuing operation required to maintain a company’s business and its competitive position. In general no one particular period rather than any other will be expected to benefit and therefore it is appropriate that these costs should be written off as they incurred” (SSAP 13, §8 and also see Companies Act 1985, Schedule 4, paragraph 3(2)(c)). However, SSAP 13 (§19) distinguishes between pure and applied research and allows the applied R&D expenditure capitalization if the following
criteria are met (§§10-12): “(1) there is a clearly defined project; (2) the related expenditure is separately identifiable; (3) the outcome of the project will be examined regarding its technical feasibility and its commercial viability; (4) further development costs to be incurred on the same project, together with related production, selling and administration costs, will be more than covered by related revenues; and (5) adequate resources exist, or are reasonably expected to be available, to enable the project to be completed and to provide any consequential increases in working capital”.
3.2. Germany
The HandelsGesetzBuch (HGB) Commercial Code does not provide any definition for intangible assets. Under HGB, the recognition of internally developed intangibles including brands is not possible because the measurement is presumed not to be reliable enough (see also MarkenG, Brands Act of the 25th of October 1994). However, the costs of acquired intangible assets, including purchased goodwill, can be capitalized and amortized over their useful life, presumably between 3 and 5 years, but possibly up to 20 years. Goodwill can be amortized only over 15 years (HGB, §268). Regarding R&D expenses, the HGB (§258) states that research expenditures that are not related to a specific contract must be expensed or included in production costs. Capitalization is then possible whenever HGB conditions are met.
3.3. France
Under French GAAPs, the costs of internally developed intangibles including market share and customer portfolio can be capitalized (Comité de la Règlementation CRC Rule 99-03 of the 29th of April 1999). Regarding R&D expenditures, the capitalization of development (or applied research) costs is an optional but preferred method (CRC Rule 2004-06 of the 23rd of November 2004). However, basic research costs must be expensed when incurred.
According to the CRC Rule 2004-06, the costs of intangibles purchased must be capitalized since these assets are presumed to represent contractual rights and are characterized by a separate acquisition. As a result, during business combinations, purchased intangibles must not be incorporated in goodwill and recognized separately. The goodwill can be recognized based on a purchased cost method and must then be amortized over a reasonable period (art. 21130 of the CRC Rule 99-02 of the 29th of April 1999).
3.4. Italy
In Italy, standards of accounting for intangibles, including R&D expenditures, include the Italian civil code (overall the part untitled “segni distintivi dell’imprenditore”, art. 2569 and following) and the Principio Contabile n.24 (Accounting Standard No. 24) issued in March 1999. These standards state that the costs of internally developed brands must be expensed when incurred. Acquired intangibles including purchased goodwill are recognized as assets because presumed to be founded on contractual rights. Goodwill is commonly amortized over 5 years although greater useful lives can be used.
Like under French GAAPs, the Principio Contabile n.24 distinguishes three different types of R&D costs: (1) “basic research”; (2) “applied research”; and (3) “development”. Costs of basic research must be expensed while expenditures related to applied research and development can be capitalized if the following conditions are met: (a) the project is clearly identifiable; (b) the project costs are identifiable and measurable; (c) the project is technically feasible; (d) the project financing is ensured; (e) the project return on investment is positive. Whenever capitalized, R&D expenditures should be amortized over a period no longer than 5 years. The R&D capitalization should be approved by the “collegio sindacale” (statutory auditors) (see art. 2426 of the Italian civil Code).
3.5. Spain
In Spain, the Royal decree (Real decreto) n°743/1990 of the 20th of December 1990 and the Company Act of 1989 (Ley de Sociedades Anónimas) have greatly modified the Accounting Standards Framework (Plan de Contabilidad General) issued in 1970. Goodwill must be amortized up to 10 years. Internally developed intangibles can be capitalized under conditions making it hard in practice. The goodwill must be recognized on asset with an amortization from 5 to 10 years. All other acquired intangibles must be capitalized and amortized over their useful life. Following the third part untitled “Deficiones y relaciones contables” (Accounting definitions and relations) of the Accounting Standards Framework, the capitalization of R&D expenditures are possible if (1) they can be assigned to an individual project; (2) the assignation, the imputation and the distribution of the costs is established for each research project; (3) the project must be technically feasible; (4) the project return on investment must be reasonably positive; and (5) the project financing must be ensured.
4. Research design
Adopting a global perspective, our research design aims to discuss the major economic properties of recognized intangible investments while considering different accounting settings. In this respect, regarding the past accounting literature, three models related respectively to the firm financial (3.2), operating (3.3) and competitive (3.4) performance are presented in this section. They are all based on the perpetual inventory equation (3.1).
4.1. Perpetual inventory equation
Prior studies examining the relationship between firm performance and intangible assets are based either on stock measures (e.g. Griliches, 1981), or on flow measures (e.g. Lev &
Zarowin, 1998) or on both (e.g. Villalonga, 2004). To mitigate multicollinearity bias amongst accounting stock variables, the procedure described by Hall (2001) is followed. These measures are determined not only for the total of intangible assets as reported in the balance sheet but also for recognized goodwill whether purchased or internally developed. Besides, because scale effects may influence our econometric results, independent variables are standardized by the end-of-period market value in the financial performance model and by total sales in the operating performance model. We thus assume that the perpetual inventory equation holds (firm subscripts are suppressed):
* 1 (1 δ) − = − + t t K K RIIt (1) where
Kt stands for the quantity (or stock) of recognized intangibles (i.e. intangible assets and
goodwill) at the end-of-period t;
δ is the depreciation rate of recognized intangibles7;
RIIt stands for the recognized intangible investments over period t.
As stated by Lev and Zarowin (1998), the periodical depreciation rate in the perpetual inventory equation is highly subjective and accordingly limits the modelling scope. However, Hall (2001; 1990) asserts that the choice made upon this depreciation rate does not influence significantly the results as far as the rate stays into the interval (5%; 20%). Robustness checks will be then performed to assess the influence of the depreciation rate on the regression results.
4.2. Financial performance model
We first start by implementing a model based on Lev and Zarowin’s (1998) approach estimating the response coefficient of RII from the following regression8:
*
0 1*( ) / 2 ( / )
γ γ γ
= + + + +
t t t t t
R EPS RII P RII Pt εt (2)
where
Pt is the firm share price (i.e. total price index) at the end-of-period t;
Rt is the firm share return (i.e. total return index) at the end-of-period t;
EPSt stands for the earning (i.e. net income) per share for period t;
RIIt is the recognized intangible investment per share for period t.
This model calls for three comments. Firstly, following Ohlson and Penman (1992), we use the level of financial variables instead of the change in variables as regressors in order to save one year-observation9. Secondly, using share return instead of price index as an endogenous
variable prevents the model to some extent from the omitted variable bias (Heckman, 1978) and the firm-specific effect (Anderson and Hsiao, 1982). Finally, as stated by Lev and Zarowin (1998), the coefficient γ1 is well known as the “earning response coefficient” in the
financial accounting literature while γ2 could be named, by analogy, the “intangible
investment response coefficient”. In other words, while γ1 reflects the impact of a
one-monetary-unit increase in net income on the price return index, γ2 indicates the impact of a
one-monetary unit invested in intangibles on the stock price.
4.3. Operating performance model
The second model tested in this paper is inspired from Nakamura’s (2004) and Lev’s (2001; 2004) works. In his intangibles’ valuation model, Lev (2001; 2004) assumes that a firm generates economic profits10 thanks to its physical and intangible capital. According to him, a firm’s physical capital can generate a predetermined amount of future benefits independent of the firm intrinsic nature whereas its intangible capital makes the firm generate abnormal benefits. The abnormal benefits concept is here understood as the additional benefit part realized by a firm relatively to its more direct competitors (see Villalonga (2004)). This
binary perspective is similar to the one discussed earlier by Mortensen, Eustace and Lannoo (1997) that intangible capital is indirectly revealed by the firm additional economic performances not related to intangible investments. Adopting a more macroeconomic point of view, Nakamura (2004) asserts that if a firm invests a substantial part of its resources in intangible assets, it should be able, if done efficiently, to reduce significantly its production costs on the long run and/or increase any kind of operational margins / mark-ups. Transposing this argument into a more microeconomic perspective, this would suggest that operating income (in percentage of total sales) should be impacted not only by current but also by past intangible investments.
Empirical studies report that from 5 to 7 lags of R&D expenditures can statistically influence firm performance (Sougiannis (1994); Lev and Sougiannis (1996); Lev and Zarowin (1998)). Consistent with these findings, the following model is formulated:
5 * * 0 1 1 1 / α α ( / )− β ( / )− = = + +
∑
+ t t t k t k kOI SALES TA SALES RII SALES εt
(4) where
OIt stands for the operating income (annihilated for R&D) for period t;
SALESt is total sales for period t;
TAt is total assets for period t;
RIIt is the recognized intangible investment per share for period t.
The sum of coefficients β (i.e. Σβκ) represents the impact of a one-monetary unit intangibles
investment on the firm operating income through potential decrease of production costs11.
Since RII does not represent the unique source to a firm’s operating income, total assets is also included in the estimation model. Besides, since the variables RIIt appear to be stable
over time, regression estimators are computed using an Almon’s second-order polynomial transform12 to mitigate any serial correlation bias (for further details, see Almon, 1965;
4.4. Competitive performance model
The third model examines the impact of RII on the firm competitive advantage as proxied by the end-of-period firm market share. We define market share as the ratio of total sales over the two-digit SIC industry total sales. Nakamura (2004) and Villalonga (2004) suggest that intangible investments should help a firm keep or increase its market shares. Based on Ulrich and Smallwood’s (2004) work on organizational capital, we introduce into the modelling process an independent variable, ln(EMPLOjt) – the natural logarithm of the end-of-period
total number of employees – proxying for the firm labour force. It is noteworthy that this variable is also a common measure for firm size. The subsequent results should be then interpreted carefully. In order to control for the omitted variable bias (Heckman, 1978), the number of competitors is also included into the model as an explicative variable. The following regression is thus performed:
5 * * * 0 1 2 1 1 /( ) α α ln( ) α ln( ) β ( / )− = = ε = + + +
∑
N∑
t kt t t k t k kSALES SALES EMPLO COMP RII SALES k+ t
(5) where
SALESt stands for total sales for period t;
ln(EMPLOt) is the natural logarithm of the end-of-period number of employees;
ln(COMPt) is the natural logarithm of the end-of-period number of competitors within a
two-digit SIC industry;
RIIt is the recognized intangible investment per share for period t.
Similarly to the preceding model, the sum of coefficients β (i.e. Σβκ) represents the impact of
by its industrial market share. To control for multicollinearity variables bias, an Almon’s (1965) second-order polynomial transform as discussed previously is also performed.
5. Data collection and sample selection criteria
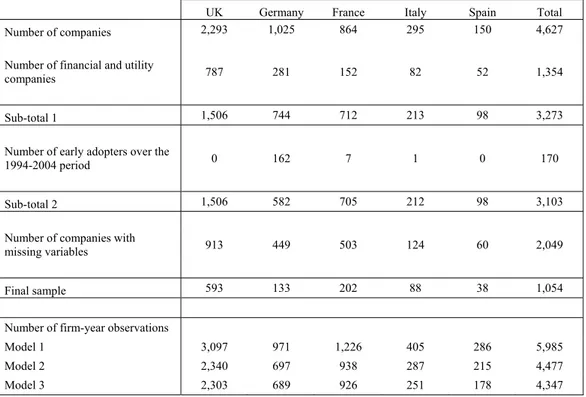
All the European Firms listed on the London, Frankfort, Paris, Milan and Madrid stock exchanges and available under Thomson Financial over the pre-IFRS compliance period 1993-2004 were collected. Accounting and financial variables are respectively obtained from WorldScope and DataStream (for further details, see Table 1). The following selection sampling criteria are then applied to the initial sample:
(1) Financial and utility companies whose SIC code spread from 6000 to 6999 (financial institutions), and from 9100 to 9999 (government and non classifiable companies) are excluded from the sample;
(2) Morck and Yeung (1991) amongst others underline that R&D-based variables suffer from a lack of information under traditional databases (e.g. WorldScope). Many “data-construction” procedures13 have then been proposed by academics to avoid small sample bias issues. Following this, we choose to deal with missing data using the Hall (1990) procedure performed during the NBER Manufacturing Sector Master File construction. This procedure implements an interpolation method coupled with the perpetual inventory equation proposed by Griliches (1981)14;
(3) Single observations within a two-digit SIC industry are dropped out;
(4) Early IFRS adopters are excluded using the WorldScope item (WC07536) “Accounting Standard Followed” as they do not fit our research design;
(5) Finally, observations within the top or bottom 1% of the pooled variable distribution are excluded from the analysis;
This sampling selection process leads to a final sample made of 593 UK, 133 German, 202 French, 88 Italian and 38 Spanish firms. Table 1 presents a breakdown of the samples by one-digit-SIC industry and country. Table 1 shows that both samples are fairly evenly distributed within most industries, except in “(3) Manufacturing” and “(7) Lodging and entertainment” for UK, “(2) Food, textile and chemicals” and “(3) Manufacturing” for Germany, “(2) Food, textile and chemicals”, “(3) Manufacturing” and “(7) Lodging and entertainment” for France and Italy, “(1) Mining and construction” and “(3) Manufacturing” for Spain. Further analysis will be then conducted in section 6 in order to examine the impact of these industrial overrepresentations on the OLS results.
INSERT TABLE 1 ABOUT HERE
6. Empirical results
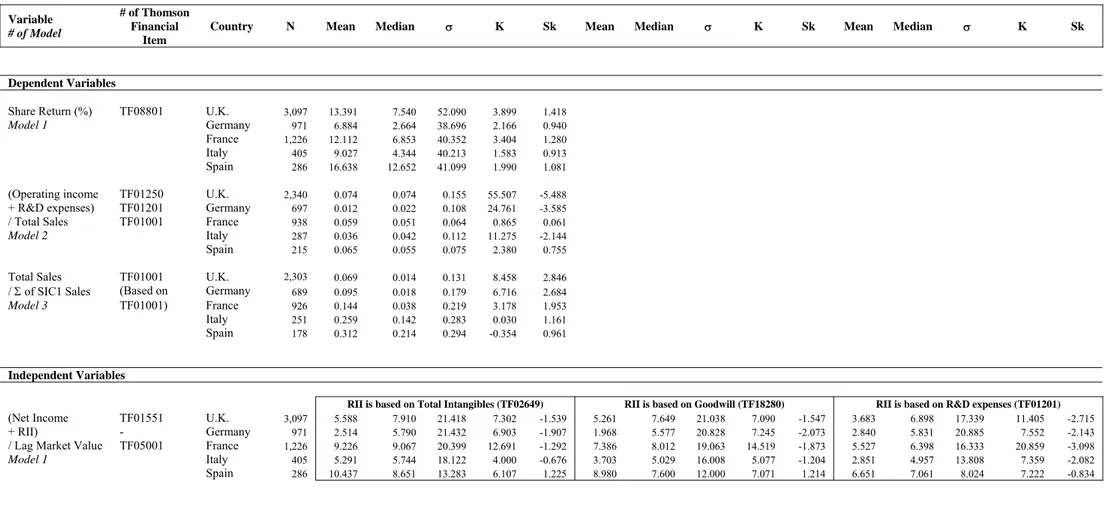
6.1. Descriptive statistics
Panel A of Table 2 provides descriptive statistics for the main financial and accounting variables under analysis while Panel B presents the univariate statistics by five-year periods for three intangible benchmark variables, namely, Intangibles to Total Assets ratio, Goodwill to Total Assets ratio and R&D to Total Sales ratio. It shows that the Mann-Whitney-Wilcoxon test is statistically significant for most of the variables within countries (except for the RND to Sales ratio in France and Spain) suggesting the presence of periodical effects. Following this, further robustness checks will be conducted in section 6.
From Panel B and Exhibit 2 to 4, recognized intangibles (as a percentage of total assets) have significantly increased in all the country samples between the two periods 1993-1997 and 1998-2003 suggesting that either accounting standard setters permit more recognition (Lev, 2004) and/or firms increase their use in the production process (Nakamura, 2004).
Goodwill expressed as a percentage of total assets is much higher on average (median) in France with 7.906% (4.994%) and Italy with 5.089% (1.334%) than in the UK with 3.587% (0.000%), in Germany with 3.209% (0.157%), and in Spain with 2.048% (0.550%). This last result could be explained by the difference in terms of goodwill accounting existing amongst the national regulatory frameworks. As an example, in the UK sample, the change in the percentage of goodwill as total assets increases on average (from 0.003% to 5.329%) from the period 1993-1997 to 1998-2003. This change is easily explicable by the issuance of FRS 10, in 1998, which definitely prohibits the “goodwill writing-off to reserves” optional rule. As reported by Lin (2006), this option was widely used by British companies before 1998. Finally, R&D (as a percentage of total sales) is much higher on average (median) in the UK with 7.953% (1.721%), in Germany with 3.671% (5.027%) than in France with 3.507% (2.617%), in Italy with 3.603% (3.006%) and in Spain with 3.979% (3.678%). Two reasons could explain such a difference: either Latin companies would invest much less in R&D than its European counterparts and / or they would tend to capitalize them more systematically (mainly because of fiscal purposes) as their respective accounting standards are more flexible in terms of capitalization than the German and UK standards. This latter explanation looks more plausible regarding the flexible capitalization rule of the “Real Decreto 743/1990” in Spain, the CRC Rule 2004-06 in France and the “Principio Contabile n.24” in Italy.
INSERT TABLE 2 ABOUT HERE
Unreported Pearson and Spearman correlation statistics indicate that the financial and accounting variables included the level of intangible assets is positively correlated with the level of R&D expenditures in the French, Spanish and German countries. This last result
would support the hypothesis formulated previously saying that the more a German (French or Spanish) firm exhibit R&D expenditures, the more it tends to capitalize them.
6.2. Regression Analysis
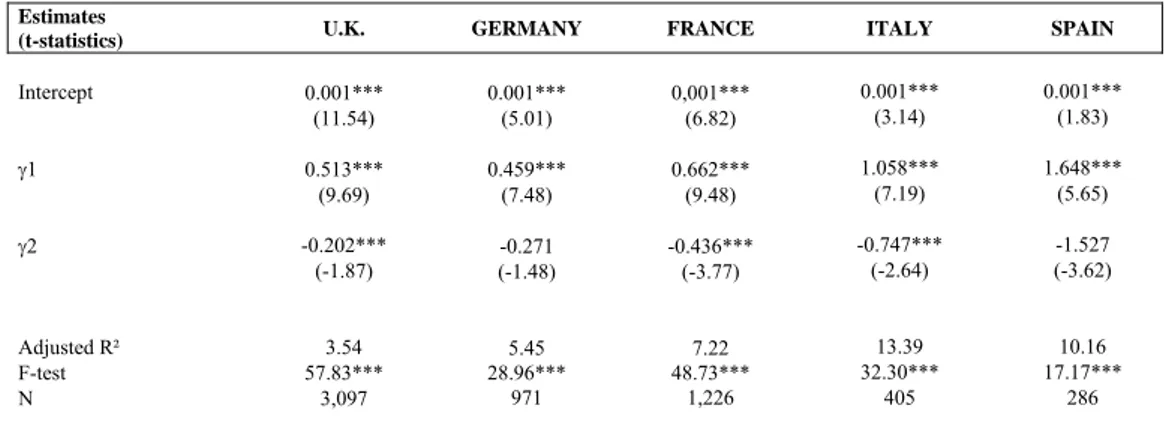
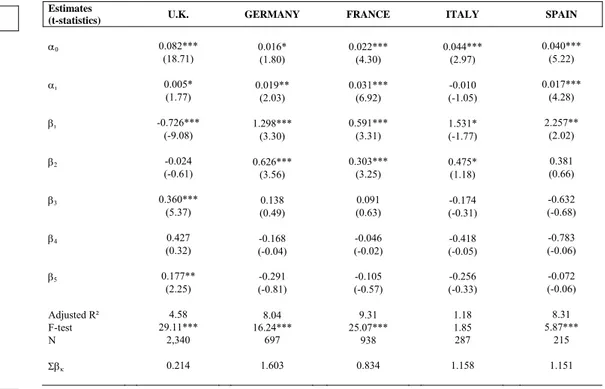
Financial performance model. Panels A, B and C of Table 3 exhibits the White-corrected OLS estimates from model (2). These results show that OLS estimates are all statistically significant at the conventional levels (except γ2 in model (2a) in Germany and Spain and in
model (2c) in Germany and France). Adjusted R² are similar to the ones presented by the accounting literature dealing with earnings coefficient response, spreading from 3.53 up to 13.39 across the country samples. Besides, coefficients γ2 is negative in 14 out of 15
regressions, suggesting that investors while constructing their portfolios tend to penalize firms investing intensively in intangibles. This short-term investment perspective or myopic view has been widely documented by authors (see for instance Porter (1992) and Hall (1993)). Accordingly, these authors argue that investors commonly seek short-term benefits and consequently dropped out from their portfolios firms exhibiting high intangible investments since these resources will only create firm value over a long-term window. This hypothesis could explain the negative and significant value of the intangible investment response coefficients (i.e. γ2 ) exhibited in Table 4.
INSERT TABLE 3 ABOUT HERE
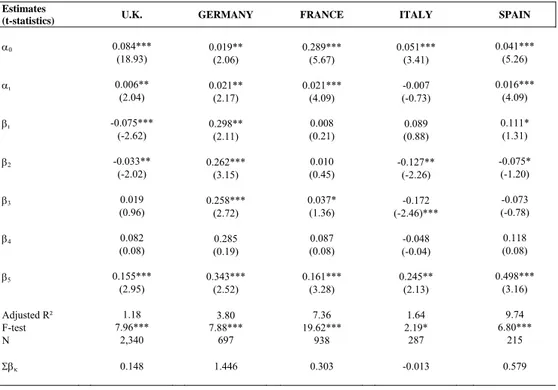
Operating performance model. Panels A, B and C of Table 4 exhibit the OLS estimates and statistics of model (4) based on an Almon’s (1965) second degree polynomial transform. Across samples, adjusted R²s spread from 0.35 to 9.74. From Table 4, three comments can be made: (1) Recognized intangibles can be significantly and positively linked to an increase in
the operating income to sales ratio at lag 5 in all the country samples. Besides, from an operating performance perspective, Germany and France appear to benefit from a better accounting recognition rule for intangibles since intangible investments can be clearly linked to better operational performance in the short, mid and long-term.
(2) Similarly to recognized intangible, investment in reported goodwill impacts positively and significantly, in all country samples, the operating performance with a 5-year delay. In the UK and German samples, this variable also influence positively the operational performance in the short-term (from lag 2 to 5) suggesting that the UK and German local GAAPs allow better goodwill recognition in terms of operational performance and / or UK and German listed firms tend to recognize more efficiently goodwill since Panel B of Table 2 shows that they tend to recognize less goodwill than their EU continental counterparts.
(3) Finally, the reported R&D expenses seem to be positively and significantly correlated with operational profit on the short-term in all the samples except in the UK although lag 3 and 5 can be positively and statistically linked to operating performance in this sample. This result would suggest that U.K. accounting standards dealing with R&D expenses are consistent as they do not allow for the capitalization of R&D except when the project is clearly planned and established.
The last line of each sub-table exhibits the sum of all OLS estimates for intangible investments, summing up the total impact of a one-monetary unit invested in intangibles on the firm operating profit over a five-year period.
INSERT TABLE 5 ABOUT HERE
This last line is individually reported in Table 5 in order to ease the comparisons amongst countries. Table 5 indicates that RII whether made in intangible assets, goodwill or R&D
expenses is positively linked to operating performance in all five countries (except for intangible assets in Italy where the impact is negative but close to zero).
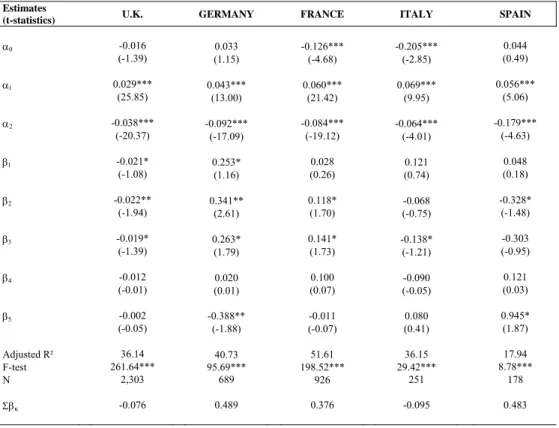
Competitive performance model. Panels A, B and C of Table 6 exhibit the OLS estimates and statistics of model (5) based on an Almon’s (1965) second degree polynomial transform. Across country samples, adjusted R²s spread from 17.94 to 51.61. Coefficients α1 and α2,
estimates respectively of the natural of logarithm of the total number of employees and competitors are, for each model, statistically significant (p<.01). Thus, on the one hand, the number of employees seems to be positively correlated to a firm’s market share. This would bring support to the hypothesis formulated by Ulrich and Smallwood (2004) that labour force is a major determinant of a firm’s market share within a specific industry. However, as stated before, it should be noted that this variable could be also used as a proxy for firm size. On the other hand, the total number of competitors is logically negatively correlated with a firm’s market share.
Regarding the recognized intangible investments variables, lagged variables happen to be much less explicative than they were in previous models. As a whole, only 19 lags out of 60 are statistically significant (for the intangible assets investment, lags 1, 2 and 3 in UK and Germany (and lag 5), lag 3 in France and Italy, lag 2 and 5 in Spain; for the goodwill stock investment, lag 2 in UK, lags 2, 3 and 5 in Germany and Spain; and lag 3 in Italy). However, it is noteworthy that βk estimates are globally positive although not significant in Germany (9
estimates over 15) and France (10 estimates over 15). These estimates appear to be negative in Italy (9 over 15) and the UK (13 over 15). One possible explanation would be that, ceteris paribus, market competition is much more intense on the French and German markets and consequently intangible investments tend to be more efficient in these settings since theses countries’ accounting standards are more flexible (see Nickell, 1996).
Moreover, Table 6 shows that 3 lags of intangible assets investments have a positive and statistically significant impact. Results are globally similar amongst the different country samples.
INSERT TABLE 6 ABOUT HERE
7. Robustness checks
Three major concerns about our findings can be raised: the periodical effects, the industry effects and the common denominator bias documented by Lev and Sunder (1979).
7.1. Control for periodical effects
In order to test the impact of this periodical and year effect on our results, dummy variables for years and periods (1993-1998 and 1999-2004) were introduced into the previous models. The results indicate that the dummy variables are statistically significant although the coefficients’ signs of the estimators are not impacted for all the three models.
7.2. Control for industry effects
Similarly to the preceding control, dummy variables for one-digit SIC industries were introduced into our models. Unreported results show that industrial variables for the following ((2) Food, textile and chemicals, (3) Manufacturing and (5) Wholesale and retail trade) in France, ((2) Food, textile and chemicals, (3) Manufacturing, (4) Transportation) Spain impact significantly and positively the models’ outcomes (except for the Spanish sample the competitive advantage model is impacted negatively). Concerning Germany and the UK, the SIC industries ((3) Manufacturing and (7) Lodging and entertainment) influence negatively the firm share return, positively the firm operating income and positively the
7.3. Common denominator bias
Models 2 and 4 both use variables scaled by a common denominator (Pjt-1 in (2), SALESjt-1 in
(4)). As noted by Lev and Sunder (1979), these models may be biased by false correlations due to the presence of a common denominator across the dependent and independent variables as the denominator is not a exogenous variable on its own.
In order to test the robustness of models 2 and 4, the variables 1/Pt-1 and 1/ SALESjt-1 were
respectively introduced in model (2) and (4). The test’s results indicate that the estimates’ signs are not influenced for all the samples. However, it is interesting to note that the presence of a common denominator in the models slightly increase the adjusted R² on average (+3.7% for the UK, +2.5% for Germany, +3.2% for France, and +5.0% for Italy and Spain,).
8. Conclusion
Authors (e.g. Hand and Lev, 2004; Henning, Lewis and Shaw, 2000) widely claim that intangibles are increasingly becoming the major drivers of firm value and performance in most economic sectors, although the benefits from reporting and communicating on these assets to external parties have not gained much attention from managers and standard setters (Lev, 2001). However, numerous empirical researches (e.g. Sougiannis, 1994; Lev and Zarowin, 1998; Lev, 2004; Villalonga, 2004) keep on arguing that accounting indicators for intangible investments, although incomplete and inaccurate, are still useful, informative and value-relevant to external and internal parties but may depend on the accounting treatment used to recognize intangibles.
Following this, this study investigates whether European firms reporting under domestic GAAPs exhibit major differences while examining the relationship between their economic (financial, operating and competitive) performance and their recognized intangible investment (RII). Using a four-representative-European-country (i.e. France, Germany, Italy, Spain and
U.K.) dynamic data panel, we investigate whether intangible accounting numbers in these different settings can be significantly linked, during the pre-IFRS compliance period 1993-2004, to the following performance triptych: financial, operational and competitive performance. Reported intangible investment is measured herein by three accounting proxies: the change in goodwill stock, the change in reported intangible assets stock and the research and development (R&D) expenditures. Besides, both measures of stock are based on the Griliches’ (1981) stock equation.
Assuming UK GAAPs intangible requirements are, over the period of analysis, the closest to the IFRS setting, we examine independently each national accounting design and gauge their differences in terms of firm performance regarding the UK framework as a sensible benchmark.
Based on the accounting valuation setting widely documented by Sougiannis (1994) and Lev and Sougiannis (1996), our findings bring us towards the following three concerns:
(1) Firstly, in any stock market under scope, we do find clear evidence that while constructing their investment portfolios investors adopt a short-term perspective or “myopic view” by precluding firms from reporting high intangible investment in their financial statements. (2) Secondly, regardless the national GAAP under consideration, we do not find any evidence that reported intangible investments underpin a better competitive position inside a specific market. This result could result from the relationship between recognized intangibles and the firms’ competitive advantage that is held constant in this study.
(3) Finally, our results clearly support the idea that Latin accounting frameworks, while opposed to Anglo-Saxon settings and subsequently to International disposals, ease the relationship recognition occurring between intangibles and the firm operational performance. This last result would suggest that IAS implementation could lead to disconnect progressively operating margins from recognized intangibles since their valuations are, under IFRS, overall
market-oriented. As a consequence, this latter finding would challenge the widespread claim that IAS produce higher-quality financial reporting about the firms’ operating activities.
1 5 0 1 * * ( ) ( 1) 1 ( ) / t ( / ) jt jt jt j k j t k j t k jt k R BPA I P I P END NOTES
1 In a US-based study, Nakamura (2004) reports that firms’ annual raw intangible investments have
progressively increased from 4.4% of the GDP in 1978 up to 10.5% in 2000, leading to a yearly increasing rate close to 4%.
2
Consistent with prior studies, usefulness is defined here as the relative information content and incremental information content of an accounting figure. Value-relevance is understood as any public or private information that does significantly impact a firm stock price (Beaver, 1981). Finally, informativeness is defined as the extent to which accounting information disclosures are value-relevant and useful.
3 The accounting literature has extensively examined the value relevance, usefulness and informativeness of
accounting information through the statistical association between various performance measures and accounting numbers. Differently said, one possible economic consequence of accounting information disclosure is directly linked to the change in firm performance. This study uses the explanatory power of examined accounting items for firm performance (i.e. R² statistic) to investigate their usefulness for external parties (e.g. investors) while value-relevance is determined by the OLS estimators’ significance. Informativeness is a combined view of the two preceding concepts.
4 The term “recognized” is preferred here to the term “reported” since our analysis is focused on the accounting
items exclusively exhibited on the face of the financial statements (i.e. excluding the footnote disclosures).
5 See Cañibano et al (2000) for a comprehensive literature review on that topic.
6 Unlike many previous studies, Villalonga (2004) uses a relatively important panel of variables in order to
capture the firm intangible resources including total intangible assets as scale by total assets, the goodwill stock, the R&D expenses stock, the advertising expenses and the amount of other intangibles assets as scaled by firm total sales.
7 A rate of 10% (i.e. equivalent to a 10-year useful period) is here assumed. However, robustness tests
performed with rate of 15% and 20% exhibit similar results.
8 Another possible version of this model consists in including intangible investments lags to examine the intangible effects over time :
γ γ − φ − − − ε
=
= + + +∑ + (3)
However, including in this study such a model would be redundant and inconsistent with model (4) and the Fama’s efficient market hypothesis as the endogenous variable of model (3) are the model (2)’s exogenous variables (for a discussion on this point see Lev and Zarowin, 1998).
9 Financial variables have also been collected for 1992 in order to increase by one unit the model (2)’s degree of
freedom since independent variables are changes in accounting variables.
10 Under Lev’s (2001) perspectives, economic benefits are assimilated to a firm’s operating income standardized
by its total sales.
11 Lev and Zarowin (1998) prescribe to apply to each of these coefficients a discount rate before summing them
up. In this study, we choose to follow Sougiannis’ (1994) simpler method which consists in ignoring the discount rate and any related empirical costly hypotheses.
12 Concerning the Almon (1965) polynomial transform implementation, the SAS software only proposes a
ready-to-use Almon (1965) procedure for time-series data. Consequently, a dynamic panel data Almon routine was programmed under SAS IML language.
13 For a discussion on the “data-construction” procedures applicable to R&D expenditures, see Villalonga (2004:
227).
References
Almon, A. 1965. “The distributed lag between capital appropriations and expenditures”. Econometrica, 33: 178-96.
Alexander D. and Archer S. 1996. "Goodwill and the difference arising on first consolidation", The European Accounting Review, vol.5, n°2:243-69.
Al-Horani A., Pope P. F. and Stark A. W. 2003. "Reaserch and development activity and expected returns in the United Kingdom", European Finance Review, 7: 27-46.Almon, A. 1965. “The distributed lag between capital appropriations and expenditures”. Econometrica, 33: 178-96.
Anderson, T.W., Hsiao, C. 1982. “Formulation and estimation of dynamic models using panel data”. Journal of Econometrics, 18: 47-82.
Beaver, W. 1981. Financial reporting: an accounting revolution. Prentice-Hall Contemporary, Englewood Cliffs, N.J.: Prentice-Hall.
Bublitz, B., Ettredge, M. 1989. “The information in discretionary outlays: advertising, research and development”. The Accounting Review, 64: 108-24.
Cañibano, L., García-Ayuso, M., Sánchez, P. 2000. “Accounting for intangibles : a literature review”. Journal of Accounting Literature, 19: 102-30.
Cazavan-Jeny A., Jeanjean T. 2006. "The negative impact of R&D capitalization: a value relevance approach", European Accounting Review, Mai, vol. 15, n° 1: 37-61.
Chan, L., Lakonishok, J., Sougiannis, T. 2001. “The stock market valuation of research and development expenditures”. Journal of Finance, 56(6): 2431-56.
Chauvin, K., Hirschey, M. 1993. “Goodwill, profitability, and market value of the firm”. Financial Management, 4: 128-40.
Cockburn, I., Griliches, Z. 1988. “Industry effects and apropriability measures in the stock market’s valuation of R&D and patents”. American Economic Rewiew, vol. 78, n°2: 419-23.
Ding Y., Stolowy H. and Tenenhaus M. 2007. "R&D Productivity: An exploratory international study", Review of Accounting and Finance, vol. 6, n° 1: 86-101.
Egginton, D.A. 1990. “Towards some principles for intangible asset accounting”, Accounting and Business Research, Vol. 20, N°79: 193-205.
FASB (Financial Accounting Standards Board). 1974. Accounting for research and development costs. Statement of Financial Accounting Standards n°2, Stamford, CT. Grabowski, H., Mueller, D. 1978. “Industrial research and development, intangible capital
stocks and firm profit rates”. Bell Journal of Economics, 9: 328-43.
Griliches, Z. 1981. “Market value, R&D, and patents”. Economic Letters, 7: 183-87.
Hall, R. 1990. The manufacturing sector master file, 1959-1987. Working paper n°3366, National Bureau of Economic Research, Cambridge, MA.
Hall, R. 1993. “The stock market’s valuation of R&D investment during the 1980’s”. American Economic Review, 83: 259-64.
Hall, R. 2001. “The stock market and capital accumulation”. The American Economic Review, 91(5): 1185-202.
Hand, J.R.M., Lev, B. 2004. Intangible Assets: Values, Measures, and Risks, Oxford University Press, 537p.
Henning S.L., Lewis B.L. and Shaw W.H. 2000. "Valuation of the Components of Purchased Goodwill", Journal of Accounting Research, vol. 38, n°2: 375-386.
Heckman, J.J. 1978. “Dummy endogenous variables in a simultaneous equation system”. Econometrica, 46(4): 931-59.
Hirschey, M. 1982. “Intangible capital aspects of advertising and R&D expenditures”. Journal of Industrial Economics, 30(4): 375-90.
Hoegh-Krohn, N.E. Knivsfla, K.H. (2000). “Accounting for intangible assets in Scandinavia, the UK, the US, and by the IASC: Challenges and a Solution”, The International Journal of Accounting, Vol. 35, N°2: 243-65.
Itami, H. 1987. Mobilizing invisible assets. Harvard University Press, Cambridge, M.A. Johnson, J. 1967. “A consequential approach to accounting for R&D”. Journal of Accounting
Research, 3: 164-72.
Kallapur S. and Kwan S. 2004. "The value relevance and reliability of brand assets recognized by UK firms", The Accounting Review, vol. 79, n°1: 151-73.
Lev, B. 2001. Intangibles: Management, measurement, and reporting. Brookings Institute Press, Washington D.C., 150 p.
Lev, B. 2004. “Sharpening the intangibles edge”. Harvard Business Review, June, 82 (6): 109-16.
Lev, B., Sougiannis, T. 1996. “The capitalization, amortization, and value-relevance of R&D”. Journal of Accounting and Economics, 21: 107-38.
Lev, B., Sunder, S. 1979. “Methodological issues in the use of financial ratios”. Journal of Accounting and Economics, 1: 187-210.
Lev, B., Zarowin, P. 1998. The market valuation of R&D expenditures, Working paper, New York Stern University, New York.
Lin, S. 2006. “Testing the information set perspective of UK financial reporting standard n°3: Reporting financial performance.” Journal of Business Finance and Accounting, 33 (7-8), September-October: 1110-1141.
McGahan, A.M. 1999. “The performance of U.S. corporations: 1981-1994”. Journal of Industrial Economics, 47: 373-98.
Morck, R., Yeung, B. 1991. “Why investors value multinationality.” Journal of Business, April: 165-87.
Mortensen, J., Eustace, C., Lannoo, K. 1997. Intangibles in the European economy, Working paper, University of Brussels, Brussels.
Muller III K. A. 1999. "An examination of the voluntary recognition of acquired brand names in the United Kingdom", Journal of Accounting and Economics, 26: 179-91.
Nakamura, L. 2004. What is the U.S. gross investment in intangibles? (At least) one trillion dollars a year! Federal Reserve Bank of Philadelphia’s Paper, printed in Hand, J.R.M.and Lev, B. 2004. Intangible Assets: Values, Measures, and Risks, Oxford University Press, 537p.
Nickell, S. 1996. “Competition and corporate performance”. Journal of Political Economy, 104: 724-46.
Nixon, B. 1997. "The accounting Treatment of research and development expenditure: views of UK compagny accountants", The European Accounting Review, vol.6, n°2: 265-77. Ohlson, J. 1995. “Earnings, book values and dividend in security valuation”. Contemporary
Accounting Research, Spring: 661-87.
Ohlson, J., Penman, S. 1992. “Disaggregated accounting data as explanatory variables for returns”. Journal of Accounting, Auditing, and Finance, Fall: 553-73.
Porter, M.E. 1992. “Capital disadvantage: America’s failing capital investment system”. Harvard Business Review, 70: 65-82.
Powell, S. 2003. "Accounting for intangible assets: current requirements, key players and future directions", European Accounting Review, vol 12, Issue 4 : 797- 811.
Ramb F. and Reitzig M. 2005. "Comparing the value revelance of R&D reporting in Germany: standard and selection effects". Discussion Paper Series 1: Economic Studies, Deutsche Bundesbank, n° 36.
Schankerman, M. 1981. “The effects of double counting and expensing on the measured returns to R&D”, Review of Economics and Statistics, 63: 454-58.
Sougiannis, T. 1994. “The accounting based valuation of corporate R&D”. The Accounting Review, 69(1): 44-68.
Stolowy, H., Cazavan-Jeny A. 2001. "International accounting disharmony: the case of intangibles", Accounting, Auditing and Accountability Journal, vol. 14, n° 4: 477-96. Stolowy, H., Haller A. and Klockhaus V. 2001. "Accounting brands in France and Germany
compared with IAS 38 (intangible assets). An illustration of the difficulty of international Harmonization", The International Journal of Accounting, vol. 36, n°2: 147-67.
Ulrich, D., Smallwood, N. 2004. “Capitalizing on capabilities”, Harvard Business Review, 82 (6): 119-27.
Villalonga, B. 2004. “Intangible resources, Tobin’s Q, and sustainability of performance differences”, Journal of Economic Behavior and Organization, 54: 205-30.
Exhibit 1. Comparison between the evolution of the production costs to total sales ratio and the R&D investments to total sales ratio for US firms during the period 1977-2000.
40% 45% 50% 55% 60% 65% 70% 1978 1980 1982 1984 1986 1988 1990 1992 1994 1996 1998 2000 Percentage 0 200 400 600 800 1000 1200 1400 1600 1800 2000 Billions of USD
Production Costs (as a % of Total Sales) R&D investments
Table 1: Sampling Process and Sample Breakdown by country and SIC industry
Panel A: Sampling process
UK Germany France Italy Spain Total
Number of companies 2,293 1,025 864 295 150 4,627
Number of financial and utility
companies 787 281 152 82 52 1,354
Sub-total 1 1,506 744 712 213 98 3,273
Number of early adopters over the
1994-2004 period 0 162 7 1 0 170
Sub-total 2 1,506 582 705 212 98 3,103
Number of companies with
missing variables 913 449 503 124 60 2,049
Final sample 593 133 202 88 38 1,054
Number of firm-year observations
Model 1 3,097 971 1,226 405 286 5,985
Model 2 2,340 697 938 287 215 4,477
Model 3 2,303 689 926 251 178 4,347
Panel B: Sample breakdown by country and one-digit SIC industry
SIC1 Industry Description UK Germany France Italy Spain Total
N % N % N % N % N % N %
0 Agricultural 5 1% 0 0% 2 1% 0 0% 0 0% 7 1%
1 Mining and construction 58 10% 3 2% 11 5% 2 2% 9 24% 83 8%
2 Food, textiles and chemicals 95 16% 28 21% 39 19% 16 18% 5 13% 183 17%
3 Manufacturing 131 22% 60 45% 52 26% 28 32% 9 24% 280 27%
4 Transportation 35 6% 7 5% 17 8% 16 18% 3 8% 78 7%
5 Wholesale and retail trade 94 16% 18 14% 36 18% 9 10% 6 16% 163 15% 7 Lodging and entertainment 122 21% 11 8% 40 20% 17 19% 4 11% 194 18%
8 Services 53 9% 6 5% 5 2% 0 0% 2 5% 66 6%
Total All sectors 593 100% 133 100% 202 100% 88 100% 38 100% 1054 100% Table 1 presents the sampling methodology used in the study and a breakdown of the final sample by country and one-digit SIC industry. Firms included in the final dataset are the ones whose financial and accounting variables used in the modelling process are available respectively under DataStream and WorldScope. We exclude from the final sample financial and utility companies, i.e. firms with SIC Codes between 6000-6999 (financial institutions), and 9100-9199 (government and utility companies) and early IFRS adopters using the WorldScope item (WC07536) “Accounting Standard Followed”.
Exhibit 2: Evolution of Recognized Goodwill (in % of Total Assets) by country sample over the period 1992-2004
Exhibit 4: Evolution of R&D Expenditures (in % of Total Sales) by country sample over the period 1992-2004
0,0% 2,0% 4,0% 6,0% 8,0% 10,0% 12,0% 1992 1993 1994 1995 1996 1997 1998 1999 2000 2001 2002 2003 2004 France Italy UK Spain Germany 0,0% 2,0% 4,0% 6,0% 8,0% 10,0% 12,0% 1992 1993 1994 1995 1996 1997 1998 1999 2000 2001 2002 2003 2004 France Italy UK Spain Germany
Exhibit 3: Evolution of Recognized Intangibles (in % of Total Assets) by country sample over the period 1992-2004
2,0% 4,0% 6,0% 8,0% 10,0% 12,0% 14,0% 16,0% France Italy UK Spain Germany