Paper ID: 189, Page 1
SIZING AND PARAMETRIC OPTIMIZATION OF A WASTE HEAT TO POWER
PLANT BASED ON TRANSCRITICAL ORGANIC RANKINE CYCLE
Van Long Le1*, Michel Feidt2, Abdelhamid Kheiri2, Vincent Lemort11University of Liège
Chemin des chevreuils 7, 4000 Liège, Belgium E-mail: vanlong.le@ulg.ac.be
2University of Lorraine
2 Avenue de la Forêt de Haye, 54518 Vandœuvre-lès-Nancy, France
* Corresponding Author
ABSTRACT
In recent years, the transcritical (also called supercritical) organic Rankine cycle (Trans-ORC) has more and more aroused the attention for power generation from low-temperature heat source thanks to the better thermal matching between the heating and the cooling fluids of the high pressure heat transfer process. The absence of isothermal evaporation in transcritical ORC enables the heat source to be cooled down to a lower temperature despite an identical pinch point as in a comparable subcritical cycle. This leads to a greater utilization of the heat source. In other words, the transcritical cycle could produce more power with higher exergy efficiency compared to the subcritical one. This paper aims at sizing a transcritical ORC to recover energy from a cooling circuit of turbine exhaust gas and optimizing the operating conditions of the cycle from a thermoeconomic point of view. Indeed, several potential organic fluids, which satisfy the screening criteria (e.g. safety, environment, thermophysical properties and availability), will be used as working fluid to evaluate the performance and the specific investment capital (SIC) of the plant. The operating conditions (i.e. turbine inlet temperature and pressure, condensing temperature and heat sink outlet temperature) of the plant will also be optimized to find out the most suitable working fluid for the studied cycle.
1. INTRODUCTION
Capturing and converting industrial waste heat into electricity is currently of a great concern. This not only improves energy efficiency of the industrial processes, but also reduces the thermal pollution caused by direct release of this heat into the environment. Over recent years, the transcritical ORC has aroused more and more attention for power generation from low-temperature heat source thanks to its advantages such as higher performance and less irreversibility. In a base Trans-ORC, the working fluid is first compressed above its critical pressure from sub-cooled liquid state (in the present work, the working fluid is assumed exiting the condenser in saturated liquid state). The working fluid is then heated, without isothermal phase change, by an external heat source (e.g. pressurized hot water) in high-pressure heat exchanger. In next step, the working medium releases its energy to drive the turbine blades during expansion process. The working fluid exits the turbine at superheated state, and is cooled down and then condensed by ambient air (dry cooling) or cooling water (wet cooling) before being pumped again to high pressure.
This work aims at sizing and then optimizing a small scale Trans-ORC to recover energy from a cooling circuit of turbine exhaust gas of a CHP (Combined Heat and Power) plant from landfill gas. According to the power range, the ORC systems could be categorized into (Vanslambrouck et al., 2011): micro-systems (0.5 – 10 kWel), small systems (10 – 100 kWel), medium systems (100 – 300 kWel) and large systems (300 – 3000 kWel or more). The process flow diagram and heat source and sink parameters for studied Trans-ORC are presented in Figure 1.
Paper ID: 189, Page 2
Figure 1: Process flow diagram
2. WORKING FLUID PROPERTIES
In practice, R134a and CO2 are often used as working fluid for Trans-ORC. Although CO2 has manydesirable characteristics such as high thermal and chemical stability, low environmental impact, low cost and abundance in nature, the 80-160 bars operating pressure of the CO2 transcritical cycle raises
safety concerns. Therefore this medium is not taken into account in this study. Indeed, many factors could influence the selection of working fluid for any particular application including the ORC one. Many criteria have been proposed to find the best balance between working fluid properties, system architecture and application environment (cf. Figure 1).
Figure 2: Factors influencing working fluid selection (Horn, 2011)
Some potential pure fluids, whose properties are available in the REFPROP database, are investigated as working medium. Those fluids satisfy selection criteria, i.e. GWP less than or equal to R134a GWP, critical temperature less than 115oC, maximum applicable temperature greater than 150OC, zero
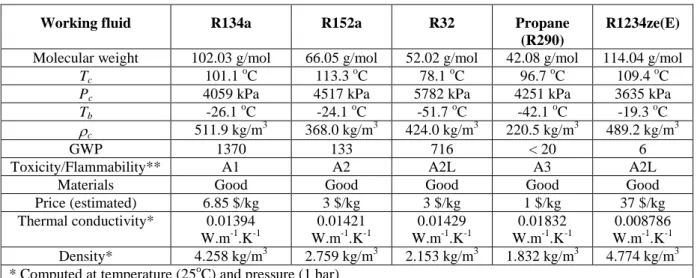
ODP, non-toxic and acceptable critical pressure. The thermophysical properties of the selected working fluids are computed by REFPROP (Lemmon et al., 2013) using Coolprop-EES interface (Bell et al., 2014). Some practical data of those working fluids are presented in Table 1.
Paper ID: 189, Page 3
Table 1: Working fluid data
Working fluid R134a R152a R32 Propane
(R290)
R1234ze(E) Molecular weight 102.03 g/mol 66.05 g/mol 52.02 g/mol 42.08 g/mol 114.04 g/mol
Tc 101.1 oC 113.3 oC 78.1 oC 96.7 oC 109.4 oC
Pc 4059 kPa 4517 kPa 5782 kPa 4251 kPa 3635 kPa
Tb -26.1 oC -24.1 oC -51.7 oC -42.1 oC -19.3 oC
c 511.9 kg/m
3 368.0 kg/m3 424.0 kg/m3 220.5 kg/m3 489.2 kg/m3
GWP 1370 133 716 < 20 6
Toxicity/Flammability** A1 A2 A2L A3 A2L
Materials Good Good Good Good Good
Price (estimated) 6.85 $/kg 3 $/kg 3 $/kg 1 $/kg 37 $/kg Thermal conductivity* 0.01394 W.m-1.K-1 0.01421 W.m-1.K-1 0.01429 W.m-1.K-1 0.01832 W.m-1.K-1 0.008786 W.m-1.K-1 Density* 4.258 kg/m3 2.759 kg/m3 2.153 kg/m3 1.832 kg/m3 4.774 kg/m3 * Computed at temperature (25oC) and pressure (1 bar)
**ASHRAE classification : A: lower toxicity; B : higher toxicity ; 1: no flame propagation ; 2 : lower flammability ; 3 : higher flammability; 2L: lower flammability with a maximum burning velocity of < 10 cm/s
3. EQUIPMENT SIZING AND CAPITAL COST ESTIMATION
3.1. Equipment purchase cost estimation
This work uses cost correlations as presented in (Seider et al., 2010) for estimating free-on-board purchase cost of equipment. The base cost of major equipment is estimated using the following
2
0 1[ ( ) 2[ ( )] ... 0 A A ln S A ln S PC
e
(1) Where 0 PC is base cost of equipment, US$
A0, A1, A2, are the estimation model constants S is size factor or capacity of equipment
In addition to size, other factors, such as material of construction and operating pressure, are also taken into consideration for estimating equipment purchased cost. Therefore, the cost equations are often in the following form
0
P M p P
C F F C (2)
Where
CP is the purchase cost of equipment, US$
FM is the material factor
Fp is the pressure factor
The values of constants for base cost estimation, i.e. A0, A1, A2, … in equation (1), the material and pressure factors for estimating the purchase cost of centrifugal pump, shell and tube heat exchanger and fans are found in (Seider et al., 2010). To account for the inflation, Chemical Engineering Plant Cost Index (CEPCI), published in each monthly issue of the magazine Chemical Engineering, is used. As the cost correlations in (Seider et al., 2010) were developed using a CEPCI of 500, current purchase cost of equipment should be determined by
500
CEPCI
500
P PC
C
(3) Where 500 PC is equipment purchase cost determined with CEPCI of 500
CEPCI is the present Chemical Engineering Plant Cost Index (CEPCI = 567.3 for the year 2013)
Paper ID: 189, Page 4
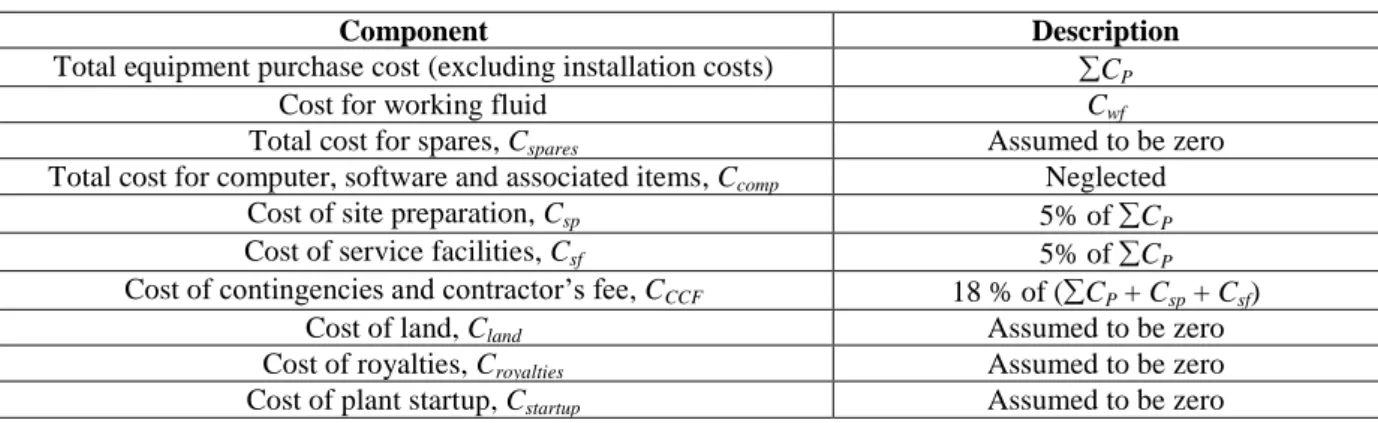
Besides purchase costs of equipment, many other costs must be accounted for plant capital investment. In this work, the total capital investment is determined to be the sum of components costs as shown in Table 2
TCI P wf sp sf CCF
C
C C C C C (4)Table 2: Components of total capital investment
Component Description
Total equipment purchase cost (excluding installation costs) CP
Cost for working fluid Cwf
Total cost for spares, Cspares Assumed to be zero Total cost for computer, software and associated items, Ccomp Neglected
Cost of site preparation, Csp 5% of CP
Cost of service facilities, Csf 5% of CP
Cost of contingencies and contractor’s fee, CCCF 18 % of (CP + Csp + Csf)
Cost of land, Cland Assumed to be zero
Cost of royalties, Croyalties Assumed to be zero Cost of plant startup, Cstartup Assumed to be zero
3.3. Equipment sizing
For estimating the purchase cost of equipment, the size or capacity of the latter must be determined. Therefore, basic equations for equipment sizing and purchase cost estimation of some other ORC components (excluding the equipment covered in previous section, i.e. shell and tube heat exchanger, centrifugal pump and fan) are presented below.
Working fluid feed pump
A Centrifugal pump, of the radial type and with an isentropic efficiency of 70%, is used to raise the pressure of Trans-ORC working fluid. The shaft power of pump is computed as
2 1
p wf
W m h h (5)
The pump motor power consumption is calculated from the pump shaft power in assuming a motor efficiency (
motor) to be 95%/
m p motor
W W
(6)Vapor generator
A general shell and tube heat exchanger with one shell pass and two tube passes is used for transferring heat from pressurized hot water to ORC working fluid. The heat rate transferred in the vapor generator is calculated as
3 2
h wf
Q m h h (7)
The heat transfer coefficient and pressure drop of fluid flowing in heat exchanger shell side (i.e. hot water) are calculated using Kern method (Kern, 1950), while the supercritical heat transfer is computed by Jackson correlation (Jackson, 2002) with the Nusselt number determined as follows
0.3
0.82 0.5
Nu
0.0183 Re
Pr
w/
C
p/
C
p n (8) Indeed, Jackson correlation was obtained by modifying the correlation of Krasnoshchekov et al. which is valid within the following range (Krasnoshchekov et al., 1967):4 5
8 10 Re 5 10 , 0.85Pr65, 0.90 w/ 1.0, 0.02Cp/Cp4.0, 0.9Tw/Tpc2.5 The index n in equation (8) depends on the values of wall tube temperature, Tw, and temperature of
supercritical fluid in relation to its pseudo-critical temperature, Tpc, as mentioned in (Jackson, 2002).
Jackson (2002) and previously, Jackson and Hall (1979) assessed the accuracy of many correlations. They found the correlation of Krasnoshchekov et al. (1967) and its modified version of Jackson (2002) to be the most accurate ones. Ninety seven percent of the experimental data were correlated with the accuracy of
25%
(Pioro and Duffey, 2007). The pressure drop of the supercritical fluidPaper ID: 189, Page 5
inside the tubes is calculated as presented in (Le, 2014). Neglecting the fouling resistance, the overall heat transfer coefficient, U, of the shell and tube heat exchanger is computed as
ln
/
1
1
2
o o i o o i i wD
D
D
D
U
D
k
(9) CondenserThe heat rejection step of Trans-ORC is not realized by a shell and tube heat exchanger like for the heat addition but an air-cooled condenser (ACC). In an ACC, the hot process fluid flows through a bank of tubes, and ambient air is blown across the finned tubes by fans. The heat transferred from ORC working fluid to ambient air via condenser is determined as follows
4 1
c wf
Q m h h (10)
The air-cooled condenser is considered with horizontal finned tube bundle. The air side heat transfer and pressure drop of ACC are calculated by the correlations of Ganguli (Ganguli et al., 1985). For tube side, Gnielinski correlation (Gnielinski, 1976) is used to calculate the heat transfer of single phase fluid, while Shah correlation (Shah, 2009) is used for the condensation in plain tube. According to the empirical correlation of Shah, there are two heat transfer regimes during the condensation in plain tube. The equations of two-phase heat transfer coefficient,
TP, for each regime are presented belowIn regime I (turbulent regime)
TP I
(11)In regime II (mixed regime)
TP I Nu
(12) Where
0.95
0.0058 0.557 1 3.8 /
/ 14
pr I LSZ
l v
(13)
1/3 3 1/3 2 1.32 Re l l v l Nu LS l g k
(14) The boundary between the regimes I and II is given by the following relation. Regime I occurs when0.62
0.98(
0.263)
v
J
Z
(15)Where Jv is the dimensionless vapor velocity defined as (Shah, 2009):
0.5 v v l v xG J gD
(16) The Shah’s correlating parameter Z is calculated as (Shah, 2009):
0.8 0.41 / 1 r
Z x p (17)
The two-phase pressure drop of the fluid flowing inside the horizontal tube is the sum of two contributions (the momentum and the frictional pressure drop) and computed as described in (Le et al., 2014). The purchase cost of air-cooled condenser is estimated from its heat transfer surface area as in the following equation:
0.4, 6466 CEPCI / 500
P ACC ACC
C A (18)
Fan motor
The fan motor power consumption is estimated by the equation (19) from pressure drop and mass flow rate of the air through the ACC. The fan efficiency,
fan, and motor efficiency,
motor, in equation (19) are assumed to be equal to 70% and 95%, respectively.air air fan
air fan motor
P m
W
Paper ID: 189, Page 6
Turbine
In the present work, the isentropic efficiency of turbine is assumed to be 85%. The shaft Power output of the turbine, where heat losses are neglected, is determined as
3 4
t wf
W m h h (20)
The purchase cost of turbine is determined as a function of its shaft power output (Seider et al., 2010):
0.81,
672.2
CEPCI / 500
P t t
C
W
(21)Electrical generator
The electrical power output of generator is determined from the turbine power output with a generator efficiency of 95%
/
gen t gen
W W
(22)The purchase cost of electrical generator is calculated by the equation as presented in (Pierobon et al., 2013)
0.95 ,60
P gen genC
W
Working fluidIn addition to the cost of equipment, the cost of working fluid must also be accounted for. In this work, the amount of working fluid is estimated as the liquid amount to fill the total volume of heat exchangers through which the working medium passes (Herrmann Rodrigues et al., 2010). The prices of tested working fluids were assumed from market surveys as shown in Table 1.
Global system
The net power output of Trans-ORC is considered as the difference between the power output of generator and the power consumption of the pump and fan motors
net gen motor fan
W W W W (23)
The thermal efficiency of Trans-ORC is calculated as the ratio between system net power output to the heat transfer rate within vapor generator
/
ORC
W
netQ
h
(24)4. OPTIMIZATION
The optimization is performed by genetic method implemented in EES software (Klein, 2013). The parameters for the optimization are presented in Figure 1. The objective function is the specific investment capital (SIC) calculated hereunder:
SIC
C
TCI/
W
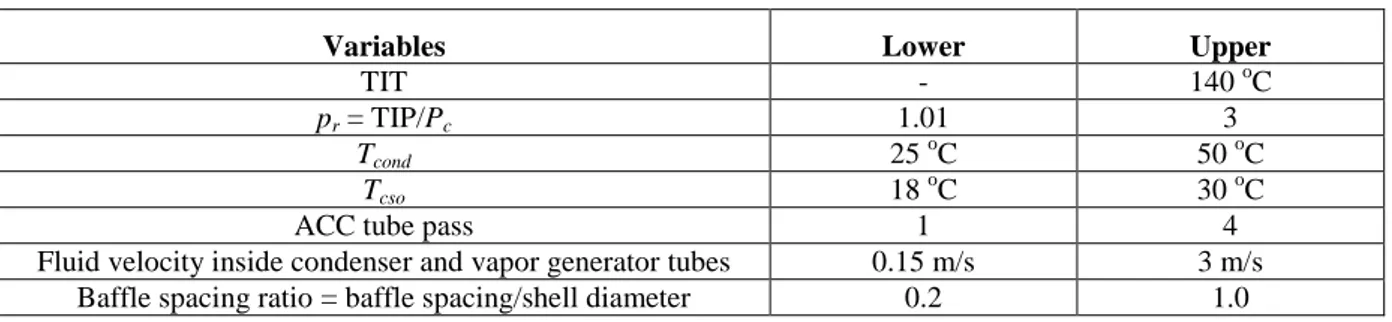
net (25) Many variables are taken into consideration for the optimization. In addition to the variable of operating conditions of the Trans-ORC, i.e. turbine inlet temperature (TIT); reduced pressure which is the ratio of turbine inlet pressure (TIP) to the critical pressure (Pc) of working fluid; condensingtemperature and heat sink outlet temperature, the other variables concerning the shell and tube heat exchanger and the air-cooled condenser are also taken into consideration (cf. Table 3).
Table 3: Variables for SIC minimization
Variables Lower Upper
TIT - 140 oC pr = TIP/Pc 1.01 3 Tcond 25 o C 50 oC Tcso 18 o C 30 oC
ACC tube pass 1 4
Fluid velocity inside condenser and vapor generator tubes 0.15 m/s 3 m/s Baffle spacing ratio = baffle spacing/shell diameter 0.2 1.0
Paper ID: 189, Page 7
During the optimization, the pinch (minimum temperature difference between heating and cooling curve) of heat transfer processes must be greater than 1oC, maximum pressure drop of fluids through heat exchangers (vapor generator and condenser) must be lower than 0.5 bar and vapor quality, x, of fluid exiting the turbine, calculated by the equation (26), must be greater than or equal to unity.
sat l,
/ sat v, sat l,
x hh h h (26)
5. RESULTS - DISCUSSION
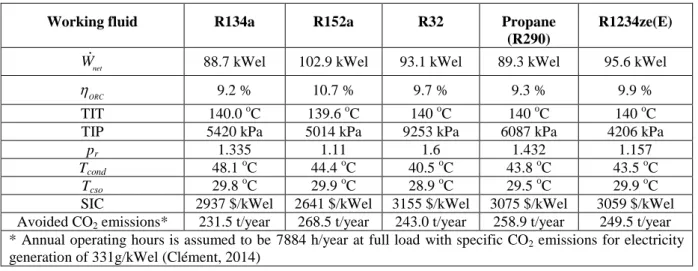
According to the optimization results (Table 4), the lowest SIC (2641 $/kWel) is found with the system using R152a, while the highest one (3155 $/kWel) is observed with R32. Indeed, the R152a-based Trans-ORC system presents many advantages, i.e. moderate investment capital, highest net power output and thermal efficiency, moderate operating pressure and low working fluid GWP. One thing can limit the use of R152a is the fact that this fluid is mildly flammable.
Table 4: Results of SIC optimizations
Working fluid R134a R152a R32 Propane
(R290)
R1234ze(E)
net
W 88.7 kWel 102.9 kWel 93.1 kWel 89.3 kWel 95.6 kWel
ORC
9.2 % 10.7 % 9.7 % 9.3 % 9.9 %
TIT 140.0 oC 139.6 oC 140 oC 140 oC 140 oC
TIP 5420 kPa 5014 kPa 9253 kPa 6087 kPa 4206 kPa
pr 1.335 1.11 1.6 1.432 1.157
Tcond 48.1 oC 44.4 oC 40.5 oC 43.8 oC 43.5 oC
Tcso 29.8 oC 29.9 oC 28.9 oC 29.5 oC 29.9 oC SIC 2937 $/kWel 2641 $/kWel 3155 $/kWel 3075 $/kWel 3059 $/kWel Avoided CO2 emissions* 231.5 t/year 268.5 t/year 243.0 t/year 258.9 t/year 249.5 t/year * Annual operating hours is assumed to be 7884 h/year at full load with specific CO2 emissions for electricity generation of 331g/kWel (Clément, 2014)
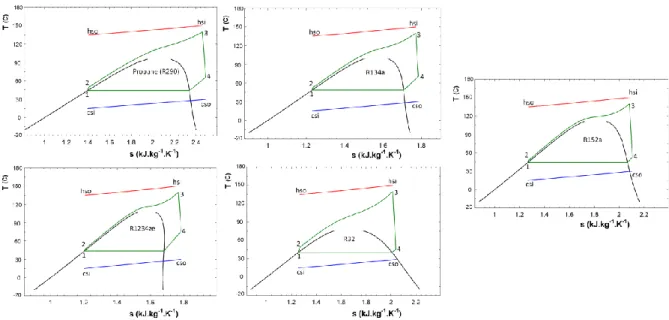
In the case of a traditional working fluid for Trans-ORC system, i.e. R134a, although the net power output and thermal efficiency are the lowest for the optimum SIC, the SIC of R134a-based system together with two other systems using propane and R1234ze are competitive. Furthermore, as shown in T-s diagrams (Figure 3) of these working fluids, they exit the turbine at highly superheated state which presents a potential to install an internal heat exchanger as recuperator for improving the cycle performance. While the higher GWP of R134a and higher flammability of propane could limit the use of these working fluids, the high cost and mildly flammability of R1234ze are the challenges for its replacement to R134a as Trans-ORC working fluid.
At the present, the commercialized ORC modules are often subcritical ones. According to the data presented in (Vanslambrouck et al., 2011), the average prices of these turbine based ORC modules, excluding the installation cost, range from 1337 $/kWel (converted from 1000 €/kWel with a 2011 yearly average exchange rate of 0.748 €/US$) for a 2 MW-unit, to 2674 $/kWel (2000 €/kWel) for a 500 kW-unit and up to 4011 $/kWel (3000 €/kWel) for a 150 kW-unit. For waste heat recovery applications, the installation costs can go from 50% to 100% of the ORC module’s cost. Comparing to these data, the studied Trans-ORC systems present a real potential for waste heat recovery application at small scale. Considering the working fluid properties presented in Table 1 and the SIC values, the greater are the critical and normal boiling temperatures, the smaller is the SIC. In the case of R1234ze, the SIC is higher than that for R134a-based Trans-ORC due to the high cost of working fluid.
The amount of annual avoided CO2 emission for the electricity generation by recovering waste heat using a Trans-ORC is presented in Table 4 for each working fluid. This amount is calculated in assuming 7884 operating hours per years at full load of power plant.
Paper ID: 189, Page 8
Figure 3: T-s diagram (green) of working fluids and temperature profile of heat source (red) and heat sink (blue) at minimum SIC
Figure 4: Repartition of purchase equipment cost of Trans-ORC (for the case of R152a)
Concerning the repartition of purchase equipment costs, the turbine and the air-cooled condenser are the most expensive components of Trans-ORC power plant (as shown in Figure 4) due to the low heat transfer coefficient and so the large required heat transfer surface area (e.g. ~11.4 m2/kWel for the case of R152a). While the investment for the air-cooled condenser is more than half of total equipment purchase cost, this value for turbine is 20 %. In the present work, the air-cooled condenser is considered with horizontal tubes. Indeed, other technologies such as A-frame and V-frame air-cooled condenser could also be considered to increase heat transfer coefficient. The other costs included in the total capital investment are presented in Table 5.
Table 5: Capital cost components (for the case of R152a)
Component Value
Total cost for equipments (excluding installation costs) 208361 $
Cost for working fluid, Cwf 948 $
Cost of site preparation, Csp 10465 $
Cost of service facilities, Csf 10465 $
Cost of contingencies and contractor’s fee, CCCF 41443 $
Total capital investment 271682 $
6. CONCLUSIONS – PERSPECTIVES
This work presents the result of Specific Investment Capital (SIC) minimization for a Trans-ORC system that converts heat from cooling circuit of a turbine exhaust gas. Some potential working fluids
Paper ID: 189, Page 9
have been considered for the optimization of the system. According to the optimization results, the most interesting fluid is R152a with the highest net power output (102.9 kWel) and lowest SIC (2641 $/kWel). However, the other fluids, i.e. R1234ze, R134a, or propane, present also the possibility to improve the performance and so the specific investment capital. The worst Trans-ORC in term of specific investment is found when R32 is used as working fluid. Indeed, this fluid operates at very high pressure (92.5 bars) to obtain a moderate net power output. For each tested working fluid, the optimum operating conditions are brought out by the mean of the SIC minimization. Regarding the repartition of purchase equipment costs, the most expensive component of Trans-ORC system is the air-cooled condenser followed by the turbine. Indeed, the condenser purchase cost contributes to more than half of the total equipment purchase cost, while the investment for the turbine excluding the electrical generator cost is of 20% of the total equipment cost.
NOMENCLATURE
D Diameter (m) C Cost (US$) p C Cp
hwh
/ TwT
(kJ.kg-1.K-1) pC
Specific heat (kJ.kg-1.K-1) g Acceleration constant (m/s2) G Mass flux (kg.s-1.m-2) h Specific enthalpy (kJ/kg)m Mass flow rate (kg/m3) k Thermal conductivity (kW.m-1.K-1)
Nu Nusselt number (–)
P Pressure (kPa)
Pr Prandtl number (–)
pr Reduced pressure (–)
Q
Heat transfer rate (kW) Re Reynolds number (–) SIC Specific Investment Capital (US$/kW)T Temperature (oC)
TIP Turbine inlet pressure (kPa) TIT Turbine inlet temperature (oC)
U Overall heat transfer coefficient (kW.m-2.K-1)
W Power (kW)
Greek letters
Heat transfer coefficient W.m-2.K-1
Efficiency (%)
Dynamic viscosity (kg.m-1.s-1)
Density kg/m3Subscript
1, 2, 3, 4 working fluid state points b normal boiling point c critical
csi/cso heat sink inlet/ outlet ex external fluid gen generator h hydraulic or hot hsi/hso heat source inlet/outlet
l/v liquid/vapeur m motor p pump sat saturation t turbine TP two phases
wf ORC working fluid
Paper ID: 189, Page 10
REFERENCES
Bell, I. H., J. Wronski, S. Quoilin and V. Lemort (2014). Pure and Pseudo-pure Fluid
Thermophysical Property Evaluation and the Open-Source Thermophysical Property Library CoolProp. Industrial & Engineering Chemistry Research 53(6): 2498-2508.
Clément, L. (2014). Final report LIFE08 ENV/B/000040 CLIM-WASTENER. Bierges, Belgium, VERDESIS SA.
Ganguli, A., S. S. Tung and J. Taborek (1985). Parametric study of air-cooled heat exchanger finned tube geometry. AIChE Symposium Series.
Gnielinski, V. (1976). New equations for heat and mass transfer in turbulent pipe and channel flow. International Chemical Engineering 16: 359-368.
Herrmann Rodrigues, L., E. Nie, A. Raza and B. Wright (2010). Low grade heat recovery. Senior Design Reports (CBE), University of Pennsylvania.
Horn, B. V. (2011). A primer on HFOs Hydrofluoro-olefins Low-GWP refrigerants. 2011 ASHRAE Winter Conference. Las Vegas, NV.
Jackson, J. D. (2002). Consideration of the heat transfer properties of supercritical pressure water in connection with the cooling of advanced nuclear reactors. 13th Pacific Basin Nuclear Conference. Shenzhen City, China.
Kern, D. Q. (1950). Process Heat Transfer, McGraw-Hill
Klein, S. A. (2013). EES: Engineering Equation Solver. Madison, F-Chart Software. Krasnoshchekov, E. A., V. S. Protopopov, F. VAn and I. V. Kuraeva (1967). Experimental
investigation of heat transfer for carbon dioxide in the supercritical region. 2nd All-Soviet Union Conference on Heat and Mass Transfer, Minsk, Belarus.
Le, V. L. (2014). Feasibility study of subcritical and supercritical organic Rankine cycles (ORCs) for waste heat recovery. Doctor of Philosophy Dissertation, University of Lorrain.
Le, V. L., A. Kheiri, M. Feidt and S. Pelloux-Prayer (2014). Thermodynamic and economic optimizations of a waste heat to power plant driven by a subcritical ORC (Organic Rankine Cycle) using pure or zeotropic working fluid. Energy 78(0): 622-638.
Lemmon, E. W., M. L. Huber and M. O. McLinden (2013). NIST Standard Reference Database 23: Reference Fluid Thermodynamic and Transport Properties-REFPROP. Gaithersburg, National Institute of Standards and Technology.
Pierobon, L., T.-V. Nguyen, U. Larsen, F. Haglind and B. Elmegaard (2013). Multi-objective optimization of organic Rankine cycles for waste heat recovery: Application in an offshore platform. Energy 58(0): 538-549.
Pioro, I. L. and R. B. Duffey (2007). Heat Transfer & Hydraulic Resistance at Supercritical
Pressures in Power Engineering Applications. Three Park Avenue New York, NY 10016-5990, ASME
Seider, W. D., J. D. Seader, D. R. Lewin and S. Widagdo (2010). Product and process design principles: synthesis, analysis, and evaluation, John Wiley.766
Shah, M. M. (2009). An Improved and Extended General Correlation for Heat Transfer During Condensation in Plain Tubes. HVAC&R Research 15(5): 889-913.
Vanslambrouck, B., I. Vankeirsbilck, S. Gusev and M. De Paepe (2011). Turn waste heat into electricity by using an Organic Rankine Cycle. 2nd European conference on Polygeneration Tarragona, Spain.
ACKNOWLEDGEMENT
The authors thank the French National Research Agency (ANR-10-EESI-001) who has funded the work reported in this paper.