Marco Di Gennaro,1,∗ Srijan Kumar Saha,1,† and Matthieu J. Verstraete1
1Department of Physics, Universit´e de Li`ege, B-4000 Li`ege, Belgium
and European Theoretical Spectroscopy Facility (www.etsf.eu)
In the 32-119 GPa pressure range and at room temperature, a simple cubic phase was reported for calcium in many different experiments. Standard linear response theory, both within density functional perturbation theory and frozen phonon calculations, presents dynamical instabilities for the simple cubic structure in the whole pressure range. Many other possible candidate phases, as well as several possible stabilization mechanisms for the simple cubic phase, have been proposed as the result of ab-initio predictions but the role of temperature on the relative stability of the different phases has not been systematically investigated. We revisit the stability of the three most important candidate phases of calcium for the intermediate pressure range and for various temperatures, taking explicitly into account thermal corrections relative to electronic as well as phononic entropy and anharmonic contributions. This corrects the discrepancies among previous theoretical results and experiments, and presents a different picture of the temperature driven phase transition, which results from dynamical anharmonic stabilization of simple cubic and de-stabilization of the tetragonal phase.
The past decade has seen a complete transformation of the field of high pressure materials science [1]. The sys-tematic application of diamond anvil cell techniques to elemental solids [2,3] has revealed that no solid is simple and even a seemingly simple metal can show an extremely complex and diverse sequence of structural phase transi-tions under pressure and/or temperature. The standard method for analyzing these phase transitions is the com-parison of experimental results with density functional theory (DFT) calculations of the electronic and phononic free energy, in order to understand the structure, dynam-ics and thermodynamdynam-ics. The case of calcium has proven to be a deeply challenging problem for theory. X-ray dis-persion analysis [4–9] showed a series of pressure-induced structural phase transitions at room temperature, with a face centered cubic (f cc) structure at 0 GPa, body cen-tered cubic (bcc) at 19 GPa and simple cubic (sc) at 33 GPa. The CaIV, CaV, CaVI and CaVIII phases have been discovered more recently [7, 8, 10, 11] with non closed-packed structures, which are not yet fully deter-mined by experimental analysis. At least one extra phase (orthorhombic CaIII0) [8, 9, 12] exists for low tempera-ture (T<30 K) and for 39<P<42 GPa. A orthorhombic distorted sc structure (Cmmm) was proposed as a candi-date structure for this new phase [8,9, 12], even though a satisfactory theoretical description of this phase and of its stability properties is still missing. Very recently, doubts have been raised even in experiments regarding the structure of CaIII phase, which was claimed to be a rhombohedral distortion (R¯3m) of the simple cubic struc-ture in Ref. [9].
Several recent theoretical studies [12–24] have ac-counted for the dynamical (phonon) or thermodynami-cal (free energy) stability of the sc-Ca phase with many different methods. Standard theoretical methods com-pletely fail to reproduce the intermediate-pressure (20-60 GPa) phase diagram [16, 19, 21, 23, 24], stabilizing
other phases instead of sc (cfr. supplementary infor-mation - SI) which is found to be dynamically unsta-ble in harmonic theories [18–20]. Two distinct mecha-nisms were so far investigated to solve this discrepancy: (i) the inclusion of anharmonic effects in the phonon fre-quencies of the system either using molecular dynamics (MD) [17, 23], meta-dynamics [13], or explicitly anhar-monic phonon calculations [12, 20]. These techniques can stabilize the vibrational spectrum and/or favor the free energy of one phase over another. Tse et al. have found that sc-Ca becomes stable around 200 K with dy-namical fluctuations to local tetragonality [12], but the same authors exclude on experimental grounds that Ca-III0can have a tetragonal structure; (ii) the use of
Quan-tum Monte Carlo (QMC) [23] combined with DFT-GGA MD. This corrects the electronic internal energy of sc-Ca, which is stabilized with respect to I41/amd by quite
large exchange-correlation effects beyond DFT, indepen-dently of entropic effects. Very recently, more attention was given to the possibility of solving the problem by the use of a hybrid functional method, using for example the PBE0 or HSE functionals [25], which can stabilize phonon frequencies for the I41/amd phase, but phonon
temperature dependence was not considered in this work. The situation is not easy to disentangle, as the meth-ods used vary in each study, and they are not always applied to phases other than sc-Ca. In some cases, the (electronic) free energy of a dynamically unstable phase was used as a reference for stability comparisons. In other cases, the ergodic convergence of MD studies can be dif-ficult to assess, and some explicitly anharmonic methods only include lower (third and fourth) order anharmonic-ities [20]. A systematic study of anharmonicity for dif-ferent phases, pressure and temperatures does not exist to our knowledge and the origin of the calcium phase transition to sc is still uncertain: is the structure favored energetically with respect to other stable phases, or is it
simply the only phase which preserves phonon and elastic stability in the medium pressure range?
In this Letter, we calculate the fully anharmonic phonon spectrum, renormalized to infinite order using the self-consistent ab-initio lattice dynamical (SCAILD) method [26–28], for all the relevant phases (sc, I41/amd,
and Cmmm) of calcium in the pressure range from 30 to 50 GPa. This allows the first systematic and consis-tent comparison of both dynamical and thermodynamical stability effects among these phases. We show that dy-namical instabilities are the main limiting factor for the phase diagram and that anharmonicities have opposite effects on different phases. They can have weak effects on the vibrational spectra (as for Cmmm) but can also stabilize (as for sc) or even can destabilize a phase (as for I41/amd) at elevated temperature. The QMC [23]
reduction of the internal energy of sc respect to I41/amd
and Cmmm is therefore not the determining factor sta-bilizing sc since I41/amd and Cmmm are dynamically
unstable at room temperature and their free energies can not be compared.
The main source of discrepancy between theory and experiments is the effect of temperature on phonon fre-quencies. Usually, in DFT, the quasi-harmonic approxi-mation (QHA) is employed i.e. the phonon frequencies are calculated in the harmonic approximation for differ-ent cell volumes. The QHA takes into account only the effect of thermal expansion since the free energy will be minimal at a different volume for each T - the tempera-ture enters through the Bose occupation of the harmonic phonons, while other sources of anharmonicities are ne-glected. This picture is in principle valid when phonons do not interact, for example at low T . However, when the temperature increases, phonons undergo mutual scatter-ing, which corresponds to the anharmonic vibrations of atoms. Anharmonicity is in general weak [29] and usu-ally hardens unstable phonon frequencies, as the restor-ing forces which keep atoms in the vicinity of their equi-librium positions become progressively larger with tem-perature. We show below that the QHA is not reliable for any of the phases under study at higher tempera-tures, and explicit anharmonic contributions are key to obtain correct vibrational spectra, as was also seen for the high-temperature phonons of bcc metals [26].
Starting with the QHA, we first determine the elec-tronic free energy Fel = U − T Sel [30] (with U the
internal energy) for different values of the cell volume for the five phases viz. f cc, bcc, sc, I41/amd, and
Cmmm. We use the ABINIT [31] implementation of DFT and the exchange-correlation functional of Perdew-Burke-Ernzerhof [32] for the generalized gradient approx-imation, using both norm-conserving [33] and projector augmented wave [34] potentials (for details see SI).
The electronic Gibbs free energy Gel = Fel + pV is
calculated for every cell volume and the results are fitted to a second order Murnaghan equation of state [35]. The
-0.2 -0.15 -0.1 -0.05 0 0 5 10 15 20 25 30 35 40 45 50 ∆ G (3 0 0 K ,P ) (e V ) Pressure (GPa) -0.2 -0.15 -0.1 -0.05 0 0 5 10 15 20 25 30 35 40 45 50 ∆ G (3 0 0 K ,P ) (e V ) Pressure (GPa) -0.2 -0.15 -0.1 -0.05 0 0 5 10 15 20 25 30 35 40 45 50 ∆ G (3 0 0 K ,P ) (e V ) Pressure (GPa) Gf ccel Gbcc el GI41/amd el Gsc el Gf cc qha Gbcc qha GI41/amd qha Gsc
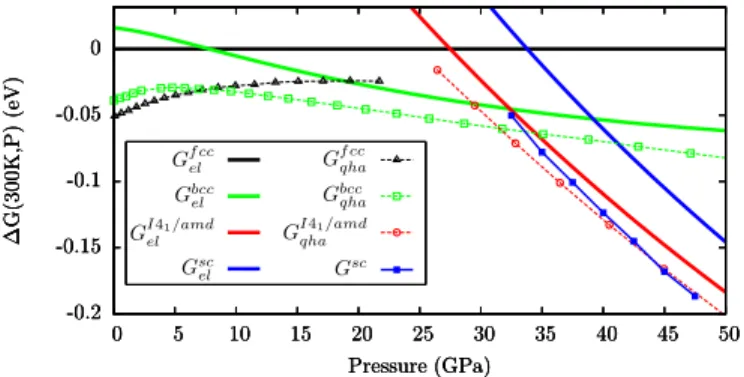
FIG. 1. (Color online) Thick lines: electronic Gibbs free en-ergy fit at T =300 K of the bcc, sc and I41/amd relative to f cc
phase (GCmmm
el and Gscel are indistinguishable). Thin dashed
lines with open symbols: harmonic total Gibbs free energy (including Feland Fph,qha) for f cc, bcc and I41/amd in their
ranges of stability. Fph,qha can be determined neither for sc
nor for Cmmm, due to the instability of these phases in the QHA. Full line with closed squares: total Gibbs free energy for sc (Gsc) after including the anharmonically renormalized
phononic contribution Fph at 300 K.
electronic Gibbs free energies are shown at T =300 K for the five phases as thick lines in Fig.1, with f cc as ref-erence. Contributions from electronic entropy and ther-mal expansion give a result in agreement with previous works [16,17]. At this level, Cmmm is more stable than sc by about 1 meV but both have energies higher than I41/amd by about 50 meV.
We then compute the harmonic phonon free energy and add it to the electronic Gibbs free energy to obtain the global (electron plus phonon) harmonic Gibbs free energy Gqha = Gel+ Fph,qha as a function of pressure
. We then use the same second order Murnaghan equa-tion of state [35] to fit our results, which gives the thin dashed lines with open symbols in Fig.1. The fit param-eters are given in the SI. This approach is possible only if the phonon frequencies are stable, since the presence of imaginary modes in the vibrational spectra precludes the calculation of a free energy. In the QHA, f cc is stable for P.22 GPa, bcc is stable in the whole pressure range in-vestigated while I41/amd is stable for P&25 GPa. The sc
and Cmmm structures are dynamically unstable in the whole 0-50 GPa pressure range, thus we can not calcu-late Fph,qha: we then conclude that QHA contributions
are not sufficient to correct the phase diagram, as was also found by previous authors [17,20,23].
Errea et al. [20] were the first to consider explicit an-harmonic contributions in sc-Ca. They introduced the third and fourth order anharmonic terms of the pertur-bative expansion in a self-consistent harmonic approxi-mation (SCHA). They show that the sc phase is stable at 50 GPa for all temperatures, even for 0 K, as a result of quantum fluctuations.
To calculate the complete phononic free energy Fphwe
fre-100i0 100 200 300 I41/amd 100i0 100 200 300 F re q u en cy (c m − 1) 100i0 100 200 300 Γ M X PN Γ Z Cmmm Γ X M R Γ M h a rm o n ic sc 1 0 K Γ X M R Γ M 3 0 0 K
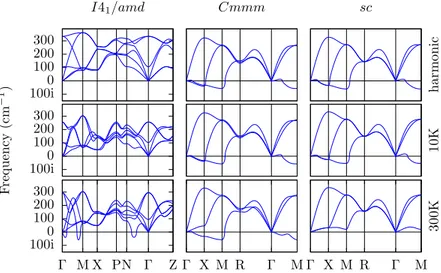
FIG. 2. (Color online) Phonon dispersion curves for I41/amd, Cmmm and sc phases. Harmonic results are compared
with anharmonically renormalized frequancies at finite temperature (10 K and 300 K). Anharmonic contributions destabilize I41/amd, stabilize sc and have weak effect on Cmmm.
quencies self-consistently to all orders. In this scheme the harmonic and anharmonic free energy contributions are not separable, and one makes a classical approximation for the canonical displacement of the phonons. The en-tropy and free energy contributions are calculated using the SCAILD method as described in Ref. [28], in order to include also anharmonic contributions to the lattice potential. We add SCAILD results on top of QHA cal-culations for fixed pressures, in order to consider the ef-fect of anharmonicities beyond thermal expansion, taking into account explicit phonon-phonon interactions. The phonon dispersion curves for the Ca III candidate phases are compared in Fig.2for P =40 GPa, and for T =300 K, 10 K, and the harmonic case. Our sc harmonic calcu-lations are very close to linear-response calcucalcu-lations in the literature [18–20] and show unstable modes along the X and M directions (the stabilization of sc down to 0 K seems to be possible only with a fully quantum ap-proach [20]). As the temperature increases, sc becomes dynamically stable in agreement with Ref. [12] and all the experimental reports. Full phononic free energy contri-butions can now correctly be taken into account and are included in the Gibbs free energy G = Gel+ Fph, leading
to the full line with closed squares in Fig.1, in which the sc phase has a phononic contribution of Fsc
ph' −60 meV
at 300 K and pressures between 32.5 and 47.5 GPa. More details on these calculations are given in the SI.
We stress that, within SCAILD, the difference between Fphand Fph,qhais not an additive anharmonic part of the
free energy, since Fph is obtained from a renormalization
process of all the frequencies with T .
To treat all phases on the same footing, we investigate the anharmonic contribution to the phonon frequencies of I41/amd and Cmmm, and find that they have very
different behaviors. I41/amd is the only stable phase in
the harmonic approximation. Once temperature correc-tions are introduced, we find that it is still dynamically stable at low temperature, with a phononic free energy of about FI41/amd
ph ' 50.7 meV at 10 K and 40 GPa (Fig.2)
compared to FI41/amd
ph,qha ' 35 meV in the harmonic case.
We note that the value of Fph can be positive or
neg-ative for a given T , as can the anharmonic correction Fph− Fph,qha, but the free energies all decrease as a
func-tion of T , as required by thermodynamics. The Fphterm
is symptomatic of destabilization for I41/amd: a large
anharmonic softening of phonon branches with temper-ature is present, which is particularly pronounced along the Γ-N and Γ-M directions. At T =300 K the I41/amd
phonon dispersion acquires imaginary segments along the directions to N and M. The midpoint between Γ and N is explicitly calculated and renormalized in our supercell, and shows a downward shift from 75 cm−1 for harmonic calculations to 64 cm−1 at 10 K and 30 cm−1 at 300 K. To our knowledge, this is the first time that anharmonic contributions have been shown to have this effect.
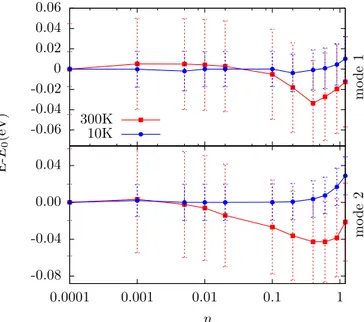
We examine the qualitative behavior of the free energy landscape for the N point of the I41/amd phase at low
and high temperature in a 2×2×2 (16 atom) supercell for the first and second lowest energy modes (Fig. 3). The N point mode is frozen with amplitude η and all others sampled thermally and anharmonically (see SI). When the temperature is increased, the anharmonicity transforms the single-well low-temperature free energy profile into a triple well profile for the chosen phonons. The system is destabilized and any excitation of finite amplitude η produces a decrease of the total energy. The free energy considered here is averaged over 35 SCAILD iterations, and contains the intrinsic information about the entropy of the rest of the phonons.
-0.06 -0.04 -0.02 0 0.02 0.04 0.06 m o d e 1 -0.08 -0.04 0.00 0.04 0.0001 0.001 0.01 0.1 1 E -E 0 (e V ) m o d e 2 η 300K 10K
FIG. 3. (Color online) Anharmonically averaged poten-tial energy surfaces for the two lowest energy modes of the I41/amd phase at the N point at high and low temperature,
as a function of the frozen normal mode coordinate η (unit-less) - see SI. Note the log scale on the horizontal axis, and the local minimum at 300 K for extremely small displacements. The error bars show the standard deviation of the energy for the set of random displacements.
changes. Its stability range is known to be very narrow in the phase diagram [12]. In our case, Cmmm is stable neither at P =40 GPa (up to room temperature) nor for the conditions proposed in Ref. [12] or in Ref. [8] (cfr. SI) though, again, the SCAILD method can not exclude a quantum stabilization at these very low temperatures. Teweldeberhan et al. found Cmmm stable for 45 GPa and 300 K with MD [23], but this observation must be tempered. They calculate the phonon frequency at high symmetry points finding the peaks in frequency of the velocity autocorrelation function. By construction, the autocorrelation function is calculated for real frequen-cies: it can confirm the presence of a real frequency, but not the absence of imaginary modes. The latter corre-spond to transient phenomena, which will not show up in the Fourier transform of an ergodic propagation. The frequency which may appear is that of the oscillation be-tween equivalent distorted structures, if they are visited periodically. The system may also lack a reference struc-ture with appropriate symmetry: imposing a specific cell shape can impede certain phase transitions, in particular if the cell is too small or is incommensurate with other structures (e.g. sc versus Cmmm). The local environ-ment analysis carried out in Ref. [17] is more robust for identifying phases, but also depends on ergodic, size, and symmetry conditions.
In conclusion, anharmonic phonon renormalized cor-rections can have very different effects on the same
chem-ical element, depending on its crystalline phase. They provide crucial insights into the phase diagram of cal-cium and clarify both the reason for the stability of the sc phase and the mechanism behind the temperature-driven phase transitions Ca III0→ Ca III. Adding anharmonic corrections to the QHA, the correspondence with experi-ments is restored at room temperature and we show that sc is the correct structure for the CaIII phase, with a crit-ical pressure for the bcc → sc phase transition at 300 K is of about 33.7 GPa, consistent with the experimental value (33 GPa). On the other hand, the I41/amd
desta-bilization is both dynamical and (as a consequence) ther-modynamical. According to our calculations, the CaIII0
phase can be identified with tetragonal I41/amd at low
temperature, though additional quantum effects may af-fect both phonons and free energies at extremely low T . Note that, given our anharmonic analysis, the dashed red line with open symbols for I41/amd in Fig.1 does
not correspond to a physical phase, and its intersections with other lines do not represent phase transitions.
Recent experiments show that the calcium phase dia-gram has a complicate shape: [5,7] predict sc stable up to 119 GPa, though high pressure work suggests that sc is never fully stabilized with respect to rhombohedral dis-tortions [9]. Alternative phases of calcium (e.g. a small sc distortion [9]) may exist between the sc and the tetrag-onal P 43phase [7]. Ishikawa et al. [36] have shown good
agreement with experiment in the higher pressure region using only the enthalpy, suggesting phononic and anhar-monic contributions are not dominant for P>70 GPa.
Our analysis shows that sc is dynamically stable be-tween 32.5 GPa and 47.5 GPa (in agreement with [4] - see SI). The similarity between the experimental XRD pat-terns of I41/amd in [12] and the one simulated in [25],
to-gether with our results on its dynamical stability support the idea that Ca III0 has indeed a I4
1/amd structure.
This shows that the inclusion of anharmonic effects is es-sential to understand the complex problem of the CaIII0
phase. A fully quantum treatment of the vibrations [20] will probably be necessary clarify the low temperature part of the calcium phase diagram.
We thank P. Souvatzis, O. Eriksson, O. Hellmann and I. Abrikosov for fruitful discussions at the Upp-sala SCAILD workshop, and A. M. Teweldeberhan for clarifications about the norm-conserving pseudopotential used. The authors acknowledge an A.R.C. grant (The-MoTherm 10/15-03) and MDG acknowledges a F.R.I.A. grant (number 1.E051.12), both from the Communaut´e Fran¸caise de Belgique; SKS was supported by a grant co-financed by the Belgian Federal Scientific Policy (BEL-SPO) and the European Commission. Computer time was made available by PRACE-2IP on Huygens and Hec-tor (EU FP7 grant RI-283493), CECI, and SEGI-ULg.
∗
Email address: m.di.gennaro.bari@gmail.com
†
Email address: srijan.india@gmail.com
[1] M. I. McMahon and R. J. Nelmes, Chem Soc Rev 35, 943 (2006).
[2] T. Matsuoka and K. Shimizu, Nature 458, 186 (2009). [3] Y. Ma, M. Eremets, A. R. Oganov, Y. Xie, I.
Tro-jan, S. Medvedev, A. O. Lyakhov, M. Valle, and V. Prakapenka, Nature 458, 182 (2009).
[4] H. Olijnyk and W. Holzapfel, Phys. Lett. 100A, 191 (1984).
[5] T. Yabuuchi, Y. Nakamoto, K. Shimizu, and T. Kikegawa, J. Phys. Soc. Jpn. 74, 2391 (2005). [6] Q. F. Gu, G. Krauss, Y. Grin, and W. Steurer, Phys.
Rev. B 79, 134121 (2009).
[7] H. Fujihisa, Y. Nakamoto, K. Shimizu, T. Yabuuchi, and Y. Gotoh, Phys. Rev. Lett. 101, 095503 (2008).
[8] Y. Nakamoto, M. Sakata, K. Shimizu, H. Fujihisa, T. Matsuoka, Y. Ohishi, and T. Kikegawa, Phys. Rev. B 81, 140106 (2010).
[9] W. Mao, L. Wang, Y. Ding, W. Yang, W. Liu, D. Y. Kim, W. Luo, R. Ahuja, Y. Meng, S. Sinogeikin, J. Shu, and H. Mao, Proc. Natl. Acad. Sci. U.S.A. 107, 9965 (2010). [10] T. Yabuuchi, T. Matsuoka, Y. Nakamoto, and
K. Shimizu, J. Phys. Soc. Jpn. 75, 083703 (2006). [11] M. Sakata, Y. Nakamoto, K. Shimizu, T. Matsuoka, and
Y. Ohishi, Phys. Rev. B 83, 220512 (2011).
[12] J. S. Tse, S. Desgreniers, Y. Ohishi, and T. Matsuoka, Scientific Reports 2, 372 (2012).
[13] T. Ishikawa, A. Ichikawa, H. Nagara, M. Geshi, K. Kusakabe, and N. Suzuki, Phys. Rev. B 77, 020101 (2008).
[14] Y. Yao, J. S. Tse, Z. Song, D. D. Klug, J. Sun, and Y. Le Page, Phys. Rev. B 78, 054506 (2008).
[15] Y. Yao, R. Martoˇn´ak, S. Patchkovskii, and D. D. Klug, Phys. Rev. B 82, 094107 (2010).
[16] A. R. Oganov, Y. Ma, Y. Xu, I. Errea, A. Bergara, and A. O. Lyakhova, Proc. Natl. Acad. Sci. U.S.A. 107, 7646 (2010).
[17] Y. Yao, D. D. Klug, J. Sun, and R. Martoˇn´ak, Phys.
Rev. Lett. 103, 055503 (2009).
[18] G. Gao, Y. Xie, T. Cui, Y. Ma, L. Zhang, and G. Zou, Solid State Comm. 146, 181 (2008).
[19] A. M. Teweldeberhan and S. A. Bonev, Phys. Rev. B 78, 140101 (2008).
[20] I. Errea, B. Rousseau, and A. Bergara, Phys. Rev. Lett. 106, 165501 (2011).
[21] Z. P. Yin, F. Gygi, and W. E. Pickett, Phys. Rev. B 80, 184515 (2009).
[22] I. Errea, M. Martinez-Canales, A. R. Oganov, and A. Bergara, High Press. Res. 28, 4 (2008).
[23] A. M. Teweldeberhan, J. L. Dubois, and S. A. Bonev, Phys. Rev. Lett. 105, 235503 (2010).
[24] S. Arapan, H. Mao, and R. Ahuja, Proc. Natl. Acad. Sci. U.S.A. 105, 20627 (2008).
[25] H. Liu, W. Cui, and Y. Ma, The Journal of Chemical Physics 137 (2012).
[26] P. Souvatzis, O. Eriksson, M. I. Katsnelson, and S. P. Rudin, Phys. Rev. Lett. 100, 095901 (2008).
[27] P. Souvatzis, O. Eriksson, M. Katsnelson, and S. Rudin, Computational Materials Science 44 (2009).
[28] P. Souvatzis, S. Arapan, O. Eriksson, and M. I. Katsnel-son, Europhysics Letters 96 (2011).
[29] L. D. Landau and E. Lifshitz, Statistical Physics, Third Edition, Part 1: Volume 5 (Elsevier, 1980).
[30] N. Mermin, Phys. Rev. 137, A1441 (1965).
[31] X. Gonze, J.-M. Beuken, R. Caracas, F. Detraux, M. Fuchs, G.-M. Rignanese, L. Sindic, M. Verstraete, G. Zerah, F. Jollet, M. Torrent, A. Roy, M. Mikami, P. Ghosez, J.-Y. Raty, and D. Allan, Comput. Mater. Sci. 25, 478 (2002).
[32] J. P. Perdew, K. Burke, and M. Ernzerhof, Phys. Rev. Lett. 77, 3865 (1996).
[33] N. Troullier and J. L. Martins, Phys. Rev. B 43, 1993 (1991).
[34] P. E. Bl¨ochl, Phys. Rev. B 50, 17953 (1994).
[35] F. D. Murnaghan, Proc. Natl. Acad. Sci. U.S.A. 30, 244 (1944).
[36] T. Ishikawa, H. Nagara, N. Suzuki, T. Tsuchiya, and J. Tsuchiya, Phys. Rev. B 81, 092104 (2010).