W. R. Pryor1 , L. W. Esposito2 , A. Jouchoux2, R. A. West3 , D. Grodent4 , J.‐C. Gérard4 , A. Radioti4 , L. Lamy5 , and T. Koskinen6
1Department of Science, Central Arizona College, Coolidge, AZ, USA,2Laboratory for Atmospheric and Space Physics, University of Colorado Boulder, Boulder, CO, USA,3Jet Propulsion Laboratory, California Institute of Technology, Pasadena, CA, USA,4Laboratoire de Physique Atmosphérique et Planétaire, Université de Liège, Liège, Belgium,5LESIA, Observatoire de Paris, PSL, CNRS, UPMC, Université Paris Diderot, Meudon, France,6Lunar and Planetary Laboratory, University of Arizona, Tucson, AZ, USA
Abstract
Cassini'sfinal orbits in 2016 and 2017 provided unprecedented spatial resolution of Saturn's polar regions from near‐polar spacecraft viewing geometries. Long‐wavelength channels of Cassini's Ultraviolet Imaging Spectrograph instrument detected Saturn's UV‐dark north polar hexagon near 180 nm at planetocentric latitudes near 75°N. The dark polar hexagon is surrounded by a larger, less UV‐dark collar poleward of planetocentric latitude 65°N associated with the dark north polar region seen in ground‐based images. The hexagon is closely surrounded by the main arc of Saturn's UV aurora. The UV‐dark material was locally darkest on one occasion (23 January 2017) at the boundary of the hexagon; in most Ultraviolet Imaging Spectrograph images the dark material more uniformlyfills the hexagon. The observed UV‐dark stratospheric material may be a hydrocarbon haze produced by auroral ion‐neutral chemistry at submicrobar pressure levels. Ultraviolet Imaging Spectrograph polar observations are sensitive to UV‐absorbing haze particles at pressures lower than about 10–20 mbar.1. Introduction
Saturn's polar hexagon was initially detected in the visible by the Voyager Imaging Science Subsystem (ISS; Allison et al., 1990; Godfrey & Moore, 1986; Gierasch, 1989; Godfrey, 1988, 1990). The hexagon has been extensively studied from the ground (e.g., Sánchez‐Lavega et al., 1993, 1997) and by the Cassini spacecraft with its ISS (e.g., Sánchez‐Lavega et al., 2014), Visual Infrared Mapping Spectrometer (Baines et al., 2009), and Composite Infrared Spectrometer (Fletcher et al., 2008, 2018). The hexagon is a roughly six‐sided jet near planetocentric latitude 75°N with a north‐south width of ~2.8° with a stable rotation rate that, based on its persistence over many years under strong seasonal variations in sunlight, may be deeply rooted and rotating at the internal rotation period of Saturn (Sánchez‐Lavega et al., 2014). The meandering hexagonal jet can be wellfit by a sinusoidal wave of wave number 6 and wave amplitude 0.5° centered on planetocentric latitude 75.8°N (Antuñano et al., 2015). Visual Infrared Mapping Spectrometer 5.1‐μm nightside imaging finds that the hexagon pattern is made of two deep cloud tracks at ~2‐3‐bar pressure level separated by a cloud‐free lane (Baines et al., 2009).
UV‐dark material has previously been reported at Saturn's north pole in Voyager Photopolarimeter Subsystem 265‐nm data (Lane et al., 1982; West et al., 1983), closely associated with the location of Voyager Ultraviolet Spectrometer auroral emissions (Pryor & Hord, 1991). Hubble Space Telescope (HST) imaging with the Faint Object Camera at 220 nm confirmed this apparent link between UV auroral activity and enhanced UV opacity (Ben Jaffel et al., 1995; Gérard et al., 1995). HST/Advanced Camera for Surveys F165LP images from 2013 also display a UV‐dark northern pole (Lamy, personal communication, 2018). An initial look at Saturn's UV‐dark north pole with Cassini UVIS was presented in Sayanagi et al. (2018). This paper describes the recent Cassini UVIS observations and polar data sets. The results section presents the UV‐dark polar material seen near 180 nm, its spectrum and at times hexagonal form, and its association with UV auroral emissions. The discussion section puts these results in context with earlier work, demonstrates the stratospheric nature of the UV‐dark hexagon, and explores the connections between auroral ionization, haze formation, and the resulting haze distributions.
©2019. The Authors.
This is an open access article under the terms of the Creative Commons Attribution‐NonCommercial‐NoDerivs License, which permits use and distri-bution in any medium, provided the original work is properly cited, the use is non‐commercial and no modifica-tions or adaptamodifica-tions are made. Key Points:
• Saturn's polar hexagon is visible in Cassini UVIS data
• Saturn's polar hexagon is adjacent to Saturn's auroral emissions • It is likely that auroral ion chemistry
provides a source of dark material for Saturn's polar hexagon
Supporting Information: • Supporting Information S2 • Movie S1 • Movie S2 • Movie S3 Correspondence to: W. R. Pryor, wayne.pryor@centralaz.edu Citation:
Pryor, W. R., Esposito, L. W., Jouchoux, A., West, R. A., Grodent, D., Gérard, J.‐ C., et al (2019). Cassini UVIS detection of Saturn's north polar hexagon in the Grand Finale orbits. Journal of Geophysical Research: Planets, 124, 1979–1988. https://doi.org/10.1029/ 2019JE005922
Received 12 JAN 2019 Accepted 4 JUL 2019
Accepted article online 19 JUL 2019 Published online 29 JUL 2019
600 km.
Cassini UVIS FUV auroral images are fundamentally different in appearance in three spectral regions: H Lyman‐alpha (121.6 nm) auroral images seem somewhat blurrier than H2 band auroral images
(~130–160 nm, excluding Lyman‐alpha), perhaps due to greater vertical extent and multiple scattering effects. A third“red” spectral region, from about 161 to 191 nm, labeled 180 nm in this paper, shows very little auroral signal and is instead dominated by Rayleigh scattering of incident sunlight from molecular hydrogen and atomic helium, modified by absorption by hydrocarbon molecules and by aerosol scattering and absorption. Recent 180‐nm images of the solar‐illuminated northern pole had sufficient spatial resolu-tion to begin to detect reflectivity contrasts at high latitudes, as we now show. Simultaneously obtained H2
band auroral images will be presented as well to highlight geographic correlations in features.
The Cassini UVIS data sets, including those described in this paper, have been archived in NASA's Planetary Data System at the New Mexico State University website https://atmos.nmsu.edu/data_and_services/atmo-spheres_data/Cassini/inst‐uvis.html. Also at that website a set of EUV and FUV auroral “books” can be found—large PDF files collecting thousands of UVIS auroral images and providing a good starting point for future auroral investigations. Figures 4, 5a, and 5b in this paper are similar in format to pages from those auroral books, although specially modified to just show the 180‐nm wavelength region that shows the hexagon.
3. Results
We now present several UVIS data sets displaying Saturn's north pole, with increasingly better spatial resolution. The first set, from a particularly long movie, illustrates auroral variability in association with UV‐dark north polar haze. Figure 1 shows a UVIS 180‐nm image (more precisely, 161–191 nm) from 2 October 2016 (day 276) obtained from subspacecraft latitude 49.4°N and an altitude above Saturn of 16.5 Rs, the 45th image from a 50‐image sequence starting at subspacecraft planetocentric latitude 46.4°N and
an altitude of 17.6 Rsabove Saturn. Figure 1 shows a dark collar surrounding a darker polar region that is
just beginning to be resolved into hexagonal form. Figure 2 shows the same 180‐nm data (more precisely, 161–191 nm), but also adds shorter‐wavelength channels (131–161 nm) sensitive to H2band emissions,
showing that the bright main aurora is situated just outside the outer edge of the hexagonal region. Movies S1 and S2 in the supporting information show the full sequence, showing the changing auroral emissions tightly wrapping around the darker hexagon.
A second observing sequence, presented in Figure 3, also shows the full north polar region, but this time from closer in (altitude above Saturn = 3.9–4.6 Rs, subspacecraft planetocentric latitude 44.1–47.5°N).
Three spacecraft slews were used to make these images. The hexagon is more obviously polygonal from this range, and the auroras also show additional detail: multiple sharp arcs close to the hexagon surrounded by a more diffuse extended aurora that correlates geographically with part of the dark collar. Movie S3 in the sup-porting information cycles these images, better showing the spatial relationships. In this case there is some overlap of the brighter auroral emissions and the hexagon itself.
Even closer observations displayed in Figures 4 and 5 only cover part of the polar region. Figure 4 shows a partial hexagon from 2.9 Rsaltitude, which clearly has straight sides and two sharp corners. Its interior
appears uniform in darkness. Figures 5a and 5b, from altitude 2.6 Rs, also shows a partial hexagon, but the
hexagon boundary is darker than the interior. We next explore the spectroscopy of this dark material. Figure 5c shows the spatially summed full spectra of UVIS spatial pixels 2–12 along the slit from Figures 5a and 5b as a time series, showing the proximity of the bright auroral H Lyman‐alpha (121.6 nm) and H2band emissions, mostly below 160 nm, to the dark polar hexagon visible above in Figures 5a and 5b.
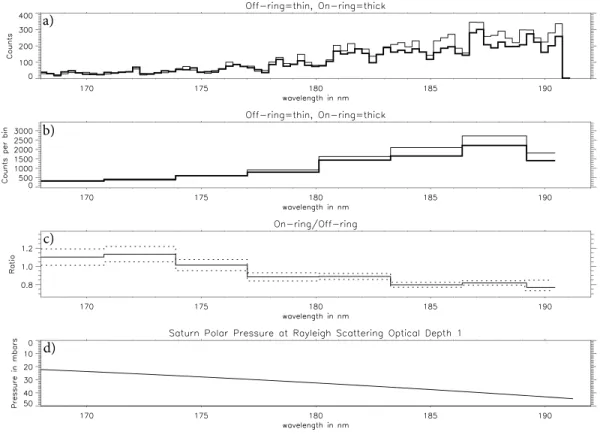
Figure 5d sums Figure 5c spectrally; the time series of the full sum over all wavelengths (thin line) shows two peaks corresponding to auroral oval crossings. The sum of the longer‐wavelength channels in Figure 5d (165–191 nm, thicker line) shows a dip due to hexagon‐related absorption near the first auroral peak. Figures 6a–6c show the broadband spectral absorption of the dark hexagonal ring seen in Figure 5, some 10–20% darker at 180–190 nm than neighboring time steps that were obtained with the UVIS slit slightly away from the hexagon. The broadband absorption does not show obvious diagnostic spectral features. Figure 6d shows the wavelength dependence of Rayleigh scattering vertical optical depth one on Saturn, providing an estimate of the altitude of the dark material seen that will be discussed further below.
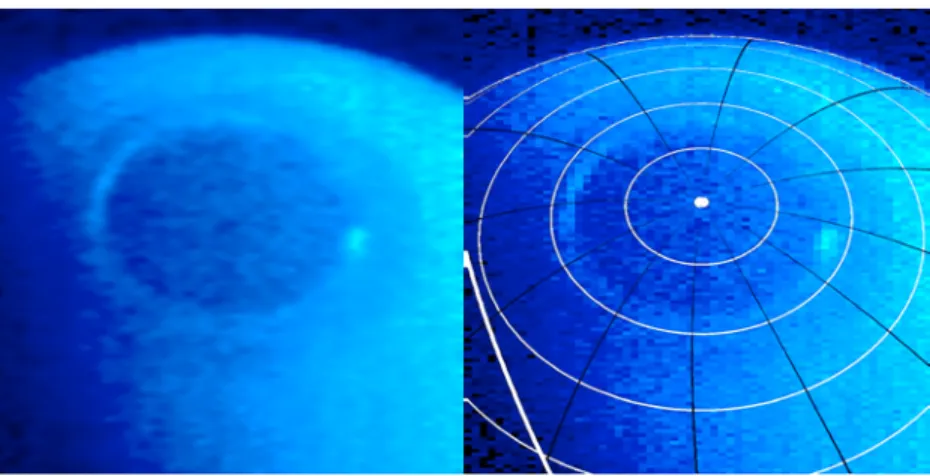
Figure 2. Single north polar image from 2 October 2016 (day 276) 00:38–00:54, from subspacecraft latitude 49.4°N and altitude above Saturn of 16.5 Rsagain showing the very UV‐dark polar hexagon and the surrounding dark collar near
180 nm (more precisely, 161–191 nm), but now the H2band UV auroral emissions (131–161 nm) have been added. This is
the 45th image of the 50‐frame Movie S2 in the supporting information. At right, a geometric overlay has been limb‐fit to the data with latitude lines every 10°, along with longitude lines, and a terminator (thickest white line).
Figure 1. At left is a single north polar image from 2 October 2016 (day 276) 00:38v October 2–00:54, from subspacecraft latitude 49.4°N and altitude above Saturn of 16.5 Rsshowing the very UV‐dark polar hexagon and the surrounding dark
collar near 180 nm (more precisely, 161–191 nm). This is the 45th image of the 50‐frame Movie S1 in the supporting information. At right, a geometric overlay has been limbfit to the data with latitude lines every 10°, along with longitude lines, and a terminator (thickest white line).
Finally, Figure 7 shows an observation from 2017 day 23, obtained from an altitude of 6.6 Rs, in which the
UVIS long‐wavelength polar region data look particularly hexagonal. This image was made from two side by side 40‐min slews, reprojected into a latitude‐longitude grid to partially remove the planetary rotation during the slow slews. This technique better shows the hexagon because it rotates at near the planetary rotation rate.
4. Discussion
Figure 8 schematically illustrates the regions that we will now discuss: the UV‐dark polar hexagon, the sur-rounding dark collar, the bright but narrow main auroral oval just outside the hexagon, and the sursur-rounding broader diffuse aurora that precipitates charged particles into the dark collar region. UV‐dark material seen in the hexagon and the dark collar (Figures 1–7) is probably due to large hydrocarbon molecules and aero-sols. Some of the auroral primary and secondary electrons penetrate below Saturn's methane homopause (Gérard et al., 2004, 2013; Gustin et al., 2017; Tao et al., 2014) and impact molecular hydrogen, creating H2+ions that charge exchange with H2molecules to form H3+ions. These in turn quickly react with
methane to create hydrocarbon ions and promote hydrocarbon ring formation and polymerization. Alternatively, methane, ethane, and acetylene may be ionized directly to form hydrocarbon ions to start the ion‐neutral reactions that form larger hydrocarbons. Larger hydrocarbons may have the observed broad-band UV‐absorption properties (e.g., Pryor, 1989; Pryor & Hord, 1991). The spectrum of benzene (along with other hydrocarbons such as acetylene) has been observed on Saturn in Cassini UVIS solar occultations at the 0.1–10 microbar level (~400–600 km above 1 bar), with highest abundance in a stellar occultation at a pla-netocentric latitude of 70.9°N (Koskinen et al., 2016), a region characteristic of auroral emissions and arcs. Koskinen et al. (2016) also observed an FUV continuum absorber in a cold polar night UVIS stellar occulta-tion at an auroral planetocentric latitude 69.1°S, at pressures above a few microbars, due to a mixture of con-densed higher‐order hydrocarbons. The relevant auroral ion chemistry and haze production has been best modeled for Jupiter; multiring hydrocarbons may condense, promoting aerosol formation (Friedson et al., 2002; Perry et al., 1999; Wong, 2002; Wong et al., 2000; Wong et al., 2003). Kim et al. (2012) have detected infrared features on Saturn that are diagnostic of the hydrocarbon haze composition and can distinguish between aromatic and aliphatic compounds. On Saturn, these large hydrocarbon molecules and small aero-sol particles are observed in UVIS images in the inner dark hexagonal region and also in the dark collar region. The UVIS spectrum presented here (Figure 6) shows that the UV hexagon is darker than neighboring regions, but does not display obvious spectral diagnostics.
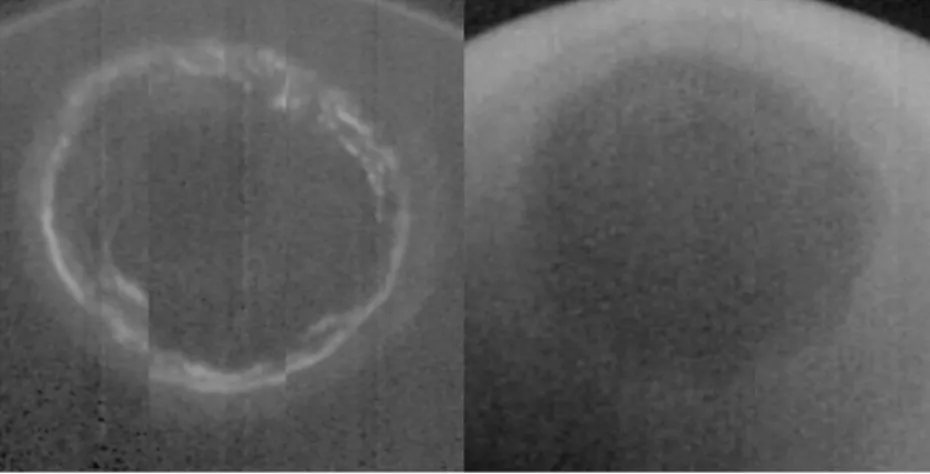
Figure 3. Saturn north polar images formed from three spacecraft slews on 7 August 2017 (day 219) 11:38–13:17. Subspacecraft latitude = 44–47°N; spacecraft altitude = 4.6–3.9 Rs. (a) Left image shows auroral emissions from H2
from 136 to 165 nm. Both a bright main auroral oval and an extended outer region of diffuse auroral emission are seen. (b) Right image shows reflected sunlight from 171 to 191 nm. Both the dark hexagon and outer dark collar are seen. The third slew produced the right side of the image and was obtained closest to the planet and in this case the inner hexagon is most obviously polygonal. Movie S3 cycles these two images and a third merged image.
The enhanced UV darkness in the images presented here inside the auroral oval compared to outside sug-gests much of the newly formed material travels poleward at the higher altitudes, 900–1,400 km above the 1 bar level, where the aurora occurs (Gérard et al., 2009, their Figure 3) at pressures of 1–0.01 microbars. This poleward transport is supported by Global Circulation Modeling studies (Müller‐Wodarg et al., 2006, 2012) thatfinds both poleward and equatorward meridional transport away from auroral latitudes at auroral altitudes. These models alsofind vertical upwelling at the auroral latitudes and downwelling near the pole, tending to move the newly forming haze particles down inside the auroral ovals. The hexagon's jet may act as a barrier to equatorward transport of polar aerosols, leading to different haze particle populations at tropo-spheric levels inside and outside of the jet (Sanz‐Requena et al., 2018). Cassini ISS images at 935 nm taken with polarizers also show structural differences inside and outside of the hexagon (West et al., 2015). The range of pressures sensed by the UVIS images (Figure 6d) is estimated by calculating the pressure level of the vertical one‐way optical depth one level for Rayleigh scattering in Saturn's hydrogen and helium polar atmosphere which occurs at ~30 mbar at 180 nm (using cross sections from Chan and Dalgarno (1965) and Ford and Browne (1973), and pressure values adapted from Pryor (1989)). Slant path effects reduce this pres-sure: in Saturn's north polar region, the Sun is always low in the sky, making the typical slant scattering opti-cal depth one level closer to ~10–20 mbar. Even a black object would be much less visible seen through
Figure 4. Partial Saturn north polar 180‐nm image (more precisely, 164–191 nm) from 28 February 2017 (day 59) 10:51–11:37 from subspacecraft latitude 57°N and spacecraft altitude above Saturn of 2.9 Rs. White latitude circles are drawn in the bottom panel at 70° and 80°N planetocentric latitude. Black longitude lines are spaced 30° apart. This partial hexagon image shows two sharp corners separated by about 60° of longitude in the polar hexagon, and a hexagon interior that is uniform in appearance.
several optical depths of Rayleigh scattering gas (optical depth 4 gives ~2% contrast), so the ~10% contrast seen here associated with the hexagon suggests that a conservative upper limit on the observed pressure of the UV absorption would be 2–3 vertical optical depths, or 60–90 mbar. The hexagon was also visible in Composite Infrared Spectrometer retrieved temperature maps at 100‐mbar pressure, but was not seen in earlier maps probing higher levels (1–6 mbar; Fletcher et al., 2008). However, recent (2016–2017) Composite Infrared Spectrometer temperature observations (Fletcher et al., 2018) do see the polar hexagon near 5 mbar, along with enhanced acetylene and ethane poleward of the hexagon. Fletcher et al. (2018) argue that stratospheric aerosols may be localized poleward of the vortex and contribute to the sharp rise in stratospheric heating. Radiative transfer modeling of Cassini ISS images by Sanz‐Requena et al. (2018) confirms the presence of stratospheric aerosols in the 1–100‐mbar range with an optical depth at the hexagon latitude of 0.06 ± 0.01 at 0.4μm.
The UV‐dark collar observed in UVIS images (Figures 1–5 and 7) around the hexagon may be identified with Saturn's dark NPR north of planetocentric latitude 64.7°N and south of the hexagon. The NPR appears uni-formly dark in ground‐based images (e.g., Sánchez‐Lavega et al., 1997). We note that while Saturn's main auroral arc is near the hexagon edge (Figures 2 and 3), weaker, diffuse, slightly more equatorward UV
Figure 5. (a) Partial Saturn 180 nm (more precisely, 165–191 nm) north polar image from 23 January 2017 (day 23) 14:23–15:00 from a subspacecraft planetocentric latitude of 51.1°N and an altitude above Saturn of 2.6 Rs. In this case the partial hexagon is darker at its outer boundary and brighter in the interior. (b) A geometric
overlay has been added, with circles drawn at 70° and 80°N planetocentric latitude. (c) Summed full spectra of UVIS spatial pixels 2–12 in the top image as a function of time (same time scale as in (a)), showing the proximity of the bright H2band emissions mostly below 160 nm to the dark polar hexagon. (d) The
spectra from (c) have been summed over wavelength, giving count rate as a function of time (same time scale as in (a)). The thin line is the overall sum, showing crossings of the bright auroral oval at time step 20 and time step 30. The thick line is the sum over the longer wavelength channels (165–191 nm), showing a dip when crossing the dark outer edge of the hexagon (time step 20).
auroral emissions are frequently observed in HST images (e.g., Grodent et al., 2005, 2010; Lamy et al., 2018) and in Cassini UVIS images (e.g., Lamy et al., 2013; Radioti et al., 2017) and are also visible as diffuse outer aurora in the UVIS data presented in Figure 3a, overlapping the dark collar seen in Figure 3b. Grodent et al. (2010) described these more diffuse outer auroras in the south polar case as a 7‐degree‐wide emission centered near planetocentric latitude 67°S attributed to suprathermal (~keV) electrons in the middle magnetosphere. Tripathi et al. (2018) calculated that the observed diffuse outer emissions could be caused by pitch angle scattering of softer electrons (less than ~250 eV) by electron cyclotron harmonic waves. Lamy et al. (2018) observed diffuse outer auroral emissions in HST images at planetocentric latitudes 65–72°N and presented evidence for field‐aligned currents at the time when Cassini crossed this secondary oval in 2017. Auroral ion‐ neutral chemistry from both the main auroral arcs and from these outer auroral emissions may provide sources of dark haze material that appears in UV and visible wavelengths in the NPR if a significant fraction of the charged particles penetrate below the north polar methane homopause, which is found near 0.1–1.0 microbars (Koskinen et al., 2016).
Also of interest in these UVIS data is the close proximity of the observed UV auroral emissions to the polar hexagon and its jet: the main auroral emission in Figure 2 and in Movie S2 in the
Figure 6. (a) The UVIS long‐wavelength spectrum of the first polar hexagon crossing (time steps 19–21) from Figure 5 compared to the scaled spectrum of neighboring time steps (17–18 and 22–23). (b) This panel rebins the data from (a) into 10 times fewer bins. (c) This panel ratios the two spectra from (b), showing long‐wavelength broadband absorption in the hexagon region (solid line). One‐sigma statistical error bars are shown as dashed lines. (d) Pressure at Rayleigh scattering vertical optical depth one in Saturn's polar atmosphere.
Figure 7. To better show the full hexagon, known to rotate at near the planetary rate, Cassini UVIS data from 23 January 2017 (day 23) 8:54–10:16 obtained in two side‐by‐side 40‐min slews across the north polar region have been reprojected into a polar latitude‐longitude grid using the JPL‐produced SPICE kernels. (SPICE refers to Spacecraft, Planetary, Instrument, C‐matrix, and Events information.) This 180‐nm (more precisely, 166–191 nm) image was obtained at a subspacecraft latitude of 60.6°N and spacecraft altitude of 5.6 Rs. This projection
shows a small gap in longitude coverage. The image has also been divided by the cosine of the solar zenith angle to partially remove limb‐darkening effects. Latitude circles are drawn every 10°.
tudinal proximity of the main auroral emissions to the hexagon could be why the rotation rates in Saturn's interior for the auroral magneticfield lines and the hexagonflow are so similar.
5. Conclusion
Saturn's dark polar hexagon appears in Cassini UVIS stratospheric observations from 2016 and 2017, and is most clearly seen in a latitude‐ longitude projection of two 40‐min slews across the pole (Figure 7). UV‐ dark material appears in close proximity to both the main auroral arc and more diffuse emissions observed just outside the main auroral oval (Figures 2 and 3). The UV‐dark material's low broadband spectral albedo (Figure 6) may arise from stratospheric hydrocarbons formed by auroral precipitation and transported primarily poleward.
References
Allison, M., Godfrey, D. A., & Beebe, R. F. (1990). A wave dynamical interpretation of Saturn's polar hexagon. Science, 247(4946), 1061–1063. https://doi.org/10.1126/science.247.4946.1061
Antuñano, A., del Río‐Gaztelurrutia, T., Sánchez‐Lavega, A., & Hueso, R. (2015). Dynamics of Saturn's polar regions. Journal of Geophysical Research: Planets, 120, 155–176. https://doi.org/10.1002/2014JE004709
Antuñano, A., del Río‐Gaztelurrutia, T., Sánchez‐Lavega, A., & Rodríguez‐Aseguinolaza, J. (2018). Cloud morphology and dynamics in Saturn's northern polar region. Icarus, 299, 117–132. https://doi.org/10.1016/j.icarus.2017.07.017
Baines, K. H., Momary, T. W., Fletcher, L. N., Showman, A. P., Roos‐Serote, M., Brown, R. H., et al. (2009). Saturn's north polar cyclone and hexagon at depth revealed by Cassini/VIMS. Planetary and Space Science, 57(14‐15), 1671–1681. https://doi.org/10.1016/j.
pss.2009.06.026
Ben Jaffel, L., Leers, V., & Sandel, B. R. (1995). Dark auroral oval on Saturn discovered in Hubble Space Telescope ultraviolet images. Science, 269(5226), 951–953. https://doi.org/10.1126/science.269.5226.951
Bunce, E. J., Arridge, C. S., Clarke, J. T., Coates, A. J., Cowley, S. W. H., Dougherty, M. K., et al. (2008). Origin of Saturn's aurora: Simultaneous observations by Cassini and the Hubble Space Telescope. Journal of Geophysical Research, 113, A09209. https://doi.org/ 10.1029/2008JA013257
Chan, Y. M., & Dalgarno, A. (1965). The refractive index of helium. Proceedings of the Physical Society, 85(2), 227–230. https://doi.org/ 10.1088/0370‐1328/85/2/304
Esposito, L. W., Barth, C. A., Colwell, J. E., Lawrence, G. M., McClintock, W. E., Stewart, A. I. F., et al. (2004). The Cassini ultraviolet imaging spectrograph investigation. Space Science Reviews, 115(1‐4), 299–361. https://doi.org/10.1007/s11214‐004‐1455‐8
Esposito, L. W., Colwell, J. E., Larsen, K., McClintock, W., Stewart, A. I., Hallett, J. T., et al. (2005). Ultraviolet imaging spectroscopy shows an active Saturnian system. Science, 307(5713), 1251–1255. https://doi.org/10.1126/science.1105606
Fletcher, L. N., Irwin, P. G. J., Orton, G. S., Teanby, N. A., Achterberg, R. K., Bjoraker, G. L., et al. (2008). Temperature and composition of Saturn's polar hot spots and hexagon. Science, 319(5859), 79–81. https://doi.org/10.1126/science.1149514
Fletcher, L. N., Orton, G. S., Sinclair, J. A., Guerlet, S., Read, P. L., Antuñano, A., et al. (2018). A hexagon in Saturn's northern stratosphere surrounding the emerging summertime polar vortex. Nature Communications, 9(1), 3564. https://doi.org/10.1038/s41467‐018‐06017‐3 Ford, A. L., & Browne, J. C. (1973). Rayleigh and Raman cross sections for the hydrogen molecule. Atomic Data, 5(3), 305–313. https://doi.
org/10.1016/S0092‐640X(73)80011‐7
Friedson, A. J., Wong, A. S., & Yung, Y. L. (2002). Models for polar haze formation in Jupiter's stratosphere. Icarus, 158(2), 389–400. https:// doi.org/10.1006/icar.2002.6885
Gérard, J.‐C., Bonfond, B., Gustin, J., Grodent, D., Clarke, J. T., Bisikalo, D., & Shematovich, V. (2009). Altitude of Saturn's aurora and its implications for the characteristic energy of precipitated electrons. Geophysical Research Letters, 36, L02202. https://doi.org/10.1029/ 2008GL036554
Gérard, J.‐C., Dols, V., Grodent, D., Waite, J. H., Gladstone, G. R., & Prangé, R. (1995). Simultaneous observations of the Saturnian aurora and polar haze with the HST/FOC. Geophysical Research Letters, 22(20), 2685–2688. https://doi.org/10.1029/95GL02645
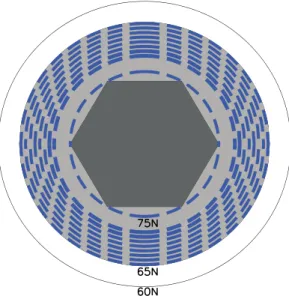
Figure 8. North polar schematic view of the regions on Saturn discussed in this paper. The latitudes listed here are planetocentric. The outer edge of the polar region shown is at 60°N. The outer dark collar (gray) runs from 64.7°N to the polar hexagon (filled in dark gray). The six vertices of the hexagon are placed at latitude 75.3°N, and the centers of the six sides are placed at 76.3°N (Antuñano et al., 2018). A typical sharp auroral arc is shown as a wide dashed blue circle just touching the six vertices; an outer diffuse aurora is shown as seven wide dashed blue circles drawn at 65–71°N (Lamy et al., 2018). The auroral and haze edge locations, as shown in the figures and movies here, are not fixed in time.
Acknowledgments
W. Pryor acknowledges support from NASA JPL's Cassini Project and Central Arizona College. L. Lamy
acknowledges support from CNES. J.C. G., D.G., and A.R. acknowledge support from the PRODEX program of the European Space Agency, managed with the help of the Belgian Federal Science Policy Office (BELSPO). Part of this work was performed by the Jet Propulsion Lab, Caltech, supported by the NASA Cassini Project. The Cassini UVIS data have been archived with the Planetary Data System at the New Mexico State University website https:// atmos.nmsu.edu/data_and_services/ atmospheres_data/Cassini/inst‐uvis. html.
Gérard, J.‐C., Grodent, D., Gustin, J., Saglam, A., Clarke, J. T., & Trauger, J. T. (2004). Characteristics of Saturn's FUV aurora observed with the Space Telescope Imaging Spectrograph. Journal of Geophysical Research, 109, A09207. https://doi.org/10.1029/2004JA010513 Gérard, J.‐C., Gustin, J., Pryor, W. R., Grodent, D., Bonfond, B., Radioti, A., et al. (2013). Remote sensing of the energy of auroral electrons
in Saturn's atmosphere: Hubble and Cassini spectral observations. Icarus, 223(1), 211–221. https://doi.org/10.1016/j.icarus.2012.11.033 Gierasch, P. J. (1989). Hexagonal polar current on Saturn. Nature, 337(6205), 309. https://doi.org/10.1038/337309a0
Godfrey, D. A. (1988). A hexagonal feature around Saturn's north pole. Icarus, 76(2), 335–356. https://doi.org/10.1016/0019‐ 1035(88)90075‐9
Godfrey, D. A. (1990). The rotation period of Saturn's polar hexagon. Science, 247(4947), 1206–1208. https://doi.org/10.1126/ science.247.4947.1206
Godfrey, D. A., & Moore, V. (1986). The Saturnian ribbon feature—A baroclinically unstable model. Icarus, 68(2), 313–343. https://doi.org/ 10.1016/0019‐1035(86)90026‐6
Grodent, D., Gérard, J.‐C., Cowley, S. W. H., Bunce, E. J., & Clarke, J. T. (2005). Variable morphology of Saturn's southern ultraviolet aurora. Journal of Geophysical Research, 110, A07215. https://doi.org/10.1029/2004JA010983
Grodent, D., Gustin, J., Gérard, J.‐C., Radioti, A., Bonfond, B., & Pryor, W. R. (2011). Small‐scale structures in Saturn's ultraviolet aurora. Journal of Geophysical Research, 116, A09225. https://doi.org/10.1029/2011JA016818
Grodent, D., Radioti, A., Bonfond, B., & Gérard, J.‐C. (2010). On the origin of Saturn's outer auroral emission. Journal of Geophysical Research, 115, A08219. https://doi.org/10.1029/2009JA014901
Gurnett, D. A., Groene, J. B., Persoon, A. M., Menietti, J. D., Ye, S.‐Y., Kurth, W. S., et al. (2010). The reversal of the rotational modulation rates of the north and south components of Saturn kilometric radiation near equinox. Geophysical Research Letters, 37, L24101. https:// doi.org/10.1029/2010GL045796
Gustin, J., Grodent, D., Radioti, A., Pryor, W., Lamy, L., & Ajello, J. (2017). Statistical study of Saturn's auroral electron properties with Cassini/UVIS FUV spectral images. Icarus, 284, 264–283. https://doi.org/10.1016/j.icarus.2016.11.017
Hunt, G. J., Cowley, S. W. H., Provan, G., Bunce, E. J., Alexeev, I. I., Belenkaya, E. S., et al. (2014). Field‐aligned currents in Saturn's southern nightside magnetosphere: Subcorotation and planetary period oscillation components. Journal of Geophysical Research: Space Physics, 119, 9847–9899. https://doi.org/10.1002/2014JA020506
Kim, S. J., Sim, C. K., Lee, D. W., Courtin, R., Moses, J. L., & Minh, Y. C. (2012). The three‐micron spectral feature of the Saturnian haze: Implications for the haze composition and formation process. Planetary and Space Science, 65(1), 122–129. https://doi.org/10.1016/j. pss.2012.02.013
Koskinen, T. T., Moses, J. I., West, R. A., Guerlet, S., & Jouchoux, A. (2016). The detection of benzene in Saturn's upper atmosphere. Geophysical Research Letters, 43, 7895–7901. https://doi.org/10.1002/2016GL070000
Lamy, L., Prangé, R., Pryor, W., Gustin, J., Badman, S. V., Melin, H., et al. (2013). Multispectral simultaneous diagnosis of Saturn's aurorae throughout a planetary rotation. Journal of Geophysical Research: Space Physics, 118, 4817–4843. https://doi.org/10.1002/jgra.50404 Lamy, L., Prangé, R., Tao, C., Kim, T., Badman, S. V., Zarka, P., et al. (2018). Saturn's northern aurorae at solstice from HST observations
coordinated with Cassini's Grand Finale. Geophysical Research Letters, 45, 9353–9362. https://doi.org/10.1029/2018GL078211 Lane, A. L., Hord, C. W., West, R. A., Esposito, L. W., Coffeen, D. L., Sato, M., et al. (1982). Photopolarimetry from Voyager 2: Preliminary
results on Saturn, Titan, and the rings. Science, 215(4532), 537–543. https://doi.org/10.1126/science.215.4532.537
Müller‐Wodarg, I. C. F., Mendillo, M., Yelle, R. V., & Aylward, A. D. (2006). A global circulation model of Saturn's thermosphere. Icarus, 180(1), 147–160. https://doi.org/10.1016/j.icarus.2005.09.002
Müller‐Wodarg, I. C. F., Moore, L., Galand, M., Miller, S., & Mendillo, M. (2012). Magnetosphere‐atmosphere coupling at Saturn: 1. Response of thermosphere and ionosphere to steady state polar forcing. Icarus, 221, 481–494.
Perry, J. J., Kim, Y. H., Fox, J. L., & Porter, H. S. (1999). Chemistry of the Jovian auroral ionosphere. Journal of Geophysical Research, 104(E7), 16541–16565. https://doi.org/10.1029/1999JE900022
Pryor, W.R. (1989). Auroral ultraviolet darkening on the outer planets, Ph.D. dissertation, University of Colorado.
Pryor, W. R., & Hord, C. W. (1991). A study of photopolarimeter system UV absorption data on Jupiter, Saturn, Uranus, and Neptune: Implications for auroral haze formation. Icarus, 91(1), 161–172. https://doi.org/10.1016/0019‐1035(91)90135‐G
Pryor, W. R., Rymer, A., Mitchell, D. G., Hill, T. W., Young, D. T., Saur, J., et al. (2011). The auroral footprint of Enceladus on Saturn. Nature, 472(7343), 331–333. https://doi.org/10.1038/nature09928
Radioti, A., Grodent, D., Yao, Z. H., Gérard, J.‐C., Badman, S. V., Pryor, W., & Bonfond, B. (2017). Dawn auroral breakup at Saturn initiated by auroral arcs: UVIS/Cassini beginning of Grand Finale phase. Journal of Geophysical Research: Space Physics, 122, 12,111–12,119. https://doi.org/10.1002/2017JA024653
Sánchez‐Lavega, A., del Río‐Gaztelurrutia, T., Hueso, R., Pérez‐Hoyos, S., García‐Melendo, E., Antuñano, A., et al. (2014). The long‐term steady motion of Saturn's hexagon and the stability of its enclosed jet stream under seasonal changes. Geophysical Research Letters, 41, 1425–1431. https://doi.org/10.1002/2013GL059078
Sánchez‐Lavega, A., Lecacheux, J., Colas, F., & Laques, P. (1993). Ground‐based observations of Saturn's north polar spot and hexagon. Science, 260(5106), 329–332. https://doi.org/10.1126/science.260.5106.329
Sánchez‐Lavega, A., Rojas, J., Acarreta, J., Lecacheux, J., Colas, F., & Sada, P. V. (1997). New observations and studies of Saturn's long‐lived north polar spot. Icarus, 128(2), 322–334. https://doi.org/10.1006/icar.1997.5761
Sanz‐Requena, J. F., Pérez‐Hoyos, S., Sánchez‐Lavega, A., Antuñano, A., & Irwin, P. G. J. (2018). Haze and cloud structure of Saturn's north pole and hexagon wave from Cassini/ISS imaging. Icarus, 305, 284–300. https://doi.org/10.1016/j.icarus.2017.12.043
Sayanagi, K. M., Baines, K. H., Dyudina, U. A., Fletcher, L. N., Sánchez‐Lavega, A., & West, R. A. (2018). Saturn's polar atmosphere. In K. Baines, M. Flasar, N. Krupp, & T. Stallard (Eds.), Saturn in the 21st Century (pp. 337–376). Cambridge: Cambridge University Press. Tao, C., Lamy, L., & Prangé, R. (2014). The brightness ratio of H Lyman‐α/H2bands in FUV auroral emissions: A diagnosis for the energy of
precipitating electrons and associated magnetospheric acceleration processes applied to Saturn. Geophysical Research Letters, 41, 6644–6651. https://doi.org/10.1002/2014GL061329
Tripathi, A. K., Singhal, R. P., & Singh, O. N. (2018). The generation of Saturn's aurora at lower latitudes by electrostatic waves. Journal of Geophysical Research: Space Physics, 123, 3565–3579. https://doi.org/10.1002/2017JA024804
West, R. A., Hord, C. W., Simmons, K. E., Hart, H., Esposito, L. W., Lane, A. L., et al. (1983). Voyager photopolarimeter observations of Saturn and Titan. Advances in Space Research, 3(3), 45–48. https://doi.org/10.1016/0273‐1177(83)90254‐5
West, R. A., Yanamandra‐Fisher, P. A., & Korokhin, V. (2015). Polarization of the gas giant planets, Saturn's rings, and Titan: Observations and interpretation. In L. Kolokolva, J. Hough, & A.‐C. Levasseur‐Regourd (Eds.), Polarimetry of Stars and Planetary Systems (pp. 320–339). Cambridge: Cambridge University Press.