Sedimentation of polydisperse droplets in liquid-liquid
separation processes
Pornprapa Chuttrakul, Andreas Pfennig
TU Graz, Institute of Chemical Engineering and Environmental Technology (CEET), Inffeldgasse25/C/II, 8010 Graz, Austria
Abstract
The effect of the driving-force parameters on coalescence and sedimentation was characterized experimentally using ultrasonic technique. Ultrasonic scanning additionally allows an exact determination of the boundary between the close-packed dispersion and the settling zone, which cannot be detected by any optical method even for very transparent systems. This technique gives quantitative information on the local hold-up in opaque systems. This information is used to determine the drop-size distribution of the dispersion and to validate and optimize existing evaluation tools for standardized settling experiments. Based on these data quantitative design of technical settlers for a given separation task is possible.
Introduction
Liquid-liquid extraction is a process using two immiscible liquids to extract compounds from one phase without high temperature requirement. One example for a technical implementation of this process is the mixer-settler. The optimization of settlers in the chemical and petroleum industry has become more relevant since the importance of bio-based chemicals is increasing. These chemicals often have a low vapor pressure which makes extraction a more economic separation process compared to distillation.
For settler design the sedimentation and coalescence behavior of droplets in the two-phase dispersion has to be determined. To investigate the settling behavior of the dispersion, batch settling experiments can be used. A schematic representation of the batch settling process according to Henschke [1] is shown in Fig. 1 for the lighter phase being dispersed.
Figure 1: Schematic representation of batch settling-experiment
height [h]
height of the dense‐packed
zone
time [t]
h
0h
dh
ph
ct
Esedimentation
coalescence
light phase
heavy phase
When the mixing is stopped, the droplets start to sediment to the top. At the boundary of the continuous phase the droplets coalesce to the bulk of the dispersed phase. By plotting the boundary between dispersed bulk and continuous phase over time, the coalescence curve can be constructed. Accordingly, the sedimentation curve is derived from the height separating the droplet free continuous phase from the sedimentation zone, where droplets still sediment towards their bulk.
If the sedimentation is faster than the coalescence of the droplets a dense packed zone is formed. In this zone drop-drop coalescence occurs, causing the drop diameter to increase. Current models [1] consider only a monodisperse droplet size, while in reality a polydisperse distribution will occur. The very fine droplets do not sediment with the majority of droplets leading to a secondary sedimentation. Second sedimentation cannot be evaluated by optical technique in most case. Ultrasonic scanning is a technique to overcome the mentioned obstacles. The major advantage of this technology is that it is able to analyze nontransparent systems when optical detection is not applicable [2].
Modeling
With polydisperse droplets, different sedimentation velocities will occur in the dispersion. The velocity of each droplet relative to the surrounding fluid depends on the droplet’s size. In the beginning of a settling experiment the polydisperse droplets are equally distributed in the sedimentation zone. Due to the faster sedimentation velocity of bigger droplets, separation zones of different sedimentation velocity are formed with time, containing only droplets below a certain size. This results in a change of the local hold-up, as depicted in Fig. 2.
Figure 2: Sedimentation of polydisperse droplets
As an starting point for modeling it is assumed that no coalescence occurs. In this case the moving upwards up front which can be observed is only determined by the local hold-up and the limiting drop size of the zone ahead.
Materials and Method
Cyclohexanone (analytical grade) was obtained from Carl Roth GmbH & Co.KG. In this experiment, an aqueous phase viscosity was adjusted by adding polyethylene glycol with a specified mean molecular weight of 4000 g/mol obtained from VWR BDH Prolabo. In
high-10. Minisymposium Verfahrenstechnik TU Wien, June 17th/18th, 2014
viscosity systems the settling speed of droplet swarms will significantly slow down [2]. Ultrapure water was used in the experiments. The saturated organic and aqueous phases were mixed with a speed motor at 800 rpm for 30 seconds. Then the mixed liquid was fed to the ultrasonic decanter. An ultrasonic suspension analyzer, type SUSS-2008 from Rhosonics Analytical B.V., Netherlands, was used to investigate the settling behavior. The viscosity and density of the aqueous and the organic phase are 4.39 mPa·s, 1015 kg/m3 and 3.71 mPa·s, 960 kg/m3, respectively. The interfacial tension is 1.94 mN/m.
Result and Discussion
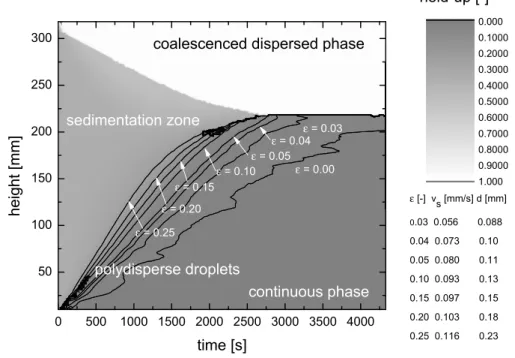
With the ultrasonic scanner the speed of sound as function of height and time was measured. The speed of sound can be converted into a hold-up plot as shown in Fig. 3. The varying levels of 1% hold up are represented in color scale. These hold-up data can be used to calculate the drop-size distribution in the sedimentation zone. The drop size can be calculated form the Reynolds number for swarm droplets and the sedimentation velocity of the droplets. The sedimentation velocity can be determined in the linear part of the sedimentation curve.
0 500 1000 1500 2000 2500 3000 3500 4000 50 100 150 200 250 300 ε = 0.25 ε = 0.20 ε = 0.15 ε = 0.00 ε = 0.10 ε = 0.05 ε = 0.03 h e ig h t [mm] time [s] 0.000 0.1000 0.2000 0.3000 0.4000 0.5000 0.6000 0.7000 0.8000 0.9000 1.000
coalescenced dispersed phase
sedimentation zone continuous phase hold-up [-] ε = 0.04 polydisperse droplets ε [-] v s [mm/s] d [mm] 0.03 0.056 0.088 0.04 0.073 0.10 0.05 0.080 0.11 0.10 0.093 0.13 0.15 0.097 0.15 0.20 0.103 0.18 0.25 0.116 0.23
Figure 3: Experimental result from ultrasonic analyzer: hold-up over time.
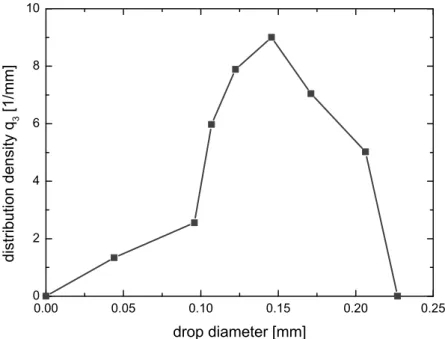
The drop size distribution density is plotted in Fig. 4. It is apparent that differing from previous model assumptions a rather wide drop-size distribution is found which needs to be accounted for in future model developments.
Conclusion
The results show that the height of the sedimentation zone and the coalescence curve can be determined from time and height dependent speed of sound with the ultrasonic scanner. Ultrasonic technology can be used to determine the boundary between close-packed dispersion, coalescence and sedimentation zone, even in opaque systems where optical detection fails.
0.00 0.05 0.10 0.15 0.20 0.25 0 2 4 6 8 10 d ist ri b u ti o n d e n si ty q3 [ 1 /mm] drop diameter [mm]
Figure 4: Overall droplets distribution in the sedimentation zone.
It addition, it allows quantitative evaluation of local hold-up in opaque systems. This information is used to determine the drop-size distribution of the dispersion and to validate and optimize our evaluation tool for standardized settling experiments. Based on these data quantitative design of technical settlers for a given separation task is possible accounting for arbitrary drop-size distributions.
References
[1] Henschke M., Schlieper L. H., Pfennig A., 2002: Determination of a coalescence parameter from batch-settling experiments. Chem. Eng. J. 85, 369–378
[2] Aunyindee, I., Castro, A.C., Chuttrakul, P. and Pfennig, A., 2013. Application of Ultrasonic Spectroscopy to Quantify Sedimentation of Polydisperse Emulsion. Minisymposium der Verfahrenstechnik.86-91
10. Minisymposium Verfahrenstechnik TU Wien, June 17th/18th, 2014
10. Minisymposium
Verfahrenstechnik
June 17th/18th, 2014
and
1. Österreichisches Partikelforum
June 18th, 2014
Vienna University of Technology (TU Wien)
Institute of Chemical Engineering
Proceedings of the 10th Minisymposium Verfahrenstechnik
(Tagungsband des 10. Minisymposium Verfahrenstechnik) 1st edition, June 2014
Publisher: Vienna University of Technology (TU Wien), Institute of Chemical Engineering, Getreidemarkt 9/166, A-1060 Wien
in cooperation with chemical-engineering.at (ZVR 708660229)
www.tuwien.ac.at www.chemical-engineering.at
Editor: Christian Jordan (TU Wien) Reviewer Team: Martin Miltner (TU Wien)
Thomas Laminger (TU Wien) Christian Jordan (TU Wien) Stefan Radl (TU Graz)
Dieses Material steht unter der Creative-Commons-Lizenz Namensnennung - Nicht kommerziell - Keine Bearbeitungen 4.0 International. Um eine Kopie dieser Lizenz zu sehen, besuchen Sie http://creativecommons.org/licenses/by-nc-nd/4.0/.
![Figure 1: Schematic representation of batch settling-experiment height [h]](https://thumb-eu.123doks.com/thumbv2/123doknet/6245028.162460/1.892.144.742.812.1126/figure-schematic-representation-batch-settling-experiment-height-h.webp)