1270 JOURNAL OF LIGHTWAVE TECHNOLOGY. VOL. 7. NO. 8 . AUGUST 1989
Stress Measurements on Fibers and Prefoms
P. LEDOUX, J. AUGE, L. Y . BONIORT, P. DUPONT, J. GOUDEAU, J. M. SAUGRAIN,J. C . ROUSSEAU, A N D Y . MOHANNA
Abstract-During the study of loss reduction on trapezoidal core
1.55-pm dispersion-shifted MCVD fibers, measurements of the axial stress distribution on preform and optical fibers have been investi- gated.
It has been shown that the internal stress profile of MCVD or SPCVD preforms is related to the expansion coefficients of different materials.
However, the results show that the level of fiber stress is linearly de-
pendent on drawing tension and that the stress profile is related to the glass transition temperature T8 of the different materials.
I. INTRODUCTION
EASUREMENTS of the axial stress distribution in
M
preform and optical fibers have been achieved as some preform preparation process and fiber drawing con- ditions have shown nonexplained phenomena such as in-dex profile modification from preform to fiber, the need to change standard fiber cutting conditions, and the higher influence of fiber mechanical properties to defects en- hanced by drawing tension.
These observations were made during the study of loss reduction on trapezoidal core 1.55-pm dispersion-shifted fibers, manufactured by the MCVD technique. These phenomena are related to the low temperatures and rela- tively high drawing tensions used [I]. The aim of the present study is to point out the formation mechanism of axial stress, to describe the method and the apparatus used for the measurements, and to present the results.
11. STRESS ORIGIN
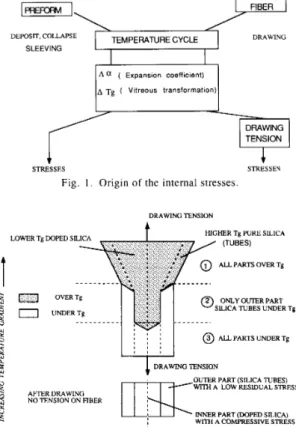
During the deposition, collapse, sleeving, and drawing steps, the preform or the fiber is heated and rapidly cooled down. They are made through concentric layers of mate- rials having different physical properties, natural or syn- thetic silica for the deposit or sleeving tubes, doped silica for the cladding or the core. Each shows a different ex-
pansion coefficient or glass transition temperature. The origin of the axial stresses is due to the relatively high drawing tension used with glass materials having dif- ferent softening temperatures in the fiber cross section (Fig. 1 ) . The connection of internal stresses with material viscosity is illustrated in Fig. 2 which shows a fiber with
DRAWNG DEPOSIT, COLLAPSE SLEEVING A Q ( Vitreous transformation) DRAWING STRESSES STRESSEF
Fig. I . Origin of the internal stresses.
DRAWING TENSION
HER Tg PURE SILICA LOWER Tg DOPED S
I
I
I
@ A L L P A R T S W E R T g DRAWING TENSIONc
$ AFlFRDRAWMG
0 O L m R PART (SILICA TUBES)
s
1
w1711 A LOW RESIDUAL STRESS INNER PART @OPED SILICA)
A COMPRESSIVE STRESS NO TENSION ON FIBER
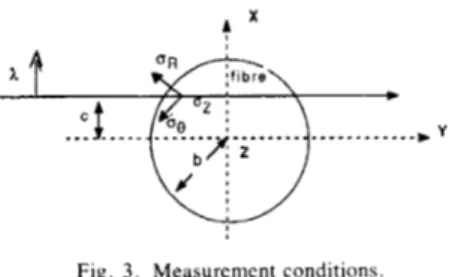
Fig. 2. Internal stresses are related to the viscosity difference
a pure silica tube and doped silica central part. The pre-
form drawing neck-down is close to the furnace temper- ature gradient. In the upper part both outside (silica tubes) and inside (cladding and core doped silica) are over their glass transition temperature ( T, )
.
In the middle part at lower temperature, the tensile stress is applied only on outer silica tubes which are under their transition temperature. In the bottom part, at an even lower temperature, all the parts of the fiber are under their transition temperature, the same stress effect is kept, and the doped silica part of the fiber stays almost under zero stress.
When the drawing tension is released, after capstan, a new equilibrium of axial stresses effects appears. The in- Manuscript received October 10, 1989; revised February 2 , 1989. This
P. Ledoux, J . Auge, L. Y . Boniort, P. Dupont, and J . Goudeau are with
work was supported by CNET-DAH.
Laboratoires de Marioussis, 91460 Marcoussis, France. Bezons, France.
ner parts (low Tg doped silica) stand a compressive axial
stress and the outer part (high Tg silica tubes), a balanc-
J . M. Saugrain, J . C. Rousseau, and Y. Mohanna are with CLTO, 95871
IEEE Log Number 89288 15. ing stress effect.
1271
L E D O U X et al.: STRESS M E A S U R E M E N T S O N FIBERS A N D PREFORMS
The levels of these stresses are directly dependent on the drawing tension and in inverse ratio on the relative cross sections of the different transition temperature parts of the fiber.
Complementary stress effects are induccd by expansion coefficient differences.
111. THEORETICAL ANALYSIS OF THE STRESS
DISTRIBUTION
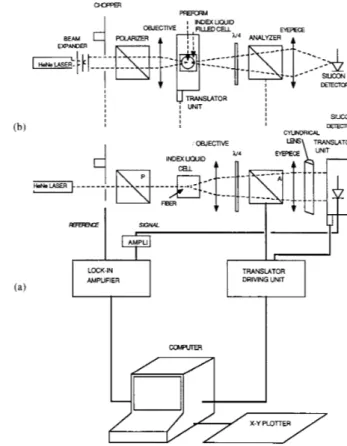
The stress distributions in a cylinder under thermoelas- tic forces are described in [4], U T , 00, az are the diagonal
components of the stress tensor following the cylindrical coordinates (Fig. 3). The axial stress is:
where E = elasticity module, v = Poisson coefficient,
a ( r ) = expansion coefficient gradient along the radius r ,
b = external radius, and A T = temperature difference be- tween the melting and the room temperature.
The above relationship is based on the following as- sumptions:
stresses are relevant of the thermoelasticity,
E and v are supposed to be independent of the tem-
external tensions are ignored, the fiber is supposed A T is constant everywhere in the sample,
az is only function of r .
perature or the chemical composition, to be infinite and unloaded,
IV. RELATIONSHIP BETWEEN STRESS A N D OPTICAL DELAY
Through the effect of nonisotropic stresses, the glass, initially isotropic glass, becomes birefringent. A plane wave propagating along Oy (Fig. 3) can be split into two
plane waves, one having the polarization vector parallel to Ox and the other following to Oz. The index difference
along Ox and Oz is proportional to the difference between the stress component perpendicular to the propagation di- rection [3], i.e.:
n, - nz = C(a, - a,)
where n, and nZ are the refraction indexes, ,a, and the stress components along x and
z .
C is the photoelasticconstant or Brewster coefficient (for silica glass C = 3.46 x ( M P a ) - ' ) .
After a travel d y in the material, the phase d6 between the two perpendicular waves is given by:
( 3 )
where X is the wavelength of the source.
This delay is related to the stress under the assumptions that the beam follows a straight line i,nside the fiber or the
Fig. 3 . Measurement conditions
preform, and the Brewster coefficient is independent on the radius.
Under these conditions from (1) we obtain the axial stress:
( 4 ) 1
j h
a R ( x ) dxa z ( r ) = -
Kc
ax (.2 - r 2 ) 1 / 2where R ( x ) is the retardation, and x is the position of the incident ray.
The computation of the stress distribution implies therefore the phase displacement profile measurement. It is determined by the quarter-wave method.
The straight vibration coming out the polarizer is bi- sector of the fiber neutral lines (Fig. 4(a)). At the output of the fiber (Fig. 4(b)), we collect an elliptical vibration
E for which one of the axis is parallel to OP and the axis
ratio b / u is related to the phase difference induced by the fiber. We have:
b
- = tan
(z).
a
This wave is allowed through a quarter-wave plate for which a neutral line Ox is parallel to OP direction of the
input wave (Fig. 4(c)). The plate introduces a new differ- ence in phase 7r/2 and resets a straight vibration OR hav-
ing an angle @ with Ox. The extinction is then obtained
again by rotating the analyzer of @ = p / 2 . The measure- ment of @ is performed all across the fiber or the preform allowing to obtain the phase displacement profile.
V. STRESS MEASUREMENTS [4]
Stress measurements for fiber and preform are ex- plained as follows.
A) The fiber, laid vertically in a cell filled with index matching liquid, is illuminated by a He-Ne horizontal laser beam
(A
= 633 nm) which is polarized at 45" of rotation from the neutral axis of the fiber (Fig. 5 ) . Themedian plan of the fiber is imaged on the detection plan and magnified by a set of low stress microscope objective and eyepiece. A quarter-wave plate is set with its optical axis oriented at 45" from the fiber neutral axis. Rotation of the analyzer to minimize the transmitted intensity points out the new polarization plan and then the relative retar- dation in the sample. A cylindrical lens is used to con-
P1
Y X
Fig. 4. Quarter-wave plate method. (a) At the fiber input. Fiber neutral lines: X, Y . (b) At the output of the fiber. (c) After the quarter-wave plate.
centrate light power onto the silicon detector which is moved by a translator unit. Equivalent translation accu- racy is +1.1 pm.
B) The preform is set horizontally, the laser beam is expanded to minimize the spot focused by a low stress objective onto the center of the preform. The beam is fo- cused by a low stress objective onto the center of the pre- form. The beam is focused again on a fixed silicon detec- tor after passing through the quarter-wave plate and analyzer as previously. The preform is moved vertically by a translator unit with 200-pm steps. Detailed infor- mation is given in Table I.
VI. STRESS PROFILE MEASUREMENT Stress profile measurements were performed on pre- forms manufactured by MCVD or surfaguide plasma as- sisted chemical vapor deposition (SPCVD) [5] tech- niques. Various index profiles were studied: step index, graded index, trapezoidal profile, and pure silica core op- tical fiber. The preform index was measured by PlOl pre- form analyzer (York Technology) with an accuracy of
JOURNAL OF LIGHTWAVE T E C H N O L O G Y , VOL. 7. NO 8, AUGUST 1989
! - + L A
EX UWID
EDCELL
U4
Fig. 5 . Stress measurement setup: (a) fiber (b) preform.
TABLE I
FIBER PREFORM
SAMPLING STEP 1 . 7 ~
MEASURING TIME 30 min 30 min
HIGHER ANGLE LIMlT EXPERIMENTAL DISPERSION
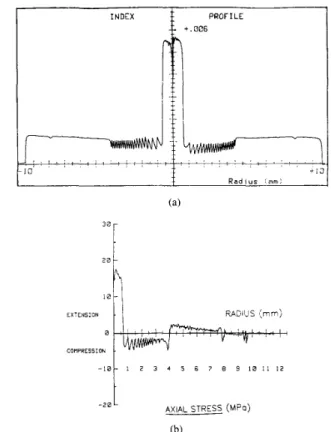
The observations which can be made from the profiles shown in Fig. 6 are: the axial stress variations az follow those of the index profile; a, is constant inside a homo- geneous doped region; the G e 0 2 doped part of the pre- form is in extension; the use of G e 0 2 dopant increases the axial stress; and the fluorine doping decreases the axial stress.
A series of stress profiles is shown in the Fig. 7 for the
trapezoidal core fiber drawing with increasing drawing tension on bare fiber (50, 80, 140 c N ) but with the same drawing speed (60 m l m i n ) .
These fibers are made from preforms processed with Heralux WG deposit tube and Suprasil F' sleeving tube.
'Heralux WG and Suprasil F are the Heraeus trademarks for natural and +0.0001 on the index difference: synthetic silica tubes.
LEDOUX er a l . : STRESS MEASUREMENTS ON FIBERS A N D PREFORMS 1273
1
+.C06PRoF1LE INDEXI
VY'
l . I 1 COUPRESSION . - 1 0 1 1 2 3 4 5 6 7 e 9 I0 1 1 12 AXIAL STRESS - 2 0t
(b)Fig. 6. (a) Actual preform step index profile (P101 preform analyzer). (b) Axial stress profile computed from relation (4).
0 1 (ma), E H T t N S l O N C O M P R E S S I O N
-.-
140 cN - l o o - --
50 cN CLADDING -150--
.200- AXIAL STRESSFig. 7. Axial stress profile of fibers drawn with increasing drawing ten- sion. ~ AXIAL STRESS (absolute value) 7 0 @ Cladding- *.-*'
.
*'
I- I I I I I I -50 100 150Fig. 8. Axial stress versus drawing tension in ( I ) optical cladding and (2)
silica tube.
n
a MPa drawing tension 140 CN EHTENSION OH content (ppm) S U P F 800-1200ppm COMPRESSION Hw WG ISoppm -50 S U P F S U P F 5 0 HLXWG I H L X W G 5 0 o ~H L X W G - S U P F J ~ ~Fig. 9. Dependence of the axial stress with the nature of the deposit tube and the sleeving tube.
The following observations can be deduced from Fig. 7 .
The axial stress is in compression inside the cladding and the core region, and is in extension inside the deposit tube.
The axial stress inside the sleeving tube is zero. The axial stress behavior in the deposit tube and the cladding is linear versus the drawing tension (Fig. 8). The extrapolation of both curves at zero stress corresponds to measured stress on preform.
The axial stress profile is related to the transition temperatures of materials, even for different silica tube quality this may be related to OH content (Fig. 9) *
In the last example, by sleeving a Suprasil F tube to a Heralux tube made preform, surface tension of the fiber is slightly in compression, and this would in- crease failure strength of the fiber [ 6 ] . No fatigue test
has been made and 1.5-percent elongation screen test showed no significant improvement on short-term fi- ber strength.
VII. CONCLUSION
The stress measurements on fiber are less accurate than those on preform (experimental dispersion reaches 15 per- cent instead of 5 percent). Precise manipulations are re- quired. The various observations made from measure- ments on preform show that the axial stress is related to the index profile and that the core axial stress increases with the GeOz content. The same observation can be made whether the preforms are prepared by SPCVD or MCVD processes.
1214 JOURNAL OF LIGHTWAVE TECHNOLOGY. VOL. 7, NO. 8. AUGUST 1989
The measurements performed on fiber show that the L. Y . Boniort, photograph and biography not available at time of publi- level of stress is linearly dependent on the drawing ten-..
sion, and that the stress profile stress is related to the glass transition temperature Tg of the different materials.
measurement is complementary to the more standard index profile mea- (P101 preform analyzer).
cation.
*
this method Of Philippe Dupont was born in Melun, France. in January 1942.
Marcoussis. Since 1972 he has worked in the Optics Group where he I S
involved in drawing fiber and optical measurements.
He i 5 an Engineer and in 1966 he joined the CGE Research Center in surement on fiber (refracted near field) or on preform
ACKNOWLEDGMENT
*
The authors would like to thank B. Poumellec for his help.
REFERENCES
[ I ] C . Brehm et a l . , “Improved drawing conditions for very low loss I .55- pm dispersion-shifted fiber,” Fiber and Integrated O p t . , vol. 7, no. [2] S . Timoshenko, Theory ofElnstirity, 2nd ed. New York: McGraw-
131 N. Shibata, “Nondestructive structure measurement of optical fiber 4, pp. 333-341. 1988.
Hill, 1951.
[41
preforms with photoelastic effect.” Japan. J . Appl. Phys., vol. 18, no. P. L. Chu and T. Whitbread, “Measurement of stress in optical fiber and preform,” Appl. O p t . , vol. 21, no. 23, pp. 4241-4245, Dec. 1, 1982.
D. Pavy, “Fabrication of optical preforms by a new surface plasma CVD process,” presented at the 12th ECOC, Barcelona, Spain, 1986. P. L. Chu and T . W. Whitbread, “Stress modification in optical fi- ber,” Electron. Lett.. vol. 20. no. 1 1 , pp. 449-450. May 1984. 7. pp. 1267-1276, July 1979.
*
Philippe Ledoux was born on October 2 I, 1959 in Bourges, France. He
received the technical degree in physical chemical sciences (D.U.T.) from Orsav University, France, in 1981, and he received the engineering degree
Jacques Goudeau was born on December 19, 1956. in Tours, France. He
received the engineering degree in material science in 1981 and the Ph.D. degree in 1983 in material physics from the University of Montpellier, France.
In 1983 he joined the CGE Research Center in Marcoussis and worked on the SPCVD process for optical preforms preparation. In 1988 he joined CLTO Alcatel Cable, Bezons, France. where he is involved in the research and development of preform fabrication processes.
*
Jean-Maxime Saugrain was born in Paris,
France, in 1959. He received the engineering de- gree from the Ecole Supirieure de Physique et Chimie Industrielles de Paris in 1984.
He joined CLTO Alcatel Cable. Bezons, France, and is now involved in research on optical fibers, including deposition and drawing pro- cesses.
*
I
- -
in material sciences from the Conservatoire National des Arts et Metiers, Paris, in 1988.
In 1982 he joined the CGE Research Center i n Marcoussis where he is involved in the elaboration and characterization of optical fibers.
Rousseau was born near Orleans, France, i n 1955. He re-
ceived the engineering degree in 1979 from the Ecole National Supirieure de Ceramique Industrielle of Sevres, France.
He ioined CLTO in 1980 where he worked on the MCVD process. Since
*
1987 he has been in charge of the Research Group at CLTO:Jacques Auge was born in La Clayette, France,
on July 31. 1954. He received the French 2nd Cycle degree from the University of Besanqon, France, in 1976 and the engineering degree from the Ecole Superieure d’optique, Orsay. France, in 1978.
In 1979 he joined CGE-Marcoussis, where his research work was on high-energy lasers. In 1980 he joined the Central Research Laboratories, Thomson-CSF, Orsay, France, where he worked on optical fiber characterization. Since 1983, he has been with CGE Research Center, Marcoussis. where he leads a team in the Photonics Department. His present research interests include single- mode fiber design and rare-earth-doped fiber amplifiers.
*
Yasser Mohanna was born on June 28, 1964 in Khiam, Lebanon. He re-
ceived the bachelor of engineering (B.E.) degree in electrical engineering from the American University of Beirut (A.U.B.), Lebanon, in 1986, and the master’s degree in optoelectronics from the National Polytechnic Insti- tute of Grenoble (INPG), France. in 1987. He has been working towards the Ph.D. degree at INPG since 1987.
From March to July 1987 he did his master’s research work at Fiber Optic Industries (FOI), France, on chromatic dispersion measurement of optical fibers. Since October 1987 he has been doing research work at Com- pagnie Lyonnaise des Transmissions Optiques (CLTO), France, on internal stress measurements of fibers and preforms.
View publication stats View publication stats