arXiv:1101.1899v1 [astro-ph.EP] 10 Jan 2011
January 11, 2011
Transiting exoplanets from the CoRoT space mission
⋆
XIII. CoRoT-14b: an unusually dense very hot Jupiter
B. Tingley1
,2, M. Endl3, J.-C. Gazzano4, R. Alonso5, T. Mazeh19, L. Jorda4, S. Aigrain7, J.-M. Almenara1
,2,
M. Auvergne8, A. Baglin8, P. Barge4, A. S. Bonomo4, P. Bord´e9, F. Bouchy10
,11, H. Bruntt8, J. Cabrera13
,22,
S. Carpano15, L. Carone20, W. D. Cochran3, Sz. Csizmadia13, M. Deleuil4, H. J. Deeg1
,2, R. Dvorak12,
A. Erikson13, S. Ferraz-Mello14, M. Fridlund15, D. Gandolfi17, M. Gillon5
,16, E. W. Guenther17, T. Guillot21,
A. Hatzes17, G. H´ebrard11, A. L´eger9, A. Llebaria4, H. Lammer18, C. Lovis5, P. J. MacQueen3, C. Moutou4,
M. Ollivier9, A. Ofir6, M. P¨atzold20, F. Pepe5, D. Queloz5, H. Rauer13
,23, D. Rouan8, B. Samuel9, J. Schneider22,
A. Shporer6, and G. Wuchterl17
(Affiliations can be found after the references)Received ; accepted
ABSTRACT
In this paper, the CoRoT Exoplanet Science Team announces its 14th discovery. Herein, we discuss the observations and analyses that allowed us to derive the parameters of this system: a hot Jupiter with a mass of 7.6 ± 0.6 Jupiter masses orbiting a solar-type star (F9V) with a period of only 1.5 d, less than 5 stellar radii from its parent star. It is unusual for such a massive planet to have such a small orbit: only one other known exoplanet with a higher mass orbits with a shorter period.
Key words.stars: planetary systems - techniques: photometry - techniques: radial velocities - techniques: spectroscopic
1. Introduction
Transiting exoplanets offer greater opportunities for the study and understanding of exoplanetary systems than those dis-covered by radial velocity measurements. Analysis of tran-sit light curves yields planetary radii and enables tests for rings (Barnes & Fortney, 2004), moons (Sartoretti & Schneider, 1999), and other planets through transit timing variations (Maciejewski et al., 2010), while high-precision observations of primary and secondary transits can reveal some details of plan-etary atmospheres (which is not currently possible for non-transiting planets) and albedos (Deming % Seager, 2009, e.g.), which is easier for transiting exoplanets but still possible for oth-ers.
The potential of transiting exoplanets has inspired consid-erable effort towards their discovery, both from the ground and from space. While ground-based searches have discov-ered the majority of known transiting exoplanets to this point, space-based missions offer the greatest potential for discovery. Observing from space allows nearly continuous sampling and much better photometric precision, which is adversely affected by the atmosphere. This makes it possible to detect long-period transiting exoplanets, whose transits can easily be longer than a typical night, and smaller exoplanets, whose transits are too shallow to be detected from ground.
The CoRoT (COvection ROtation and planetary Transits space mission was the first space mission dedicated primarily to
⋆ The CoRoT space mission, launched on December 27th 2006,
has been developed and is operated by CNES, with the contribution of Austria, Belgium, Brazil , ESA (RSSD and Science Programme), Germany and Spain.
searching for transits (Baglin et al., 2009). The mission has suc-cessfully demonstrated the advantages to space; given its orbit and the lack of atmosphere, it can observe the same field con-tinuously for up to five months with remarkably high relative precision. This enabled the discovery of both the first transiting ’Super-Earth’ (L´eger et al., 2009; Queloz et al., 2009, CoRoT-7b:) and the first temperate transiting gas giant (Deeg et al., 2010, CoRoT-9b).
In this paper, we announce the discovery of the 14th tran-siting planet discovered by CoRoT; an unusually massive ex-oplanet orbiting an F9V star with metallicity consistent with Solar. In Sec. 2, we detail the CoRoT photometry. In Sec. 3, we describe the ground-based follow-up observations that we used to confirm the planetary nature of CoRoT-14b. In Sec. 4, we dis-cuss our analysis of the light curves to extract the transit param-eters and present the inferred planetary paramparam-eters. In Sec. 5, we analyze the parent star. Finally, we conclude our paper in Sec. 6, where we discuss how the properties CoRoT-14b compare to the ensemble of known transiting planets.
2. CoRoT observations
CoRoT monitored the field which contains CoRoT-14b during its second Long-Run Anti-center pointing (LRa02). This run lasted from 16 Nov 2008 to 11 Mar 2009 and images a 3.5 square degree field in the constellation Monoceros. The details of the observations that comprise this run will appear in a forthcoming paper. Table 1 lists various IDs, coordinates, and magnitudes for CoRoT-14b.
CoRoT-14b was first identified as an object of interest on 9 Dec 2008 by the ’alarm mode’ pipeline (Surace et al., 2008)
Table 1. IDs, coordinates and magnitudes.
CoRoT window ID LRa02 E2 5503
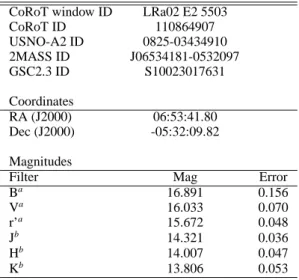
CoRoT ID 110864907 USNO-A2 ID 0825-03434910 2MASS ID J06534181-0532097 GSC2.3 ID S10023017631 Coordinates RA (J2000) 06:53:41.80 Dec (J2000) -05:32:09.82 Magnitudes
Filter Mag Error
Ba 16.891 0.156 Va 16.033 0.070 r’a 15.672 0.048 Jb 14.321 0.036 Hb 14.007 0.047 Kb 13.806 0.053
Notes. (a)Provided by Exo-Dat (Deleuil et al, 2009) based on 4-color photometry taken at the 2.5m INT.(b)from 2MASS catalog.
and the time sampling subsequently switched from the standard value of 512s to the 32s sampling reserved for interesting tar-gets. Figure 1 shows the final monochromatic light curve, con-taining 220188 photometric samples covering over 114 days. This light curve is the output of the standard CoRoT pipeline (Auvergne et al., 2009, version 2.1, see) in conjunction with further processing to remove outliers and correct for systemat-ics, as described in, e.g. Barge et al. (2008) and Alonso et al. (2008). It exhibits many discontinuities due to cosmic ray hits on the detector – a common occurrence in CoRoT light curves, as the satellite passes through the energetic-particle-rich South-Atlantic Anomaly each orbit. These can be corrected for, how-ever, yielding a fairly good cleaned light curve with a σrms of only around 2 mmag, indicating that the star is not particularly active.
The periodic transit signals are easily detectable in the cleaned light curve. It contains some 89 transits, 74 of them af-ter the sampling rate increased, yielding a final duty cycle of 82.7%. The initial trapezoid fitting, using the method outlined in Alonso et al. (2008) yielded a period (P) of 1.15214 ± 0.00013d and a primary transit epoch (T0) of 2454787.6694 ± 0.00053 and a depth of about 5 mmag. This information was passed on to the photometric and spectroscopic follow-up groups, to help schedule the ground-based follow-up observations necessary for confirmation or rejection.
3. Ground-based observations
The detection of a transit-like event in a light curve is only the beginning of the process: we find 10 to 20 candidates with CoRoT for each planet. In order to exclude as many candidates as possible without resorting to precious HARPS/HIRES ob-serving time, we perform a carefully considered sequence of ground-based follow-up observations.
3.1. Imaging - contamination
The first step is to image the field around the start for possible sources of photometric contamination that may combine with light from the target star to masquerade as a transit-like event
and to estimate how much, if at all, nearby stars dilute the transit (Deeg et al., 2009). This is necessary for CoRoT in particular be-cause the light passes through bi-prism to disperse the light over many pixels. While this allows much longer exposures (much like an ordinary defocusing would have) and some color infor-mation, it comes at the expense of an increase in contamination from nearby (and occasionally not so nearby) stars.
The photometric follow-up group obtained 20 images of the candidate during mid-transit on 27 February 2009 and 20 im-ages out-of-transit on 14 April 2009 with the IAC80 telescope on Tenerife, which has an aperture of 80 cm and a 10.6 x 10.6 arcminute field of view. Analysis revealed no strong signals in nearby stars that could be capable of producing a false positive nor any bright very close neighbors, but was not sensitive enough to detect the transit with any confidence. These images, when
stacked, are of similar quality and depth to those in large sur-veys such as 2MASS, so we are confident that no unknown, readily identifiable stars have eluded us. Contamination
anal-ysis (Deeg et al., 2009) revealed that 93 ± 0.5% of total light in the CoRoT mask came from target, with most of the rest (∼ 6%) coming from a star about 3 magnitudes fainter and 2.5 arcsec-onds to the south. This factor was included in the final transit analysis in Sec. 4.
3.2. Radial velocities - spectroscopy / orbital fit
We planned radial velocity (RV) observations only after the pho-tometric imaging with the IAC80 showed that this candidate had but a slight risk of being a false positive. Radial velocity (RV) observations of CoRoT-14 were performed with the HARPS spectrograph (Mayor et al., 2003), based on the 3.6 m ESO tele-scope (Chile) and the HIRES spectrograph (Vogt et al., 1994) installed on the 10 m Keck telescope in Hawaii.
HARPS was used with the observing mode obj AB, with-out simultaneous thorium in order to monitor the Moon back-ground light on the second fiber. The intrinsic stability of this spectrograph frees us from the need to capture a simultane-ous thorium spectrum, as the instrumental drift during an ex-posure is always smaller than the stellar RV photon noise un-certainties in this case. We took a series of 8 spectra with one hour exposures between November 22th 2009 and February 20th 2010 (ESO program 184.C-0639). We analyzed the HARPS data with the pipeline based on the cross-correlation techniques (Baranne et al., 1996; Pepe et al., 2002). The signal-to-noise per pixel at 550 nm of individual spectrum is in the range 3.7 to 7.1 for this faint target, one of the faintest followed-up by HARPS. Radial velocities were obtained by weighted cross-correlation with a numerical G2 mask.
We used HIRES in combination with its iodine (I2) cell to measure precise RVs. All observations were taken with a 7 arc-sec long slit of 0.861 arcarc-sec width, which yields a spectral re-solving power of R ≈ 50, 000. We obtained one spectrum of CoRoT-14 on 2009 December 5th without the I2-cell to serve as stellar template for the RV computation, which is required for calibration, and to determine stellar parameters. We took a sin-gle 1200 second exposure, which had a signal-to-noise ratio (per pixel) of only 10 at 550 nm, as seeing conditions on this particu-lar night were less than optimal. We also took one exposure with the I2-cell, to get an RV measurement that night. We collected five additional spectra of CoRoT-14 during January 2010 with the I2-cell over the course of three nights. The signal-to-noise ratios of these data range from 15 to 19 (at 550 nm). We used our Austral Doppler code (Endl, K¨urster & Els, 2000) to compute precise differential RVs. The results are given in Table 2. Since
the template spectrum had such poor S/N, we used a HIRES tem-plate of a similar, but much brighter, star (HD 12800) for the RV computation.
The results of the bisector analysis accompany the corre-sponding radial velocity measurements in Table 2. The bisector analysis was only possible with the HARPS spectra; the HIRES spectra do not have sufficient resolution to yield meaningful re-sults in this case. The bisectors weakly anti-correlate with the differential RVs (linear correlation coefficient R = −0.198), which in turn yields a probability of 0.637 that the bisectors and RVs are physically unrelated. We therefore conclude that the bi-sector analysis is consistent, albeit weakly, with no correlation.
We computed a Keplerian orbital solution for the HARPS and HIRES RV data using the Gaussfit generalized least-squares software of Jefferys, Fitzpatrick & McArthur (1988). We kept the values of the orbital period and primary transit epoch fixed to the parameters determined by the CoRoT photometry. The individual velocity zero-points of the HARPS and HIRES data were included as free parameters in the fitting process. We first fit a circular orbit to the data (see Figure 3). The χ2
redof this solu-tion is 1.50 and the values of the residual rms scatter around the fit are 118 m s−1(HARPS) and 78 m s−1(HIRES). The orbital fit yields an RV semi-amplitude K of 1230 ± 34 m s−1. Adopting a stellar mass of 1.13 ± 0.09 M⊙for CoRoT-14 (see next section), we obtain a mass of 7.6 ± 0.6 MJupfor the planet. From this, we can conclude that CoRoT-14b is very massive gas giant for its relatively short 1.5 day orbit and orbits only 0.027 AU from its parent star. The orbital parameters are summarized in Table 4.
We also explored the possibility of an eccentric orbit. Allowing eccentricity and periastron argument to be free param-eters, we derive an eccentricity of e = 0.019 ± 0.046, which a
χ2red of 1.63. We therefore conclude that the current RV data for CoRoT-14 are consistent with a completely circularized orbit.
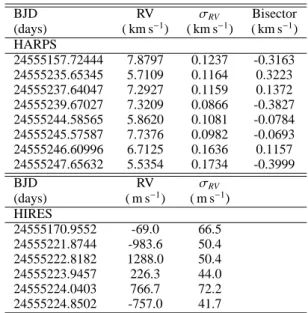
Table 2. Radial velocity measures, errors, and bisectors.
BJD RV σRV Bisector (days) ( km s−1) ( km s−1) ( km s−1) HARPS 24555157.72444 7.8797 0.1237 -0.3163 24555235.65345 5.7109 0.1164 0.3223 24555237.64047 7.2927 0.1159 0.1372 24555239.67027 7.3209 0.0866 -0.3827 24555244.58565 5.8620 0.1081 -0.0784 24555245.57587 7.7376 0.0982 -0.0693 24555246.60996 6.7125 0.1636 0.1157 24555247.65632 5.5354 0.1734 -0.3999 BJD RV σRV (days) ( m s−1) ( m s−1) HIRES 24555170.9552 -69.0 66.5 24555221.8744 -983.6 50.4 24555222.8182 1288.0 50.4 24555223.9457 226.3 44.0 24555224.0403 766.7 72.2 24555224.8502 -757.0 41.7
4. Analysis of the transit
We use the methodology described in Alonso et al. (2008) to ex-tract the transit parameters from the CoRoT photometry. To sum-marize: we use trapezoid fitting to obtain the period and tran-sit epoch, then use a χ2 analysis described by Gim´enez (2006)
on the phase-folded transit to determine transit and stellar pa-rameters (the transit center Tc, the orbital phase at first contact
θ1, the ratio of radii k, the orbital inclination i and u+ and u− coefficients, which are related to the quadratic limb darkening coefficients. We performed the transit fitting using a bootstrap analysis to constrain parameters space, based on the prescription outlined in Barge et al. (2008) and Alonso et al. (2008). Due to the faintness of the target, we chose not to fit the limb darkening coefficients: instead, we took the values from Sing (2010), with (conservative) error bars for these based on the uncertainties in the stellar parameters (ua = 0.43 ± 0.03 and ub = 0.24 ± 0.1). For each of the 500 bootstrap curves, we fixed the limb dark-ening coefficients, but instead of always using the same values, we extracted them from an random normal distribution with the appropriate width. Thus, for each bootstrap curve, we changed the contamination factor, the limb darkening coefficients, and the residuals, which we shifted circularly, with the initial parameters for the amoeba minimization algorithm perturbed randomly. The results of this analysis can be found in Table 4 and the transit and best fit can be seen in Figure 4.
5. Analysis of the parent star
We co-added the HARPS spectra to perform the analysis of the parent star, which yielded R ∼ 110 000 and S /N ≃ 45 at 5500 Å. From this, we were able to determine the v sin i (= 9 ± 0.5 km s−1). We obtained a first estimation of the effec-tive temperature of ∼ 5900 K by fitting the Hα line. We used these values as a starting point for the detailed analysis of the HARPS spectra with the VWA package (Bruntt et al., 2010). This analysis returned the following atmospheric parameters: Teff = 6035 ± 100 K, log g = 4.35 ± 0.15 cgs, [M/H]= 0.05 ± 0.15 dex, plus individual abundances for several elements, which are listed in Table 3 and shown in figure 5.
Table 3. Abundances of some chemical elements for the fitted
lines in the HARPS spectrum. The listed abundances are relative to the solar value. Last column gives the number of lines used.
Element [X/H] (1σ) Nb Lines Ca i 0.03 (0.16) 8 Ba ii −0.01 (0.25) 4 Sc ii −0.13 (0.15) 4 Ti i 0.22 (0.22) 5 Ti ii 0.21 (0.15) 8 Fe i 0.05 (0.15) 38 Fe ii −0.06 (0.18) 6 Ni i 0.06 (0.16) 21 Si i 0.14 (0.20) 4 Si ii -0.01 (2.01) 1
The large error bars, especially on the surface gravity and the metallicity, are due to the low signal-to-noise ratio of the spectra due to the faintness of the star. Using the density from the transit fit and the effective temperature and the metal-licity from the spectroscopic analysis, we derived a mass of 1.13 ± 0.09M⊙, and a radius of 1.21 ± 0.08R⊙ for the star using the dedicated STAREVOL evolutionary tracks (Palacios, private communication; Siess, 2006). As a final check, we ascer-tained that the inferred surface gravity agreed with the spectro-scopic value, log gevol= 4.33 ± 0.14 cgs.
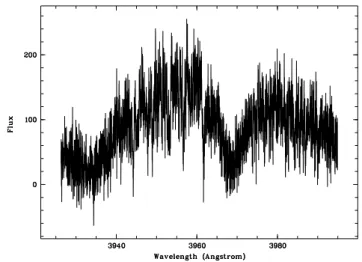
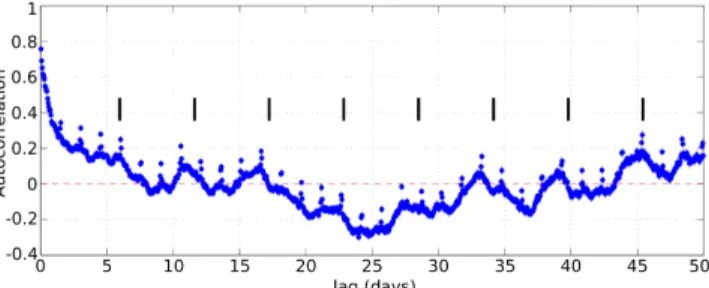
As the RV spectra are slightly less than ideal, an examina-tion of the activity of the parent star is warranted. While the star is photometrically variable on the level of only a few millimags, other methods can be use to corroborate this, in particular the Ca II H and K lines. These are shown in figure 6 and show no evi-dence for emission in the cores of these lines, which is consistent with a star of low magnetic activity. While the activity level is low, it is non-zero. We decided therefore to attempt to estimate the stellar rotation period from the CoRoT light curve using an auto-correlation analysis. The results of this analysis can be seen in figure 7. We discover local peaks in the auto-correlation that are separated by 5.66 days, which we infer to be the rotation period of the star. This compares fairly well with the rotational period that can be inferred from v sin i and the radius of the star, would be 6.8 ± 0.8 days, assuming the stellar rotation axis is perpendicular to the line of sight. This result is confirmed by
a discrete Fourier transform of the photometric time series, although the results are somewhat less convincing (see fig-ure 8).
We estimated the distance of the star to be 1340 ± 110 pc by comparing the Teffto the tables in Allen’s Astrophysical
Quantities (Cox, 2000) to obtain the absolute V magnitude and corresponding (J-K) color to constrain the extinction. This was then combined with the observed V magnitude to get the distance.
6. Discussion
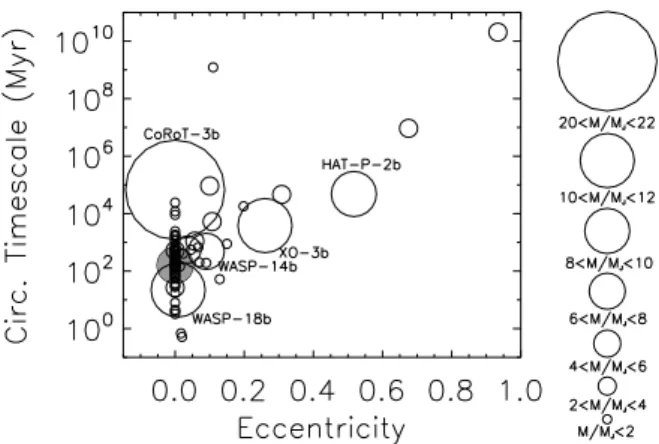
The most interesting quality of CoRoT-14b is its mass relative to its period – only WASP-18b is both more massive and dense while being closer to its parent star. Figure 9 demonstrates this, plotting period vs. eccentricity for the know exoplanets with periods less than 10 days. When examining this plot, another characteristic of massive planets becomes apparent: they have a strong tendency towards elliptical orbits – only 3 of the 12 (∼25%)transiting exoplanets that have masses greater than 2 MJ and periods less than 10 days have e = 0, not including those planets with unknown eccentricity, while 3 more of these orbit stars too faint to allow the orbital eccentricity to be measured readily. By contrast, transiting planets with masses less than 2 MJ and periods less than 10 days have only a ∼21% chance (13/63) of having a non-zero eccentricity. While it is impossi-ble to draw any definitive conclusions with such a small sample size, these numbers suggest that that more massive planets may in truth have longer periods and higher eccentricities than less massive planets, although it is possible that some of these non-zero eccentricities are artifacts arising from the small number of RV measurements (Shen & Turner, 2008).
An examination of the theory for tidal circularization and orbital decay, arising from tides induced by the parent star on the exoplanet, shows that this is not unexpected (see Figure 10). Both of these phenomena have timescales that go as QMpM⋆2/3P
13/3R−5
p (Dobb-Dixon, Lin & Mardling, 2004; Ferraz-Mello, Rodriguez & Hussman, 2008, see e.g.). Assuming that Q, the quality factor, is approximately equal for all gas gi-ants, we would expect that high mass planets with small radii will maintain their eccentricity (and semi-major axis) longer – a tendency further accentuated by the fact that more massive plan-ets have higher surface gravity, allowing them to resist inflation caused in part by by incident radiation from the parent star and therefore having smaller radii.
However, this does not explain the circular orbit of the high mass planet/brown dwarf CoRoT-3b (Bouchy et al., 2008) – its circularization timescale is significantly longer than the age of
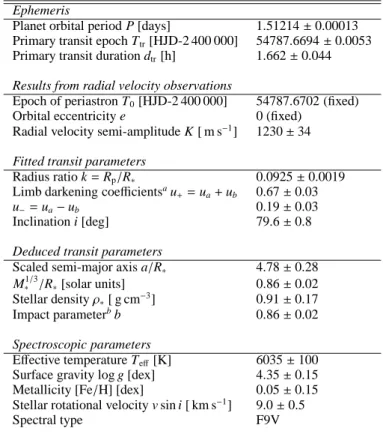
Table 4. Planet and star parameters.
Ephemeris
Planet orbital period P [days] 1.51214 ± 0.00013 Primary transit epoch Ttr[HJD-2 400 000] 54787.6694 ± 0.0053 Primary transit duration dtr[h] 1.662 ± 0.044 Results from radial velocity observations
Epoch of periastron T0[HJD-2 400 000] 54787.6702 (fixed) Orbital eccentricity e 0 (fixed)
Radial velocity semi-amplitude K [ m s−1] 1230 ± 34 Fitted transit parameters
Radius ratio k = Rp/R∗ 0.0925 ± 0.0019
Limb darkening coefficientsau
+= ua+ ub 0.67 ± 0.03
u−= ua−ub 0.19 ± 0.03
Inclination i [deg] 79.6 ± 0.8 Deduced transit parameters
Scaled semi-major axis a/R∗ 4.78 ± 0.28
M∗1/3/R∗[solar units] 0.86 ± 0.02
Stellar density ρ∗[ g cm−3] 0.91 ± 0.17
Impact parameterbb 0.86 ± 0.02 Spectroscopic parameters
Effective temperature Teff[K] 6035 ± 100 Surface gravity log g [dex] 4.35 ± 0.15 Metallicity [Fe/H] [dex] 0.05 ± 0.15 Stellar rotational velocity v sin i [ km s−1] 9.0 ± 0.5
Spectral type F9V
Stellar and planetary physical parameters from combined analysis
Star mass [M⊙] 1.13 ± 0.09
Star radius [R⊙] 1.21 ± 0.08
Distance of the system [pc] 1340 ± 110 Stellar rotation period Prot[days] 5.7 Age of the star t [Gyr] 0.4 - 8.0 Orbital semi-major axis a [AU] 0.0270 ± 0.002 Planet mass Mp[MJ]c 7.6 ± 0.6 Planet radius Rp[RJ]c 1.09 ± 0.07 Planet density ρp[g cm−3] 7.3 ± 1.5 Equilibrium temperaturedTper
eq [K] 1952 ± 66
Notes. (a) I(µ)/I(1) = 1 − u
a(1 − µ) − ub(1 − µ)2, where I(1) is the specific intensity at the center of the disk and µ = cos γ, where γ is the angle between the surface normal and the line of sight.(b)b = a·cos i R∗ (c)Radius and mass of Jupiter taken as 71492 km and 1.8986×1030g, respectively.(d) Zero albedo equilibrium temperature for an isotropic planetary emission.
the universe. It is possible that CoRoT-3b might be eccentric – the RV observations used to measure this parameter are scattered over a year, making it difficult to rule out small, non-zero eccen-tricities. If both the adopted zero eccentricity and Q factor are correct, the properties of CoRoT-3b would be indicative of in situ formation rather than migration, the generally accepted pro-cess by which short-period planets end up where they are. By contrast, CoRoT-14b is less massive and closer to its host star, leading to a much shorter circularization timescale. The obser-vations of CoRoT14b are currently consistent with a circularly orbit – it would therefore come as no surprise if this turns out to be the case in the end.
Acknowledgements. The team at the IAC acknowledges support by grant
ESP2007-65480-C02-02 of the Spanish Ministerio de Ciencia e Inovaci´on. M. Gillon acknowledges support from the Belgian Science Policy Office in the form of a Return Grant. Data presented herein were obtained at the W.M. Keck Observatory from telescope time allocated to the National Aeronautics
and Space Administration through the agency’s scientific partnership with the California Institute of Technology and the University of California. The Observatory was made possible by the generous financial support of the W.M. Keck Foundation. The HIRES observations we obtained fell under the auspices of NASA’s key science program to support the CoRoT mission. The authors wish to recognize and acknowledge the very significant cultural role and reverence that the summit of Mauna Kea has always had within the indigenous Hawaiian community. We are most fortunate to have the opportunity to conduct observa-tions from this mountain.
References
Alonso, R., Auvergne, M., Baglin, A., et al. 2008, A&A, 482, L21 Auvergne, M., Bodin, P., Boisnard, L., et al., 2009, A&A, 506, 411
Baglin, A., Auvergne, M., Barge, P., et al., 2009, Transiting Planets, Proceedings of the International Astronomical Union, IAU Symposium, 253, 71 Baranne, A., Queloz, D., Mayor, M., et al. 1994, A&AS, 119, 373 Barge P., Baglin A., Auvergne M., et al., 2008, A&A, 482, L17 Barnes, J. W. & Fortney, J. J. 2004, ApJ, 616, 1193
Bouchy, F., Queloz, D., Deleuil, M. et al. 2008, A&A, 482, L25 Bruntt, H., et al. 2010, MNRAS, 746, forthcoming
Cox, A. N. 2000, Allen’s Astrophysical Quantities (New York: Springer) Deming, D. & Seager, S. 2009, Nature, 462, 302
Deeg, H. J., Gillon, M., Shporer, A., et al., 2009, A&A, 506, 343 Deeg, H. J., Moutou, C., Eriksson, A., et al., 2010, Nature, 464, 384 Deleuil, M., Deeg, H. J., Alonso, R., et al. 2008, A&A, 491, 889 Dobb-Dixon, I., Lin, D. N. C. & Mardling, R. A. 2004, ApJ, 610, 464 Endl, M., K ¨urster, M., Els, S., 2000, A&A, 362, 585
Ferraz-Mello, S., Rodriguez, A. & Hussmann, H. 2008, Cel. Mech, Dyn., Astron. 101, 171
Gim´enez, A. 2006, A&A, 450, 1231
Jefferys, W. H., Fitzpatrick, M. J., & McArthur, B. E. 1988, Celest. Mech., 41, 3 L´eger, A., Rouan, D., Schneider, J., et al., 2009, A&A, 506, 287
Maciejewski, G., Dimitrov, D., Neuhaeuser, A. et al. 2010, MNRAS, accepted Mayor, M., Pepe, F., Queloz, D., et al. 2003, The Messenger, 114, 20
Palacios, A., Calculation of dedicated evolutionary tracks using STAREVOL, pri-vate communication.
Pepe, F., Mayor, M., Galland, F., et al. 2002, A&A, 388, 632 Queloz, D., Bouchy, F., Moutou, C., et al., 2009, A&A, 506, 303 Sartoretti, P. & Schneider, J. 1999, A&AS, 134, 553
Seager, S. & Mall´en-Ornelas, G. 2003, ApJ, 585, 1038 Shen, Y. & Turner, E. L. 2008, ApJ, 685, 553 Siess, L. 2006, A&A, 448, 717
Sing, D. K. 2010, A&A, 510, 21
Sozzetti, A., Torres, G., Charbonneau, D., et al. 2007, ApJ, 664, 1190 Surace, C., Alonso, R., Barge, P., et al., 2008, Proceedings of the SPIE, Volume
7019
Triaud, A. H. M. J., et al. 2010, A&A, submitted
Vogt, S. S., Allen, S. L., Bigelow, B. C., et al. 1994, SPIE, 2198, 362
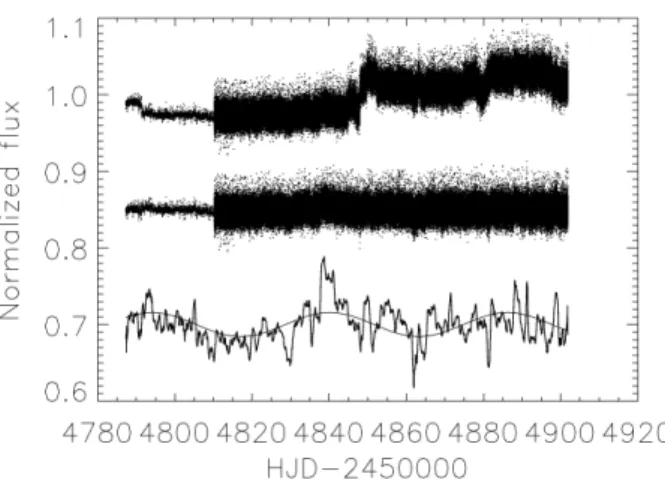
Fig. 1. The processed and normalized transit light curve of
CoRoT-14. The top plot shows the final processed photometry which corrects for jitter and other effects, but not hot pixels – which clearly have a strong effect. The middle plot shows the same data, corrected for hot pixels. These plots show that the integration time changed from 512s to 32s at HJD = 2454810.2. The bottom plot is the smoothed light curve, multiplied by a fac-tor of ten to show detail. It emphasizes the low level of activity, around 2 mmag. See Sect. 5 for more information on the activity of the parent star. While the light curve on the surface appears to be slightly sinusoidal, this is in fact not the case: removing the best-fit sinusoid (which has an amplitude of about 1.6 mmag and a period of about 46 days, corresponding to neither the ro-tation period of the star, the period of the transit, nor any known instrumental effects) reduces the σrmsby only about 10%.
1 Instituto de Astrof´ısica de Canarias, E-38205 La Laguna, Tenerife, Spain
2 Dpto. de Astrof´ısica, Universidad de La Laguna, 38206 La Laguna, Tenerife, Spain
3 McDonald Observatory, University of Texas at Austin, Austin, 78712 TX, USA
4 Laboratoire d’Astrophysique de Marseille, 38 rue Fr´ed´eric Joliot-Curie, 13388 Marseille cedex 13, France
5 Observatoire de l’Universit´e de Gen`eve, 51 chemin des Maillettes, 1290 Sauverny, Switzerland
6 Wise Observatory, Tel Aviv University, Tel Aviv 69978, Israel 7 Department of Physics, Denys Wilkinson Building Keble Road,
Oxford, OX1 3RH
8 LESIA, UMR 8109 CNRS, Observatoire de Paris, UPMC, Universit´e Paris-Diderot, 5 place J. Janssen, 92195 Meudon, France 9 Institut d’Astrophysique Spatiale, Universit´e Paris-Sud 11 & CNRS
(UMR 8617), Bˆat. 121, 91405 Orsay, France
10 Observatoire de Haute Provence, 04670 Saint Michel l’Observatoire, France
11 Institut d’Astrophysique de Paris, 98bis boulevard Arago, 75014 Paris, France
12 University of Vienna, Institute of Astronomy, T¨urkenschanzstr. 17, A-1180 Vienna, Austria
13 Institute of Planetary Research, German Aerospace Center, Rutherfordstrasse 2, 12489 Berlin, Germany
14 IAG, Universidade de Sao Paulo, Brazil
15 Research and Scientific Support Department, ESTEC/ESA, PO Box 299, 2200 AG Noordwijk, The Netherlands
16 University of Li`ege, All´ee du 6 aoˆut 17, Sart Tilman, Li`ege 1, Belgium
17 Th¨uringer Landessternwarte, Sternwarte 5, Tautenburg 5, D-07778 Tautenburg, Germany
18 Space Research Institute, Austrian Academy of Science, Schmiedlstr. 6, A-8042 Graz, Austria
19 School of Physics and Astronomy, Raymond and Beverly Sackler Faculty of Exact Sciences, Tel Aviv University, Tel Aviv, Israel 20 Rheinisches Institut f¨ur Umweltforschung an der Universit¨at zu
K¨oln, Aachener Strasse 209, 50931, Germany
21 Observatoire de la Cˆote d’Azur, Laboratoire Cassiop´ee, BP 4229, 06304 Nice Cedex 4, France
Fig. 2. The full phase-folded light curve of CoRoT-14. The light
curve shown has been corrected for jitter, hot pixels, and other effects, then folded with the known period for CoRoT-14b, with the center of transit at 0. These observations were also binned into 100 evenly-spaced bins, represented by a gray line. No out-of-transit variations are apparent.
Fig. 3. RV orbital fit. This figure shows the orbital fit to the
HIRES and HARPS observations, using the period found by the CoRoT photometry, along with the residuals, assuming a circu-lar orbit. A fit was made without this assumption, but returned a value for the eccentricity that was consistent with zero.
Fig. 4. Phase-folded transit and residuals. This figure shows the
phase-folded transit from the CoRoT photometry with the best-fit model transit (top) along with the O-C residuals (bottom).
Fig. 5. Mean abundances for 14 elements in CoRoT-14 HARPS
spectrum. White circles correspond to neutral lines, red boxes to singly ionized lines and the yellow area represents the mean metallicity within one sigma error bar.
Fig. 6. Calcium II H and K lines. This plot shows the Calcium
II H and K lines obtained from the HIRES spectra, with Ca II K on the left (centered at about 3929Å) and Ca II H on the right (centered at about 3978Å. No evidence for emission in the cores of these lines can be seen, which is consistent with a star of low magnetic activity.
Fig. 7. Rotational Period from Auto-correlation. This figure
shows the auto-correlation of the CoRoT-14 photometry, which is created by correlated the light curve with a temporally-shifted version of itself (the lag listed on the X-axis). The broad local maxima at multiples of 5.66 days (marked by the vertical black lines) correspond to the rotation of the star, visible through the photometric footprints of activity-induced variations on the stel-lar photosphere. Also apparent in this figure are number short, sharp periodic features: these are the periodic transit that the au-tocorrelation function detects.
Fig. 8. Rotational Period using the Discrete Fourier Transform.
This figure shows the discrete Fourier transform power series of the CoRoT-14 photometry. This approach also detects the plane-tary transit and confirms the rotation period (depicted by dotted lines) found by the auto-correlation, albeit less convincingly.
Fig. 9. Planetary period vs. eccentricity and mass. This
fig-ure shows period plotted against eccentricity for all transit-ing exoplanets with periods less than 10 days, with circle size indicative of planetary mass. Two-thirds of the 12 plan-ets with M > 2MJ have non-zero eccentricities; those with zero eccentricity include the lowest mass planet in the sam-ple (Kesam-pler-5b) and the most massive (3b). CoRoT-14b stands out by virtue of its high mass and short period – only WASP-18b has a higher mass and a shorter period. Interestingly, WASP-18b has a small but significantly non-zero eccentricity (Triaud et al., 2010). All planetary parameters from the Exoplanet Encyclopedia (http://exoplanet.eu), except for CoRoT-14b.
Fig. 10. Circularization timescale vs. eccentricity and planetary
mass. This figure shows the tidal circularization timescales of the known transiting exoplanets plotted again eccentricity assuming that the tidal quality factor Q = 106, with circle size indicative of the planetary mass. The tidal quality factor is a critical and technically unknown value – short-period transiting exoplanets offer perhaps the best laboratory for increasing our understand-ing of this value. The circles along the bottom of the plot indicate the different planet mass ranges for each symbol size. CoRoT-14b is shaded gray and is otherwise readily identifiable by its large mass, zero eccentricity, and short circularization timescale: only WASP-18b is both more massive and has a shorter circular-ization timescale. Notice that many of the more massive plan-ets have relatively long circularization timescales and, unsur-prisingly, tend to have eccentric orbits. While the numbers are small, there is a weak tendency for massive (M > 2MJ) planets to have higher eccentricities at a given period. The notable ex-ception of this hypothesis is the most massive object included in the plot: CoRoT-3b. This could be indicative of different forma-tion mechanism than the smaller planets. Planetary parameters from the Exoplanet Encyclopedia (http://exoplanet.eu), except for CoRoT-14b.