TEMPORAL CHANGE OF DISTANCE TO NATURE
INDEX FOR ANTHROPOGENIC INFLUENCE
MONITORING IN A PROTECTED AREA AND ITS
BUFFER ZONE
Dayana Almeidaa*, Marie Andréb, Eliziane Carla Scariotc, Angela Terumi Fushitaa, José Eduardo dos Santosa, Jan
Bogaertb
aGraduate Program in Ecology and Natural Resources, Federal University of São Carlos, Washington LuisHighway, Km 235, 13565-905 Sao
Carlos, Brazil
b Biodiversity and Landscape Unit, Gembloux Agro-BioTech (University of Liège), passage des Déportés, 2, 5030 Gembloux, Belgium c Federal Institute Catarinense (IFC), Joaquim Garcia Street, 88340055 Camboriú, Brazil
* Corresponding author. E-mail address: almeida.dds@gmail.com (D. Almeida).
ABSTRACT
This study applied and evaluated the temporal change of the Distance to Nature index (D2N) for land use and cover monitoring in the Irati National Forest and its buffer zone (Southern Brazil) between 1986 and 2016. This study addressed the following questions: (1) Which land use dynamics were observed between 1986 and 2016 in the Irati National Forest and its buffer zone? (2) Is the analysis of D2N evolution relevant to assess landscape dynamics in protected areas and their buffer zones? The degree of naturalness decreased after 1986. Statistical analyses showed a significant difference in the D2N values between 1997 and all other years. We observed an increase of D2N values in the 30-year period. The spatial D2N trajectory map between 1986 and 2016 shows where the D2N values changed, and enables us to infer where the differences observed could compromise the ecological condition of the protected area and its buffer zone. The results demonstrate that an analysis by means of D2N can be an effective tool to monitor and assess anthropogenic influences on biodiversity in buffer zones around protected areas.
KEYWORDS:Temporal changes, Distance to Nature index, Protected areas, Buffer zone, Hemeroby, Landscape dynamics, Faxinais
1. Introduction
Among the strategies for biodiversity conservation, we can highlight the legally protected areas, which are portions of land or sea intended for the maintenance of biological diversity and other natural processes in situ
(Scherl et al., 2006). Land use effects on these areas require to be quantified, especially where there is a direct anthropogenic influence (Davis & Hansen, 2011). Several authors emphasize the need for the management and monitoring of buffer zones around protected areas, and not just the establishment of these areas (Wallace et al., 2005; Andrew & DeFries, 2007; Perelló et al., 2012; Gray et al., 2016). In Brazil, the Brazilian Protected Areas System established buffer zones as areas where the anthropogenic activities are accepted only under specific regulatory restrictions, in order to minimize negative impacts on biodiversity in all the Brazilian biomes (Brasil, 2000).
An important tool to buffer zone management is landscape analysis (Mariota et al., 2012), for detecting and quantifying anthropogenic effects in the landscape (Bogaert et al., 2011), especially by means of landscape pattern indices.
Rüdisser et al. (2012) developed an easily interpretable and highly comprehensible index called "Distance to Nature (D2N)" as a tool to support the planning and evaluation of policy measures. By applying and analyzing D2N in temporal sets of data from a periurban area in the Democratic Republic of the Congo, André, et al. (in press) evaluated the evolution of D2N by a temporal change map. Nevertheless, the study of the temporal evolution of
D2N in protected areas and its buffer zone has not yet been reported.
We therefore analyzed the application of D2N to study the landscape temporal change in the Irati National Forest and its buffer zone (Southern Brazil) between 1986 and 2016. This study addressed the following questions: (1) Which land use dynamics were observed between 1986 and 2016 in the Irati National Forest and its buffer zone? (2) Is the analysis of D2N evolution relevant to assess landscape dynamics in protected areas and their buffer zones?
2. Materials and methods
2.1. STUDY AREA
The study area consisted of the Irati National Forest and its buffer zone of 10 km width, which encloses an area of 69.077 ha. This width was based on standards predetermined by one of the funding projects, the Conservabio.
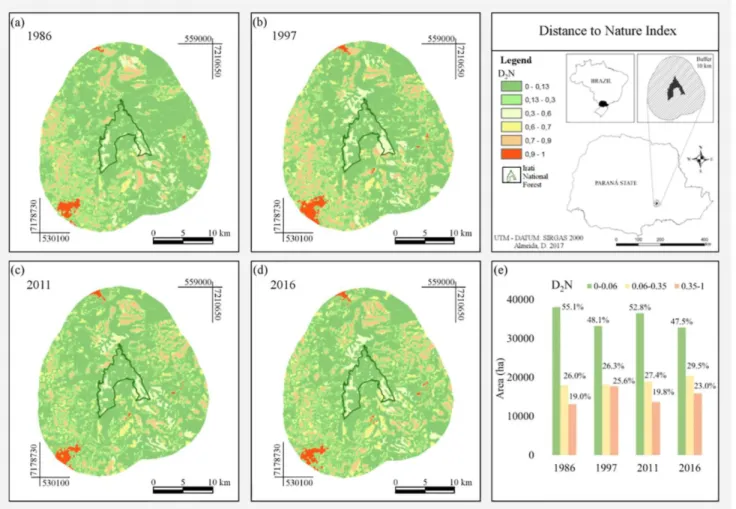
Fig. 1. Distance to Nature (D2N) index values for the Irati National Forest (Brazil) buffer zone in 1986 (a), 1997 (b), 2011 (c) and 2016 (d). In (e) there is a summary of the D2N values classified into the three categories. The study area localization is showed at the legend.
This area is situated on the Second Plateau of Paraná (Mazza et al., 2016) (Fig. 1). The climatic region is classified as Cfb (Köppen classification system), Mesothermal - Humid Subtropical, characterized by cool summers, frequent and severe frosts and no dry season (Caviglione et al., 2000). The buffer zone of the Irati National Forest is a transition area regarding geomorphological and phytophy-siognomic aspects. The Eastern portion (Teixeira Soares and Fernandes Pinheiro municipalities), is characterized by smoother reliefs and initially by grassland mosaics associated with Araucaria Forest (Maack, 2002). The original landscape in the Central and Western portions (Irati and Imbituva municipalities) was forest-dominated. These biotic characteristics influenced both the human occupation history and, consequently, the development of different agricultural systems. In the Eastern region, intensive farming with large farms can easily be identified, while in the Western region small farms are
observed, predominantly related to family farm systems (Almeida, 2017). The Western region also has an important "biocultural" system (Hong, 2014; Bogaert et al., 2014) called Faxinais, a silvopastoral system characterized by the extraction of non-timber products (Araucaria angustifolia (Bertol.) Kuntze seeds and Ilex paraguariensis A. St. Hill. leafs), and concomitant animal subsistence production in shared areas among the local farmers (Yu, 1988). Furthermore, Yu (1988) states that there is some evidence that the Faxinais promoted conservation in Paraná State as a whole.
2.2. LAND USE AND COVER AND D
2N DYNAMICS
The land use classification was carried out in ArcMap 10.2 software by visual on-screen digitizing of LandSat-5 and LandSat-8 imagery obtained for 1986, 1997, 2011 and 2016. These images have a spatial resolution of 30 m and a spectral composition of three bands. We chose the on-screen digitizing due to the unsatisfactory results obtained by the supervised classification, especially due to the similar spectral signature of agriculture and herbaceous vegetation in the study area. We also used topographic maps from the Brazilian Ministry of Defense to identify present road networks. The interpretation key for the land cover was established by visual image interpretation using the criteria of tone, texture, and context (Moreira, 2011), on a scale of 1:50,000, and by field visits in different years.
The D2N method combines two indicators, the Degree of Naturalness (Nd), that uses a hemeroby scale to classify the land use and cover information, and the Distance to Natural Habitat (Dn), which considers, for each pixel, the
Euclidean distance to the next habitat patch within the data set classified as one of the two most natural hemeroby levels: "natural" or "near natural" (Rüdisser et al., 2012). Rudisser et al. (2012) uses a cutoff value for Dnin order to account for the nonlinear decrease related to the influence of nearby natural habitats. We represent this limit by Dmax,as shown in (Eq. (1)). More details about the Dnand Ndcalculations can be found in Rudisser et al. (2012).
(1)
To complement the D2N methodology, we studied the temporal change by calculating the spatial D2N dynamics, between 1986 and 2016, by subtracting the D2N values (raster file) between years (Eq. (2)), using a map algebra tool in ArcMap 10.2 software (André, et al., in press).
(2) 2.2.1. HEMEROBY RECLASSIFICATION
We performed modifications in the hemeroby scale proposed by Rüdisser et al. (2012), to introduce particular characteristics of the study area. These alterations were based on the description of the original paper (Rüdisser, 2012), field research, and the data source scale.
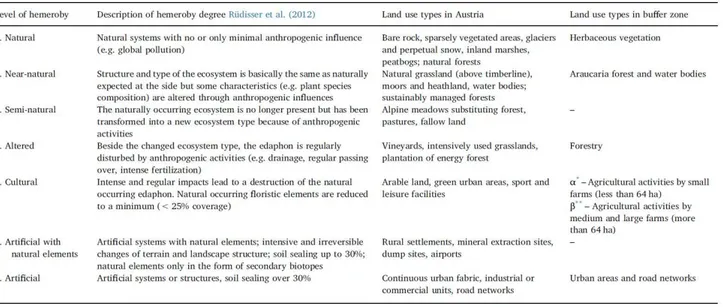
The different levels of hemeroby identified in the study area are given in Table 1. Land uses and covers associated with level 3 (semi-natural) were not identified and the scale analysis did not allow to situate rural settlements corresponding to level 6 (artificial with natural elements).
We classified the "cultural" level in two different levels of hemeroby regarding the local agricultural system: small (5 α) and medium/large farms (5 β). To differentiate these two, we used the Brazilian fiscal modulus, which is the minimum area required for smallholder farmers to be considered economically viable (Brasil, 1979). Following this concept, landholdings of less than four fiscal modules (64 ha in this region) are officially considered small farms (Brasil, 1993). Despite the fact that current agricultural systems remain strongly dependent on synthetic inputs that threaten the environment, we observed in our field research that family farmers in this region show a differentiated agrarian structure, i.e. with a higher crop diversity. Okuyama et al. (2012) observed that smallholder farming in this area shows significantly larger natural remnants than the minimum required by Brazilian environmental law. Gurr et al. (2016), in a multi-country study in Asia, showed that a simple diversification approach can contribute to an ecological intensification of agricultural systems by reducing insecticide applications, while increasing grain yields and delivering economic advantages.
Table 1. Hemeroby scale, descriptions of thresholds regarding its influence on biodiversity and comparative land use types in Austria (Rüdisser et al., 2012) and in the Irati National Forest (Brazil) buffer zone. *The Semi-natural (Degree 3) and Artificial with natural elements (Degree 6) were not observed in this study.
* For calculation, we set the degree 5 αto the integer number 5.
** Once the degree 6 was not identified in our study, we set the 5 β to the integer number 6 for calculation purposes.
2.3. STATISTICAL ANALYSIS
We used a permutational multivariate analysis of variance (PERM-ANOVA) (Anderson, 2001, 2005) with Euclidian distance to test the null hypothesis of D2N, i.e., that there is no significant difference between 1986, 1997, 2011 and 2016. A pair-wise posteriori comparison was performed on a subsample of 1000 points, randomly sampled from each period (1986, 1997, 2011 and 2016) without overlap, for a total of 4000 sampling points, to check the differences in D2N between the years.
3. Results and discussion
3.1. LAND USE DYNAMICS
The Irati National Forest and its buffer zone exhibit a natural condition characterized by the presence of Araucaria forest, herbaceous vegetation and water bodies. These land use types are included in the first (Natural) and second (Near natural) degree of hemeroby (Table 1), showing variation during the years: 1986 (55.1%), 1997 (48.1%), 2011 (52.8%) and 2016 (47.5%). These spatial patterns with a high natural condition are related to the extraction of non-timber products by most of the farmers and by the Faxinais.
The most frequent anthropogenic influences on naturalness were the altered (level 4) and the cultural degree (level 5) of hemeroby, with 42.1% (1986), 48.4% (1997), 43.7% (2011) and 48.6% (2016), which include forestry and agricultural areas. The artificial level (7) of hemeroby, represented by urban areas and road networks, increased in the time period considered: 2.9% (1986), 3.5% (1997 and 2011), and 3.9% (2016) (Table 1).
3.2. D
2N APPLICATION
The application of the D2N methodology resulted in a map for each one of the studied years (Fig. 1, panels a, b, c and d). We reclassified the continuous original scale (from 0 to 1) in a six-category scheme, in order to visually clarify the details of this metric. Regarding the Eastern region of the study, we can observe a continuous rise of anthropogenic effects over the entire period (Fig. 2). The western region shows an oscillating D2N variation over the 30-year period, starting with a more natural global condition in 1986 and passing through the worst condition in 1997 (Fig. 2). Indeed, the PERMANOVA test applied to the D2N results revealed statistically significant differences between 1997 and all other years (level of significance of 0.05): 1986/1997 (F = 23.16; p = 0.001),
1997/2011 (F = 13.04; p = 0.001) and 1997/2016 (F = 9.75 ; p = 0.002). For the other pair of years there was no statistically significant difference: 1986/2011 (F = 1.51; p = 0.217), 1986/2016 (F = 3.05; p = 0.082) and 2011/2016 (F = 0.261; p = 0.600).
Using the landscape classification scheme suggested by Rüdisser et al. (2012), the D2N values were grouped into three categories (Fig. le): (1) natural or near-natural landscapes (values from 0 to 0.06); (2) cultivated landscapes ranging from a few to a substantial amount of natural elements (values from 0.06 to 0.35); and (3) intensively cultivated or urbanized landscapes (values ranging from 0.35 to 1.0). From the Fig. 1(e) and Fig. 2, we can observe, as well as from the statistical analyses, that the year of 1997 differed from the other years, showing a lower percentage of natural landscapes and a higher percentage of intensively cultivated or urbanized landscapes. We highlight that, although 2016 presented higher D2N values than 1986 and 2011 (Fig. 1), it did not differ statistically from these years. This result of 2016 is mainly due to the concentration of areas in the second class (D2N between 0.06 and 0.35), where predominate by cultivated landscapes characterized by a few to a substantial amount of natural elements (at least 50%).
Fig. 2. Classified D2N values for the 30-year time interval, for (a) the Western Buffer Region and (b) the Eastern Buffer Region.
3.3. TEMPORAL D
2N CHANGE ANALYSIS
A quantitative spatio-temporal analysis of the D2N dynamics was developed between 1986 and 2016 to find where the main index changes occurred during the 30-years period. Half of the buffer zone (50.7%) stayed unchanged in that time interval (white areas in Fig. 3). The areas that changed to more natural conditions, predominantly located in the Western region, occupied 21.5% of the buffer zone (green in Fig. 3). This region is occupied predominantly by small farms, mainly related to family farm systems. Changes to more artificial areas represented 27.8% of the buffer zone, predominantly located in Eastern region (red in Fig. 3), a region characterized by relatively large farms. These observations from the Eastern region are coherent to studies from DeFries et al. (2005) in buffer zones of large protected areas of moist and dry tropical forests, where they show that anthropic uses were intensified after 1980.
The Eastern region showed an increase in the D2N values, between 1986 and 2016, evidencing an intensive conversion of natural to more artificial and cultural landscapes (Figs. 2 and 3). The intensive agricultural system has influenced this process, with high levels of external/ synthetic inputs (fertilizers, pesticides, and others). The Western region presents a different trajectory: it showed initially a D2N increase towards intensively cultivated or urbanized landscapes (high D2N values) in 1997, but its values decreased in 2011 when the D2N changed to intermediate and lower values (Figs. 1-3). Lira et al. (2012) observed a similar recovering process in Atlantic forest landscapes in Brazil. In 2016, D2N values raised again in almost all parts of the study area (Figs. 1-3). Public policies from the last decades may have contributed to these spatial patterns of land use, firstly with incentives to agricultural intensification, and afterwards with conservation guidelines, especially related to soil and water protection (Almeida, 2017). More recently, Brazilian environmental law has undergone significant changes with regard to its Forest Code (Brasil, 2012). Soares-Filho et al. (2014) summarize the possible detrimental consequences of these changes. The resulting D2N values in 2016 may just reflect the beginning of these threatening changes. Other researchers observed similar results arising from the changes in the Brazilian Forest Code (Brancalion et al., 2016; Oliveira et al., 2017).
shown in the magnified image in panel (c) of the Fig. 3. This color scale enables us to see spots corresponding to tiny variations towards the natural condition shown in light green color (by land use changes or by the increase of a natural patch near this spot, or both). Also, we can observe areas that underwent changes towards artificial conditions, shown in red. This approach enables consequently to identify regions under possible threat and under a starting restoration processes.
The D2N was effective in identifying areas with greater anthropogenic influence on biodiversity and naturalness. The design was comprehensible, facilitating its application and interpretation. The temporal change analysis assessed by D2N allows to identify regions under continuous conversion of the natural areas towards more artificial landscapes. We emphasize that, for a correct use, D2N application requires, as basic premise, a good field knowledge, especially of the abiotic, biotic and biocultural characteristics of the study area. André, et al. (in press) underlines the same requirements in their application of the D2N methodology studying the landscape ecological consequences of the (sub) urbanization process in the African city of Lubumbashi (Democratic Republic of the Congo).
4. Conclusion
The classification based on the hemeroby scale contributed to focus the analysis and to have a better understanding of landscape dynamics, their causes and their consequences. The adaptation of the hemeroby levels was important in order to apply the D2N concept in our study area. The statistical analyses showed significant differences in the D2N values between 1997 and the other years. The pairwise comparisons (2011, 1986-2016, 2011-2016) did not allow to detect significant differences. The temporal D2N change analysis being spatially explicit, it is possible to locate the zones of increase and decrease with regard to landscape naturalness. The results demonstrate that the D2N concept could be an effective tool to identify anthropogenic influences on biodiversity and therefore to guide the proposition of scenarios for biodiversity conservation.
Fig.3. (a) Temporal change map between 1986 and 2016 for the Distance to Nature index values in the Irati National Forest buffer zone (Brazil); (b) Comparison of D2N values four different strata in the study area; (c) Magnification showing the gradation of the D2N difference values.
Acknowledgements
The authors thank the Brazilian agencies CAPES, CNPq and the Science Without Borders program (CsF) for their the financial support. The authors thank the reviewers for the important remarks.
References
Almeida, D., 2017. Cenários para a biodiversidade de remanescentes florestais do entorno da Floresta Nacional de Irati. Unpublished doctoral thesis. Universidade Federal de Sao Carlos, Sao Carlos, Brazil.
Anderson, M.J., 2001. A new method for non-parametric multivariate analysis of variance. Austral Ecol. 26, 32-46. http://dx.doi.Org/10.1046/j.1442-9993.2001. 01070.x.
Anderson, M.J., 2005. Permanova: A Fortran Computer Program for Permutational Multivariate Analysis of Variance. Department of Statistics, University of Auckland, Auckland, pp. 24.
André M. et al., in press. Quantification of anthropogenic effects in the landscape of Lubumbashi. In: Bogaert, J., Colinet, G., Mahy, G. (Eds.), Anthropisation Des Paysages Katangais. Presses agronomiques de Gembloux, Gembloux, Belgique. http://hdl.handle.net/2268/186226.
Andrew, H., Defries, R., 2007. Ecological mechanisms linking protected areas to surrounding lands. Ecol. Appl. 17 (4), 974-988. http://dx.doi.org/10.1890/05-1098.
Bogaert, J. et al., 2011. A methodological framework to quantify anthropogenic effects on landscape patterns. In: Hong, S.-K. et al. (eds.), Landscape Ecology in Asian Cultures, Ecological Research Monographs,
http://dx.doi.org/10.1007/978-4-431-87799-8_11.
Bogaert, J., et al., 2014. Anthropogenic effects in landscape: historical context and spatial pattern. In: Biocultural Landscapes. Elsevier, pp. 218.
Brancalion, P.H.S., et al., 2016. A critical analysis of the Native Vegetation Protection Law of Brazil (2012): updates and ongoing initiatives. Natureza & Conservaçao 14, 1-15. http://dx.doi.org/10.1016/j.ncon.2016.03.003.
Brasil, 1979. Lei n° 6.746, de 10 de dezembro de 1979: altera o disposto nos arts. 49 e 50 da Lei 4.504, de 30/11/1964 e dá outras providências (estatuto da terra). Diârio Oficial da República Federativa do Brasil de, pp. 18673.
Brasil, 1993. Brazilian Federal Law n° 8.629, February 25th, 1993. 'Dispõe sobre a regulamentação dos dispositivos constitucionais relativos à reforma agrária'. <
http://www.planalto.gov.br/ccivil_03/leis/L8629.htm >
Brasil, 2000. Lei n° 9985, de 2000. Institui o Sistema Nacional de Unidades de Conservaçao da Natureza e dá outras providências. Diário Oficial da República Federativa do Brasil, Brasília de, pp. 1.
Brasil, 2012. Brazilian Federal Law n° 12.651, May 25th, 2012. Forest Code. 'Dispõe sobre a proteção da vegetação nativa' http://www.planalto.gov.br/ccivil_03/_ato2011-2014/2012/lei/112651.htm
Caviglione, J.H., Kiihl, L.R.B., Caramori, P.H., Oliveira, D., 2000. Cartas climáticas do Paraná. IAPAR, CD, Londrina. Davis, C.R., Hansen, A.J., 2011. Trajectories in land use change around U.S. National Parks and challenges and opportunities for management. Ecol. Appl. 21, 3299-3316. http://dx.doi.org/10.1890/10-2404.l.
Defries, R., et al., 2005. Increasing isolation of protected areas in tropical forests over the last twenty years. Ecol. Appl. 15, 19-26. http://dx.doi.org/10.1890/03-5258.
Gray, CL., et al., 2016. Local biodiversity is higher inside than outside terrestrial protected areas worldwide. Nat. Commun. 7. http://dx.doi.org/10.1038/ncommsl2306.
Gurr, G.M., et al., 2016. Multi-country evidence that crop diversification promotes ecological intensification of agriculture. Nat. Plants, http://dx.doi.org/10.1038/NPLANTS.2016.14.
Hong, S.K., 2014. Philosophy and background of biocultural landscapes. In: Biocultural Landscapes. Elsevier, pp. 218.
Lira, P.K., et al., 2012. Land-use and land-cover change in Atlantic forest landscapes. For. Ecol. Manage. 278, 80-89. Maack, R., 2002. Geografia física do Estado do Paraná, 3rd ed. Imprensa Oficial, Curitiba, pp. 440.
Mairota, P., et al., 2012. Using landscape structure to develop quantitative baselines for protected area monitoring. Ecol. Indic. 33, 82-95. http://dx.doi.Org/10.1016/j.ecolind.2012.08.017.
Mazza, C.A.S., et al., 2016. Land use and environmental zoning of mixed ombrophilous forests for sustainable use (Irati National Forest, Brazil Southern Region). Braz. Arch. Biol. Technol. 59, 1-11.
http://dx.doi.org/10.1590/1678-4324-2016160058.
Moreira, M.A., 2011. Fundamentos do Sensoriamento Remoto e Metodologias de Aplicação, 4th ed. UFV, Brasil, pp. 422.
Okuyama, K.K., et al., 2012. Adequação de propriedades rurais ao Côdigo Florestal Brasileiro: estudo de caso no estado do Paraná. Revista Brasileira de Engenharia Agrïcola e Ambiental 16 (9), 1015-1021.
http://dx.doi.org/10.1590/S1415-43662012000900013.
Oliveira, S.N., et al., 2017. Deforestation analysis in protected areas and scenario simulation for structural corridors in the agricultural frontier of Western Bahia, Brazil. Land Use Policy 61, 40-52.
http://dx.doi.Org/10.1016/j.landusepol.2016.10.046.
Perelló, L.F.C., et al., 2012. Ecological, legal, and methodological principles for planning buffer zones. Natureza & Conservaçao 10 (1), 3-11.
Rüdisser, J., et al., 2012. Distance to nature - a new biodiversity relevant environmental indicator set at the landscape level. Ecol. Indic. 15, 208-216. http://dx.doi.org/10.1016/j.ecolind.2011.09.027.
Scherl, et al., 2006. As areas protegidas podem contribuir para a redução da pobreza? Oportunidades e limitações. IUCN, Gland, Switzerland and Cambridge, UK, pp. 60 https://portals.iucn.org/library/efiles/documents/2004-047-Pt.pdf.
Soares-filho, B., et al., 2014. Cracking Brazil's forest code. Science 344 (6182), 363-364 DOI: 10.1126/science.l246663.
Wallace, G.N., et al., 2005. Planejamento da ocupação do solo e regulamentação para o entorno de unidades de conservaçao: Um estudo de marcos legais, melhores prâticas e necessidades de capacitação no México e na América Central. Natureza & Conservaçao 3, 64-142.
Yu, CM., 1988. Sistema Faxinal: uma forma de organização camponesa em desagregação no centro-sul do Paraná. Bol. Tec. IAPAR, Londrina, pp. 123.