REVIEW
Systematic literature review of the economic
burden of spinal muscular atrophy
and economic evaluations of treatments
Tamara Dangouloff
1, Camille Botty
1, Charlotte Beaudart
2, Laurent Servais
1,3,4and Mickaël Hiligsmann
2*Abstract
Background: Spinal muscular atrophy (SMA) is a rare and devastating condition for which new disease-modifying treatments have recently been approved. Given the increasing importance of economic considerations in healthcare decision-making, this review summarizes the studies assessing the cost of SMA and economic evaluations of treat-ments. A systematic review of the literature in PubMed and Scopus up to 15 September 2020 was conducted accord-ing to PRISMA guidelines.
Results: Nine studies reporting the annual cost of care of patients with SMA and six evaluations of the cost-effec-tiveness of SMA treatments were identified. The average annual cost of SMA1, the most frequent and severe form in which symptoms appear before the age of 6 months were similar according to the different studies, ranged from $75,047 to $196,429 per year. The yearly costs for the forms of the later-onset form, called SMA2, SMA3, and SMA4, which were usually pooled in estimates of healthcare costs, were more variable, ranging from $27,157 to $82,474. The evaluations of cost-effectiveness of treatment compared nusinersen treatment against standard of care (n = 3), two treatments (nusinersen and onasemnogene abeparvovec) against each other and no drug treatment (n = 1), nusin-ersen versus onasemnogene abeparvovec (n = 1), and standard of care versus nusinnusin-ersen with and without newborn screening (n = 1). The incremental cost-effectiveness ratio (ICER) of nusinersen compared to standard of care in SMA1 ranged from $210,095 to $1,150,455 per quality-adjusted life years (QALY) gained and that for onasemnogene abeparvovec ranged from $32,464 to $251,403. For pre-symptomatic patients, the ICER value ranged from $206,409 to $735,519. The ICERs for later-onset forms of SMA (2, 3 and 4) were more diverse ranging from $275,943 to $8,438,049. Conclusion: This review confirms the substantial cost burden of standard of care for SMA patients and the high cost-effectiveness ratios of the approved drugs at the current price when delivered in post-symptomatic patients. Since few studies have been conducted so far, there is a need for further prospective and independent economic studies in pre- and post-symptomatic patients.
Keywords: Burden, Cost, Cost-effectiveness, Economic, ICER, Nusinersen, Spinal muscular atrophy, Onasemnogene abeparvovec
© The Author(s) 2021. Open Access This article is licensed under a Creative Commons Attribution 4.0 International License, which permits use, sharing, adaptation, distribution and reproduction in any medium or format, as long as you give appropriate credit to the original author(s) and the source, provide a link to the Creative Commons licence, and indicate if changes were made. The images or other third party material in this article are included in the article’s Creative Commons licence, unless indicated otherwise in a credit line to the material. If material is not included in the article’s Creative Commons licence and your intended use is not permitted by statutory regulation or exceeds the permitted use, you will need to obtain permission directly from the copyright holder. To view a copy of this licence, visit http://creat iveco mmons .org/licen ses/by/4.0/. The Creative Commons Public Domain Dedication waiver (http://creat iveco
mmons .org/publi cdoma in/zero/1.0/) applies to the data made available in this article, unless otherwise stated in a credit line to the data.
Background
Spinal muscular atrophy (SMA) is the most common genetic cause of death in children, with an incidence of approximately 1 in 12,000 live births and a prevalence of approximately 1–2 per 100,000 persons [1]. Patients present with loss of muscle strength followed by onset of progressive paralysis including in the respiratory
Open Access
*Correspondence: m.hiligsmann@maastrichtuniversity.nl
2 Department of Health Services Research, CAPHRI Care and Public Health Research Institute, Maastricht University, P.O. Box 616, Maastricht 6200 MD, The Netherlands
muscles. Clinical phenotypes are grouped into four forms according to disease severity and age of onset. The most severe form, called type I or "Werdnig-Hoffman dis-ease" (SMA1), manifests during the first 6 months of life. Without respiratory assistance, children with SMA1 usu-ally die during the first 2 years of life [2]. Onset of type II or "intermediate" SMA (SMA2) occurs between the ages of 6 and 18 months. Type 2 can be divided into 2a (patients who sit independently) and 2b (patients who have acquired the standing position but cannot walk). Of patients with SMA type 2a 81% and 67.7% survive without permanent ventilation at ages 30 and 50 years, respectively. Survival without permanent ventilation of patients with SMA type 2b is normal at least within the first 60 years of life [3]. The first symptoms of type III or Kugelberg–Welander disease (SMA3) appear after the age of 18 months. The life expectancy of SMA3 patients is not different from that of the general population [3]. Patients with type IV SMA (SMA4) develop symptoms during the second or third decade of life; patients with this form, also known as "adult form" retain the ability to walk. SMA has severe consequences for patients in terms of mobility and quality of life for patients with all forms [4] and in terms of life expectancy for the most severe and most common forms. SMA is a major cause of dis-ability in children and adults [2, 5] and leads to a substan-tial economic burden.
An increasing number of studies have investigated the economic impact of SMA in terms of quality of life and cost. One recent study [6] systematically reviewed quality of life studies in SMA and concluded that despite hetero-geneous results, quality of life is substantially impaired in SMA, mainly due to poor physical health. To the best of our knowledge, no study has yet systematically reviewed the studies assessing the cost of SMA. Given the increas-ing importance of economic considerations in pricincreas-ing and reimbursement decisions, it is important to provide an overview of the overall costs and economic conse-quences of the SMA.
Recently, three disease-modifying drugs have reached patients’ bedsides [7]: The first to be approved by both the FDA in December 2016 and the EMA in June 2017
was nusinersen [8], marketed as Spinraza by Biogen
(Cambridge, MA, USA). Onasemnogene abeparvovec [9, 10], marketed as Zolgensma by Novartis (Basel, Swit-zerland), was approved by the FDA in May 2019 and the EMA in August 2020. The third entry is risdiplam, an oral compound marketed as Evrisdy, developed by F. Hoff-mann-La Roche (Basel, Switzerland), PTC Therapeutics (South Plainfield, NJ, USA), and the SMA Foundation, approved by the FDA in August 2020 [11]; the application to the EMA is pending as of October 2020. Each of these treatments has better efficacy when delivered early [12],
which has prompted pre-symptomatic trials [13] and
newborn screening programs [14, 15]. Economic com-parisons of the costs and the outcomes of these options are necessary as policy makers and payers seek to deter-mine their economic values. Economic evaluations also drive reimbursement and pricing decisions. In this study, we systematically review the economic burden of SMA (in terms of costs) and provide an overview and critical appraisal of economic evaluations in SMA.
Methods Literature search
Two literature searches were conducted using Medline (PubMed) and Scopus (Elsevier) following the PRISMA checklist [16]: one for cost studies of SMA and the sec-ond for economic evaluations in the field of SMA. We searched for original, full-text articles reporting costs or economic evaluations of SMA published after Janu-ary 1, 1998. To identify relevant articles, Medical Sub-ject Headings (Mesh terms) (indexed on Pubmed) and key terms regarding SMA (i.e., “spinal muscular atrophy” OR “Werdnig-Hoffmann” OR “Kugelberg-Welander”) were combined with key terms for costs and economic evaluation. The details of the search strategy are shown schematically in Additional files 1 and 2. In the search for cost studies, the following terms were used: "cost of ill-ness", "price", "pricing", "cost", "costing", "costly", costed", "or healthcare cost". In the search for economic evalua-tion studies, the following terms were used: “economic”, “health economic”, “cost-effectiveness”, “cost effective”, “healthcare cost”, “health-allocation”, “health-utilization”, “cost-utility”, “cost–benefit analysis”, “cost analysis”, or “economic impact”. Identified articles were manually searched to identify additional articles of relevance. The literature search was last updated on September 15, 2020. Selection of studies
Two researchers (TD, CB) first screened titles and abstracts independently for eligibility and then evaluated the full text. To be included, the articles had to be pub-lished original research, in English or French, and had to report on cost or economic evaluation in SMA. Eco-nomic evaluations were included if they compared both costs and outcomes (e.g., in quality-adjusted life years (QALYs)) between two or more interventions. Articles where SMA was not specifically studied (some articles cover neuromuscular diseases broadly without specific analysis of SMA) and articles where the cost of only a single specific dimension (e.g., ventilation) was reported were excluded. The two reviewers compared their find-ings, and a list of studies for full-text screening was cre-ated. The reasons for article exclusion were recorded, and potential disagreements were specified to be resolved by
consensus or, if necessary, with the involvement of a third investigator (MH).
To assess the quality of the economic evaluation, the Consensus on Health Economics Checklist-extended
(CHEC-extended) was used [17]. This checklist is an
extension of the original CHEC checklist that includes questions about model-based economic evaluations [18,
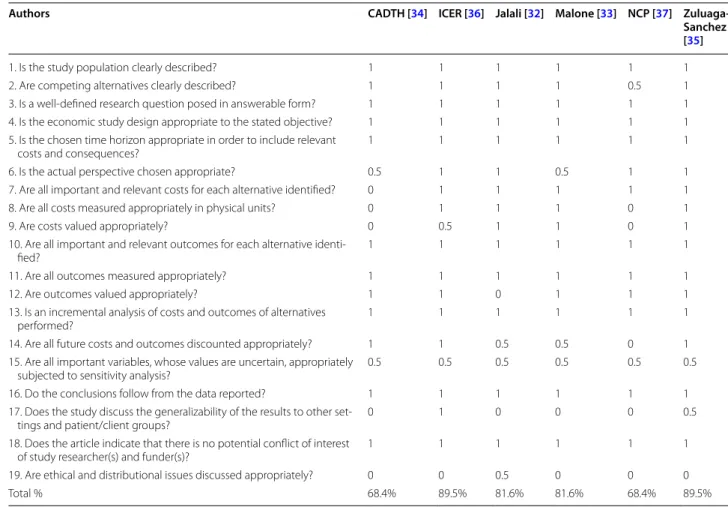
19]. To limit the possibility of biased results, two review-ers (ChB and TD) independently reviewed the quality appraisal of the included studies. Possible differences in scoring were discussed until consensus was reached. To calculate an overall quality score for each article based on the CHEC-extended checklist, each time a “Yes” was scored, 1 point was allocated, and each time “suboptimal” was scored, 0.5 points were allocated.
Data extraction and presentation
Studies were thus classified as reporting costs or eco-nomic evaluation. Study characteristics related to pub-lication (authors, year of pubpub-lication, journal name) and study design (country, sample size, population age and gender) were first extracted. For cost studies, we further extracted type of costs, year of costing, time horizon, estimation method, and primary and secondary results. For economic evaluations we extracted type of economic evaluation, perspective, year of costing, time horizon, intervention, comparator, method (trial-based or model-based), outcomes used, results base case, results sen-sitivity analyses, and funding source. The incremental cost-effectiveness ratio (ICER) is defined as the difference between an alternative and the comparator in terms of costs, divided by their differences in outcomes. The ICER representing the additional cost per QALY gained due to the intervention is then compared to a cost-effectiveness threshold representing the willingness of the decision-maker to pay.
Costs and ICERs were converted to 2020 US dollars to facilitate comparison (data from the Bureau of Labor Statistics’ consumer Price index obtained in October 2020 was used) [20, 21]. For non-US dollars costs, we first translated cost into US dollars of the same year using the exchange rates in the Organisation for Economic Co-operation and Development database [22] and then converted amounts into 2020 US dollars. Cost data are presented by SMA types. SMA1 is typically defined as a SMA that starts before 6 months of age in infants who do not spontaneously acquire independent sitting position. Three articles [23–25] included in our analysis do not use the current classification and consider only two groups: “early onset” (patients who develop symptoms during the first year of life) and "other" (patients who develop symp-toms after 1 year of age). We grouped the "early onset"
SMA with SMA1. In doing so, some SMA2 patients were categorized as SMA1.
Results
Study selection process
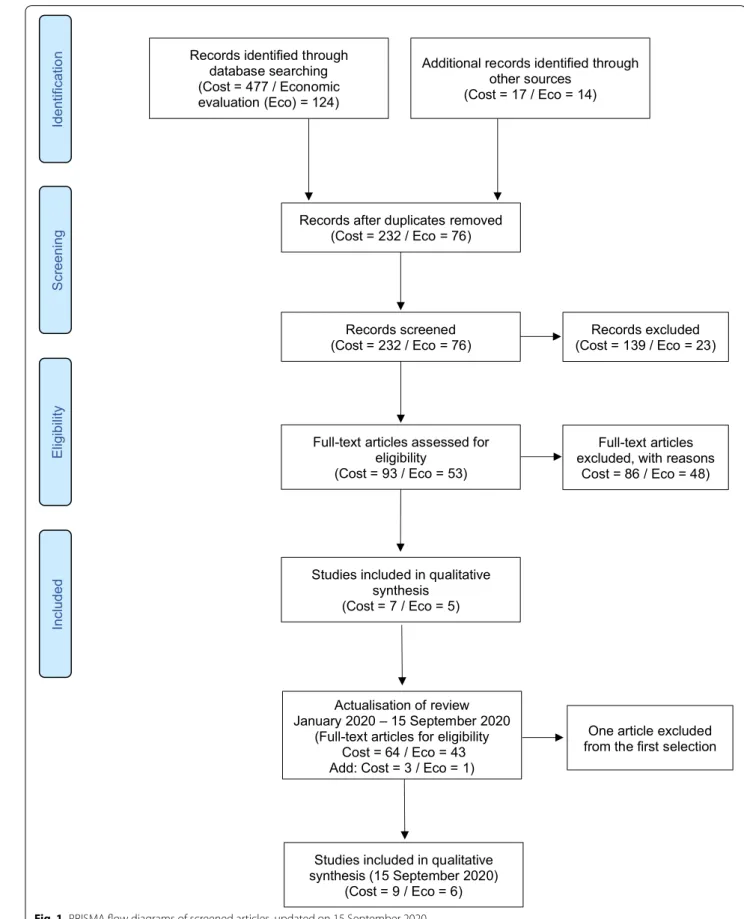
The initial searches (conducted in December 2019) identified 447 articles that describe cost studies of SMA and 124 economic evaluations of SMA. After removing 232 and 62 duplicates, respectively, and screening by title and abstract, 93 and 76 articles, respectively, were identified for full-text screening. A second search con-ducted in September 2020 identified 64 references to be screened for costs and 43 for economic evaluation for full-text screening. Of these, nine articles describing the cost of SMA and six describing economic evaluation were included. Figure 1 shows the flow chart based on Preferred Reporting Items for Systematic Reviews and
Meta‐Analyses (PRISMA) guidelines [16] used for the
identification of these studies. Costing studies
Nine cost studies were identified. One study provided cost perception through interviews with seven families [26]. It was excluded because no monetary values were provided. The characteristics of included studies for the cost of SMA are reported in Table 1.
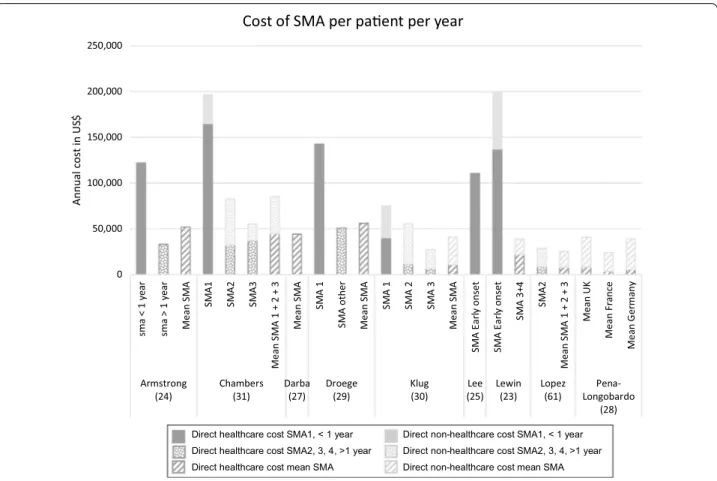
Some studies presented only direct healthcare costs, and others also included direct non-medical costs of the disease (vehicle and home modification, for example). A few studies also estimated indirect costs. Indirect costs were collected through questionnaires submitted to fam-ilies and captured informal care provided by parents and loss of income of the primary caregiver due to absentee-ism from work [35]. Two studies presented costs for all types of SMA together [27, 28]. For the remaining seven articles, costs were classified by type of SMA. With the exception of one study [29] that compared the costs with and without therapy, the other studies reported costs of the disease and are not based on a potential treatment or a comparison of treatment costs. The average annual costs of SMA1 (including early onset and SMA before one year) for the six studies for which these costs were determined, ranged from $75,047 to $196,429 per year [23–25, 29–31]. The costs for the other groups were also variable, ranging from $27,157 [30] to $82,474 [31]. Fig-ure 2 presents the costs by type of SMA.
One study [29] estimated the costs of patients treated with nusinersen compared to those not treated. Total cost per year of a patient with SMA1 decreased signifi-cantly from $142,386 without treatment to $95,820 with nusinersen treatment when excluding drug cost. The cost of nusinersen included in these studies varied from $516,896 [35] to $907,665 [29] in the first year, and from
Scr eening Included Elig ibilit y Identificati on Records screened (Cost = 232 / Eco = 76)
Full-text articles assessed for eligibility
(Cost = 93 / Eco = 53)
Studies included in qualitative synthesis
(Cost = 7 / Eco = 5)
Additional records identified through other sources
(Cost = 17 / Eco = 14) Records identified through
database searching (Cost = 477 / Economic evaluation (Eco) = 124)
Records after duplicates removed (Cost = 232 / Eco = 76)
Records excluded (Cost = 139 / Eco = 23)
Full-text articles excluded, with reasons
Cost = 86 / Eco = 48)
Actualisation of review January 2020 – 15 September 2020
(Full-text articles for eligibility Cost = 64 / Eco = 43 Add: Cost = 3 / Eco = 1)
Studies included in qualitative synthesis (15 September 2020)
(Cost = 9 / Eco = 6)
One article excluded from the first selection
$ 258,448 [35] to $457,889 [29] in the second year. For SMA2, 3, and 4 patients, the costs excluding drug costs increased from $50,875 to $79,012 without treatment compared to with treatment. This suggests that nusin-ersen lowered health care costs, but this should be inter-preted with caution as drug costs were not included in the analysis. Comparing total health care costs includ-ing drug costs is necessary to provide a fair comparison
between active drugs (such as nusinersen and onasemno-gene abeparvovec) and standard of care.
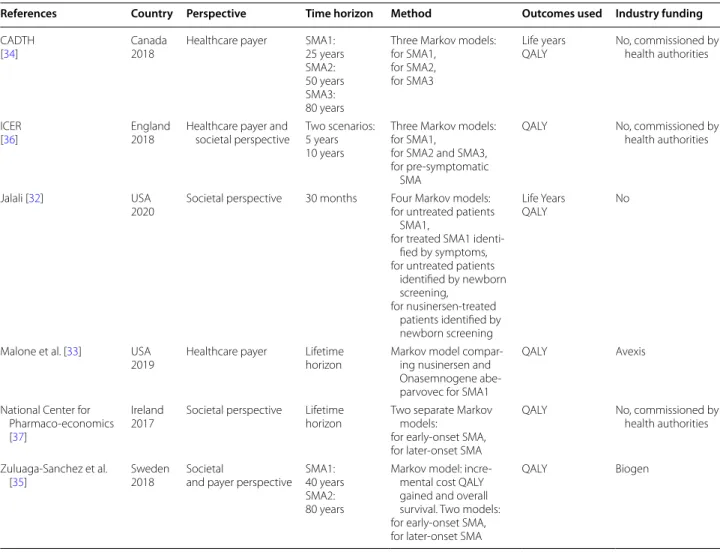
Economic evaluations
Six economic evaluations were identified. The character-istics of included studies are reported in Table 2. Given the heterogeneity between studies, a narrative analysis was conducted.
Table 1 Overview of literature on cost of SMA
References Country
Year Sample size Population age Type of study Perspective Type of cost Year of costing Funding Armstrong
et al. [24] USA2016 239: 45 < 1 year 194 > 1 year 7.5+/− 6.4 Cross-sectional, retrospec-tive, and prospective Healthcare
costs Direct health-care 2003–2012 Conducted by Biogen
Chambers
et al. [31] Australia2020 40: 4 SMA1 26 SMA2 10 SMA3 SMA1: 2.7 (1–5) SMA2: 9.8 (2–22) SMA3: 6.9 (1–12) Cross-sec-tional retrospective
Societal costs Direct health-care Direct non-healthcare Indirect 2016–2017 Funded by the Motor Neurone Diseases Research institute of Australia Beryl Bayley Darba et al.
[27] Spain2020 396 SMA1, 2 3 and 4 Cross-sec-tional retrospective
Healthcare
costs Direct health-care 2014–2016 No Droege et al. [29] USA2019 6526: 349 SMA1 45 SMA1 treated with nusinersen 5728 SMA2, 3, 4 404 SMA2, 3, 4 treated with nusinersen SMA1: 9.2 months SMA1 nusinersen: 12.2 months SMA others: 30.9 years SMA others nusinersen: 14.8 years Retrospective Healthcare
costs Direct health-care 09/2016–08/2018 Conducted by Avexis
Klug et al. (30) Germany
2016 189: 12 SMA1 73 SMA2 104 SMA3 < 1 to 73 Cross-sec-tional retrospective Healthcare and
societal costs Direct health-care Direct non-healthcare Indirect 2013 Grant of the Friedrich-Baur-GmbH m’ Lee et al. (25) USA
2019 229 severe SMA (< 1 year) Cross-sec-tional retrospective Healthcare
costs Direct health-care 2005–2013 No Lewin Group
(23) USA2012 745: 14 early onset SMA 731 SMA other (3–4) < 1 to 65 Cross-sec-tional retrospective Healthcare and
societal costs Direct health-care Direct non-healthcare Indirect 2008 Conducted by Muscular Dystrophy Association Lopez-Bastida
et al. [61] Spain2017 81: 8 SMA1 60 SMA2 13 SMA3 7.22 Cross-sec-tional retrospective Healthcare and
societal costs Direct health-care Direct non-healthcare 2015 Supported by Biogen Peña-Longo-bardo et al. [28] France, Ger-man, UK 2020 86: 23 SMA1 45 SMA2 18 SMA 3 6.9 Cross-sec-tional prospective
Societal costs Direct health-care Direct
non-healthcare
2015 Supported by Biogen
Clinical results for all of the identified studies used data from the following clinical trials:
– Randomized controlled trials:
o ENDEAR (NCT02193074), which assessed safety and efficacy of nusinersen in SMA1.
p CHERISH (NCT02292537), which assessed safety and efficacy of nusinersen in SMA2. All studies used QALYs as outcome, and health-state values (or utilities) were derived from this trial – Non-randomized uncontrolled trials:
o NURTURE (NCT02386553), that assessed safety and efficacy of nusinersen in pre-symptomatic patients
p START (NCT03421977), which assessed safety and efficacy of onasemnogene abeparvovec in patients with SMA1.
Each of these four trials showed that treatment statis-tically and significantly improved motor milestones and
resulted in sustained and clinically significant improve-ments in event-free survival, overall survival, and motor function for children, although follow-up periods were limited. All economic evaluation studies used QALYs as outcome, and health-state values (or utilities) were derived from the CHERISH trial. All studies used trials Endear for motor evolution with nusinersen and one of them [32] used Nurture. Vignette studies were also used to obtain utility values in the pediatric and later-onset models [33–35]. Characteristics of these studies by popu-lation, intervention, and results are listed in Table 3.
All studies used a decision-analytic model, specifically the Markov model. The models were built on different health states: the motor function milestones achieved, the need for permanent ventilation, and the time to death. For the motor function, the CHOP INTEND or HFMSE scales were used as a reference. The baseline scores were those before the start of treatment. The stud-ies assume that motor function does not improve natu-rally in SMA patients. These scores were then compared to the scores at the ends of the trials. Patients’ ability to sit and walk was also taken into account. The health states used differed slightly in each study. For example,
0 50,000 100,000 150,000 200,000 250,000 sma < 1 year sma > 1 year Mean S MA SM A1 SM A2 SM A3 Mean S MA 1 + 2 + 3 Mean S MA SM A 1 SM A othe r Mean S MA SM A 1 SM A 2 SM A 3 Mean S MA SM A Earl y onse t SM A Earl y on se t SM A 3+ 4 SM A2 Mean S MA 1 + 2 + 3 Mean U K Mean F ra nc e Me an G er ma ny Armstrong
(24) Chambers(31) Darba(27) Droege(29) (30)Klug (25)Lee Lewin(23) Lopez(61) Longobardo Pena-(28)
Annual
cost in US
$
Cost of SMA per paent per year
Direct healthcare cost SMA1, < 1 year Direct non-healthcare cost SMA1, < 1 year Direct healthcare cost SMA2, 3, 4, >1 year Direct non-healthcare cost SMA2, 3, 4, >1 year Direct healthcare cost mean SMA Direct non-healthcare cost mean SMA
two studies follow the same model and used the same health states that were used for the submission of the file for drug reimbursement [34, 35]: capacity to sit without support, to stand with assistance, to walk with assis-tance, to stand unaided, and to walk unaided. Ventilation was also studied with patients categorized as completely autonomous, with need for partial ventilation (during the night), or with permanent ventilation.
Quality of the economic evaluations
Critical appraisal of the quality of the studies was assessed with the CHEC-extended. The results are avail-able in Tavail-able 4. The studies are most often non-qualita-tive, do not generalize the results to another dimension or pathology, and do not approach the question from an ethical point of view. Most approach the sensitivity of the results only in a probabilistic and non-deterministic way. For half of the studies, the sources of cost data were not clearly identified. Apart from these shortcomings, the studies had scores showing high quality.
Results of economic evaluation.
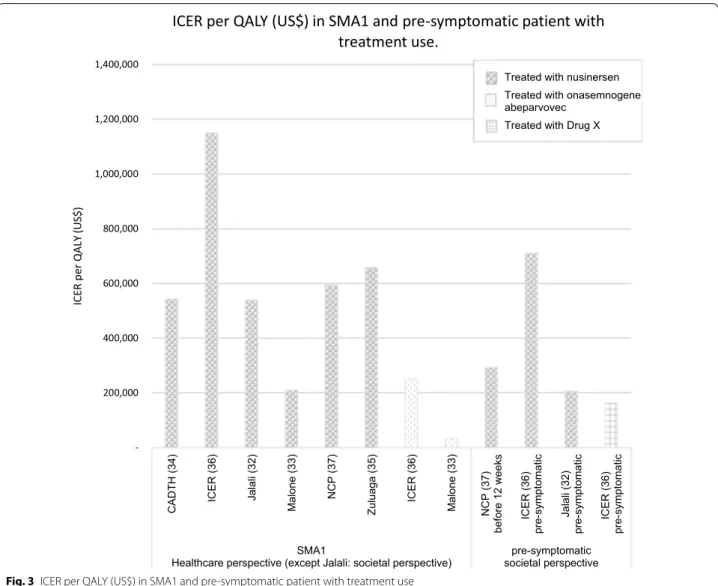
Of the 6 comparisons, five compared a drug treatment to standard of care (no treatment). Only one study com-pares the two treatments, i.e., onasemnogene abepar-vovec compared to nusinersen [33]. In this study, at the price of $5 million the ICER of onasemnogene abeparvo-vec compared to nusinersen was $32,464 per QALY (i.e., the total cost of onasemnogene abeparvovec was greater and effectiveness higher than nusinersen). The ICER per QALY gained upon treatment of SMA1 patients with nusinersen compared to standard of care ranged from $210,095 [33] to $1,150,455 [36]; for treatment with Onasemnogene abeparvovec the range was from $32,464 [33] to $251,403 [36]. The ICER per QALY gained with nusinersen versus standard of care for SMA1 patients treated before the age of 12 weeks or pre-symptomati-cally was $206,409 [32], $293,447 [37] and $710,758 [36]. Figure 3 summarizes the findings from each study.
In the three studies that evaluated ICERs from both societal and healthcare perspectives [35–37], the results Table 2 Overview of economic evaluation studies of SMA
References Country Perspective Time horizon Method Outcomes used Industry funding CADTH
[34] Canada2018 Healthcare payer SMA1:25 years SMA2: 50 years SMA3: 80 years
Three Markov models: for SMA1,
for SMA2, for SMA3
Life years
QALY No, commissioned by health authorities
ICER
[36] England2018 Healthcare payer and societal perspective Two scenarios:5 years 10 years
Three Markov models: for SMA1,
for SMA2 and SMA3, for pre-symptomatic
SMA
QALY No, commissioned by health authorities
Jalali [32] USA
2020 Societal perspective 30 months Four Markov models:for untreated patients SMA1,
for treated SMA1 identi-fied by symptoms, for untreated patients
identified by newborn screening, for nusinersen-treated patients identified by newborn screening Life Years QALY No
Malone et al. [33] USA
2019 Healthcare payer Lifetimehorizon Markov model compar-ing nusinersen and Onasemnogene abe-parvovec for SMA1
QALY Avexis
National Center for Pharmaco-economics [37]
Ireland
2017 Societal perspective Lifetimehorizon Two separate Markov models: for early-onset SMA, for later-onset SMA
QALY No, commissioned by health authorities Zuluaga-Sanchez et al.
[35] Sweden2018 Societaland payer perspective SMA1:40 years SMA2: 80 years
Markov model: incre-mental cost QALY gained and overall survival. Two models: for early-onset SMA, for later-onset SMA
Table 3 O ver vie w of the char ac teristics of the six ec onomic e valua tions b y p opula tion, in ter ven tion, and r esults Ref er enc es Popula tion In ter ven tion/c ompar at
or/(including drug pric
es)
Results (D
rugs c
osts ar
e ne
ver included in the analy
sis) CAD TH [ 34 ] SM A1, 2, 3 Nusinersen v ersus standar d of car e Nusinersen: First y ear : 578,916 US $ Per y ear af ter 289,458 US $ For SM A1: Nusinersen led t o g reat er Q AL Ys (gain of 4.80), lif e y ears (gain of
4.79), and cost (incr
ease of $3.1 million) f or an incr emental cost per Q AL Y gained of $665,570 For SM A2: Nusinersen led t o g reat er Q AL Ys (gain of 3.67), lif e y ears (gain of
2.18), and cost (incr
ease of $7.6 million) f or an incr emental cost per Q AL Y gained of $2.1 million For SM A3: Nusinersen led t o g reat er Q AL Ys (gain of 1.56), no diff er ence in lif e
years (gain of 2.18), and an incr
ease in cost ($4.5 million) f
or an
incr
emental cost per Q
AL Y gained of $2.9 million For all thr ee SM A t ypes: The pr obabilit
y that nusinersen was cost eff
ec tiv e assuming that the thr eshold value f or a Q AL Y was $300,000 was 0% ICER [36 ] SM A1, 2, 3 and pr e-sympt omatic Nusinersen v ersus standar d of car
e and Onasemnogene abepar
-vo vec v ersus standar d of car e Nusinersen: Per y ear af
ter the first:
396,443 US $ Onasemnogene abepar
vo
vec: 2 million US$
ICER of nusinersen is $709,000 per Q
AL Y gained fr om a healthcar e-sec tor perspec tiv e and $687,000 fr
om a modified societal per
-spec
tiv
e, far ex
ceeding usual cost
-eff
ec
tiv
eness thr
esholds
For Onasemnogene abepar
vo
vec (at a placeholder pr
ice of $2
million) the ICER fr
om a healthcar e-sec tor perspec tiv e in patients with sympt omatic SM A1 is $243,000 per Q AL Y gained Jalali [ 32 ] SM A1 and pr e-sympt omatic Standar d of car e compar ed t
o Nusinersen with and without
ne wbor n scr eening Nusinersen: First y ear : 776,000 US $ Per y ear af ter : 388,000 US $ Compar ed with no scr eening and no tr
eatment, the ICER f
or nusin
-ersen with scr
eening was $330 558 per e
vent -fr ee lif e y ear sa ved The ICER f or nusinersen tr eatment without scr eening was $508,481 per e vent -fr ee lif e y ear sa ved
For nusinersen with scr
eening t o be cost -eff ec tiv e at a willing ness-to -pa y ( W TP) thr eshold of $50,000 per e vent -fr ee L Y sa ved , the pr ice w ould need t o be $23,361 per dose
, less than one
-fif th its cur rent pr ice of $125,000 Pr eliminar y data fr om the NUR TURE tr ial indicat ed an 85.7% impr ov ement in expec ted L Ys sa ved compar
ed with our base
results -In pr obabilistic sensitivit y analysis , nusinersen and scr eening was a pr ef er red strat
egy 93% of the time at a $500,000
W TP thr eshold M alone et al . [ 33 ] SM
A1 patients with 2 copies of
SMN2
Onasemnogene abepar
vo
vec was compar
ed t o nusinersen. Nusinersen: First y ear : 776,000 US $ Per y ear af ter : 388,000 US $ Onasemnogene abepar vo vec: bet w
een 2,5 and 5 million of US$
Expec ted sur vival (undiscount ed) o ver a lif etime pr edic ted b y the
model was 37.20 lif
e y ears f or Onasemnogene abepar vo vec and 9.68 lif e y ears f or nusinersen ( discount ed Q AL Ys , 15.65 and 5.29, respec tiv ely) Using a pot
ential Onasemnogene abepar
vo vec pr ice range ($2.5–5.0 M/tr eatment), the a verage lif
etime cost/patient was
$4.2–6.6 M f or Onasemnogene abepar vo vec and $6.3 M f or nusinersen
The ICER range was (-$203,072) t
o $31,379 per Q AL Y gained f or Onasemnogene abepar vo vec v
ersus nusinersen, indicating that
Onasemnogene abepar
vo
vec was cost
-eff ec tiv e when pr iced at ≤ $5 M per tr eatment
Table 3 (c on tinued) Ref er enc es Popula tion In ter ven tion/c ompar at
or/(including drug pric
es)
Results (D
rugs c
osts ar
e ne
ver included in the analy
sis) National C ent er f or Phar maco -econom -ics [ 37 ] SM A1, 2, 3, 4 Nusinersen v ersus standar d of car e First y ear : 681,421 US$ Per y ear af ter : 341,105 US$
Nusinersen cannot be consider
ed cost -eff ec tiv e at cur rent pr ice A t enf old r educ tion in the pr ice of nusinersen f or the tr eatment of infantile SM A is r equir ed t o pr
oduce an ICER appr
oaching the € 45,000/Q AL Y thr eshold For lat er -onset SM
A, nusinersen is less cost
-eff ec tiv e and a 20-f old pr ice r educ tion r
esults in an ICER just under
€ 100,000/Q
AL
Y
The
5-year net budget impac
t f or I reland is estimat ed at €37.88 million Zuluaga-Sanchez et al [ 35 ] SM A1, 2 Nusinersen v ersus standar d of car e First y ear : 516,896 US$ Per y ear af ter : 258,448 US$ For SM A1: Nusinersen r esult ed in 3.86 patient incr emental Q AL Ys Nusinersen r esult ed in 0.02 car eg iv er incr emental Q AL Ys Nusinersen incr
emental cost was $280,000 o
ver standar
d of car
e
ICER f
or nusinersen (including car
eg iv er Q AL Ys) of $544,000 per Q AL Y gained For SM A2: Nusinersen r esult ed in 9.54 patient incr emental Q AL Ys Nusinersen r esult ed in 2.39 car eg iv er incr emental Q AL Ys Nusinersen incr
emental cost of $3.6 million o
ver standar
d of car
e
ICER f
or nusinersen (including car
eg iv er Q AL Ys) of $308,000 per Q AL Y gained
for patients treated pre-symptomatically showed a lower ICER from the societal perspective compared to the healthcare payer perspective: for example, $293,447 versus $564,657 for treatment with nusinersen [37]. A similar finding was reported in patients with later-onset SMA: $1,228,612 versus $2,496,442 [37]. No difference was, however, observed between ICERs as evaluated from a societal or healthcare payer perspective in SMA1 treated by nusinersen: ($670,756 for societal perspective versus $658,578 for healthcare payer) [35].
In one study that evaluated the ICER in
pre-symp-tomatic patients [36], the authors assumed that in
absence of treatment 60% of patients would develop SMA1, 30% would developed SMA2, and 10% SMA3. This distribution is slightly different from that reported in a recent literature review [1] that found 20–30% of subjects would develop SMA2 and 10–20% would develop SMA3. This discrepancy may have affected the results of the original studies. Scenario analyses were also conducted for a hypothetical drug therapy ("drug X") that had the unique costs of Onasemnogene
abeparvovec with QALYs associated with nusinersen in patients with pre-symptomatic SMA. Given the uncer-tainty in the long-term prognosis of the pre-sympto-matic population, scenario analyses for Drug X were performed assuming lower survival. In this study, the cost of the nusinersen treatment was assumed to be $776,000 for the first year and $388,000 per year for the following years [32].
ICER per QALY in SMA1 for the use of nusinersen or Onasemnogene abeparvovec compared to standard of care. Values are shown for all SMA1 patients and for SMA1 treated before 12 weeks, which is usually pre-symptomatically, with nusinersen or drug X. Drug X is hypothetical and has the costs associated with Onasemnogene abeparvovec and efficacy associated
with nusinersen. Figure 4 shows the ICER per QALY
for SMA types with later-onset treated with nusinersen compared to the standard of care from a societal per-spective. The ICERs for these forms of SMA [2, 3 and 4] varied considerably depending on both the study and the type of SMA from $379,011 [35] to $8,438,049 [36]. Table 4 Critical appraisal of the quality of the economic evaluation (CHEC-extended scores)
Authors CADTH [34] ICER [36] Jalali [32] Malone [33] NCP [37] Zuluaga-Sanchez [35]
1. Is the study population clearly described? 1 1 1 1 1 1
2. Are competing alternatives clearly described? 1 1 1 1 0.5 1
3. Is a well-defined research question posed in answerable form? 1 1 1 1 1 1 4. Is the economic study design appropriate to the stated objective? 1 1 1 1 1 1 5. Is the chosen time horizon appropriate in order to include relevant
costs and consequences? 1 1 1 1 1 1
6. Is the actual perspective chosen appropriate? 0.5 1 1 0.5 1 1
7. Are all important and relevant costs for each alternative identified? 0 1 1 1 1 1 8. Are all costs measured appropriately in physical units? 0 1 1 1 0 1
9. Are costs valued appropriately? 0 0.5 1 1 0 1
10. Are all important and relevant outcomes for each alternative
identi-fied? 1 1 1 1 1 1
11. Are all outcomes measured appropriately? 1 1 1 1 1 1
12. Are outcomes valued appropriately? 1 1 0 1 1 1
13. Is an incremental analysis of costs and outcomes of alternatives
performed? 1 1 1 1 1 1
14. Are all future costs and outcomes discounted appropriately? 1 1 0.5 0.5 0 1 15. Are all important variables, whose values are uncertain, appropriately
subjected to sensitivity analysis? 0.5 0.5 0.5 0.5 0.5 0.5
16. Do the conclusions follow from the data reported? 1 1 1 1 1 1
17. Does the study discuss the generalizability of the results to other
set-tings and patient/client groups? 0 1 0 0 0 0.5
18. Does the article indicate that there is no potential conflict of interest
of study researcher(s) and funder(s)? 1 1 1 1 1 1
19. Are ethical and distributional issues discussed appropriately? 0 0 0.5 0 0 0
Discussion
This study systematically reviewed all cost studies (n = 9) and economic evaluations (n = 6) of SMA care and treat-ment up to September 2020. Cost studies quantify the substantial cost of SMA, particularly of SMA1, which has annual costs estimated to range from $75,047 to $196,429 per year, exclusive of drug costs. For other SMA types, a much broader range of costs were observed. The broad range is probably related to the fact that SMA2, SMA3, and SMA4 were considered as a single group, yet their health resource consumptions are very different: Patients with SMA2 are wheelchair ambulant, whereas SMA4 patients remain ambulant. Most SMA2 patients eventu-ally develop restrictive pulmonary syndrome, leading to frequent infections and need of chronic respiratory sup-port; this syndrome is observed much less frequently in SMA3 patients and rarely in SMA4 patients [4]. Another reason for this discrepancy could be the countries in
which these different studies were conducted, and the methodologies used. The two studies that reported the highest costs were conducted in European countries, and the others were conducted in the US. In terms of meth-odology, the two studies that reported the highest costs took indirect cost of illness into account [23, 31].
The yearly cost of SMA1 is significantly higher than those of SMA2 and SMA3. Because life expectancy is shorter in SMA1 [38–40], the total lifetime cost and budgetary impact may be lower than for SMA 2 and SMA3. These huge costs for the later-onset forms are exclusive of new disease-modifying drugs. Nusinersen, the first FDA-approved medication costed from $516,896 [35] to $907,665 [29] in the first year, and from $ 258,448 [35] to $457,889 [29] in the second year. (Different prices estimated between 2017 and 2020, in the US and Europe). Onasemnogene abeparvovec, the second FDA approved drug is considered to be the most expensive
200,000 400,000 600,000 800,000 1,000,000 1,200,000 1,400,000
CADTH (34) ICER (36) Jalali (32) Malone (33) NCP (37) Zuluaga (35) ICER (36) Malone (33)
NCP (37) before 12 weeks ICER (36) pre-symptomati c Jalali (32) pre-symptomati c ICER (36) pre-symptomati c SMA1
Healthcare perspective (except Jalali: societal perspective) societal perspectivepre-symptomatic
ICER per QALY
(US$
)
ICER per QALY (US$) in SMA1 and pre-symptomatic patient with
treatment use.
Treated with nusinersen Treated with onasemnogene abeparvovec
Treated with Drug X
drug of the world and is priced at $2.1 million in the US for a single injection. Nusinersen has been approved for use for all types of SMA, yet pivotal studies were con-ducted only in SMA1 patients younger than 7 months and in SMA2 patient younger than 9 years [8, 41]. Two studies with data from patients followed outside clinical trials confirmed this efficacy in patients from 8 months to 9 years. Patients were followed for 6 months in the first study [42]. In the second study, patients ranged in age from 2.5 years to 8.5 years and were followed for 14 months [43]. Progression was more limited in older than in younger patients.
In one study funded by a pharmaceutical companies [29], a substantial yearly decrease of healthcare costs of $45,000 per patient was observed after nusinersen treatment. However, this decrease was not inclusive of the cost of treatment. A yearly cost comparison in SMA1 patients on treatment or on best standard of care but without treatment is only partially relevant. Indeed, survival of SMA1 patients without treatment and without mechanical ventilation beyond the age of two years is rare [3], which limits the budget impact of these patients. Since treated patients survive longer, the
total lifetime cost, and thus the budget impact, of these patients could be much larger than for those on stand-ard of care therapy [44].
Although it has been hypothesized that treated patients are those who have very severe symptoms who would have very high healthcare costs if left untreated, there is currently no data to support this hypothesis. Those who did not benefit from treatment, and whose costs were collected for the study retrospectively from a database that captures prescriptions claims, medi-cal utilization, and costs, would be those who did not urgently require treatment. These are patients for whom the healthcare costs are consequently lower than for the patients on treatment. This suggests that the cost of the disease for people with later-onset SMA who receive treatment is greater than for those given standard of care. As these are two different popula-tions, cost analysis should treat them differently. Treat-ment of prior to symptom onset has been shown to be more effective than is treatment after symptoms develop [13]. Pre-symptomatic treatment may result in a greater reduction in SMA costs, as shown in the eco-nomic evaluation reported by Jalali et al. [32]. This type 1,000,000 2,000,000 3,000,000 4,000,000 5,000,000 6,000,000 7,000,000 8,000,000 9,000,000 CADT H (3 4) SM A2 CADT H (3 4) SM A3 ICER (3 6) SM A 2-3 NC P (3 7) SM A 2, 3, 4 Zuluaga (3 5) SM A 2 )$ S Uf os dn as uo ht nI( YL A Qr ep RE CI
Later-onset SMA treated with nusinersen. Societal perspective except CADTH.
ICER per QALY (US$) for SMA with later-onset treated with nusinersen
compared to the standard of care
SMA 2 SMA 3 Mean SMA 2 and 3
of analysis could have a major impact on the launch of newborn screening programs.
It should be noted that these costs are not surprising in the context of rare diseases, even if the treatment for SMA is exceptionally high (as a reminder: the cost for nusinersen was estimated in 2020 at $776,000 for the first year, and $388,000 per year for the years after). For exam-ple, the infantile form of Pompe disease results in annual costs of $41,667 for standard of care, whereas treatments are estimated at $287,870 annually [45]. The burden of cystic fibrosis, a severe pulmonary disease characterized by frequent pulmonary infections and median survival of about 50 years, can to a certain extend be compared to the burden of SMA2. The estimated yearly cost of cystic fibrosis in 2016 is $131,879 for standard of care therapy including respiratory management and nutri-tion management [46]. Since 2016, new treatments have been approved that cost $300,000 per year [47]. Duch-enne muscular dystrophy, whose level of disability can be compared to SMA3, has annual costs for standard of care around $50,000 [48, 49]. Altogether, the reported cost for SMA benchmarks closely with the costs of other rare dis-eases that present with a similar level of disability.
Economic evaluations of new drug treatments for SMA have been conducted, but these studies are based on very few trials that included a limited number of patients fol-lowed for a very limited period of time. For these reasons, extrapolations were made. The medical data concern-ing the evolution of treated patients, as well as the costs generated by the disease in treated patients, are under-studied. For example, the QALYs used for the ICERs for nusinersen in SMA2 patients all come from a single study (CHERISH). Caution should also be exercised when com-paring data between treatments, as the populations stud-ied are not always comparable. Indeed, disease duration has been consistently shown to be the main predictor of treatment efficacy [12], and disease duration significantly differed between the two therapeutics trials conducted in patients with SMA1 (ENDEAR and START). Motor baseline levels, which has also been shown a predictive factor [42, 50], also differed between the two studies. Another limitation resides in the fact that trials did not collect utility values from patients or caregivers. Only vignettes were used to consider utility; these are not qualitative and are highly variable (e.g., the same health status was assessed at—0.13 to 0.73 [35]), and no single study appeared to capture the burden of disease in all the health states of interest. A final limitation is that all stud-ies conducted to date have been retrospective. Long-term prospective follow-up of patients is needed to capture costs and outcomes for all types of SMA.
In addition, only one economic evaluation has exam-ined specifically the cost-effectiveness of newborn
screening for SMA. Given the increase in screening programs and their potential value [14, 15, 51, 52], such economic evaluations are needed. Recent data have sug-gested that patients treated before symptom onset will have a different future than children treated after symp-toms appear [13]. If these patients have much less severe or no disabilities, the economics of treatment will be con-siderably impacted. Indeed, the cost of the treatment is the same whether it is provided before or after the first symptoms. The difference will be related to the cost of the associated handicap, which will be nil or almost non-existent in pre-symptomatic patients.
Due to the extremely high drug costs, the ICER values for the currently approved SMA therapies are high, and, therefore, treatments are not cost effective. It is important to acknowledge that discounted prices for SMA drugs are confidentially negotiating with payers. Cost-effectiveness analyses based on official prices may therefore overesti-mate the real cost-effectiveness of SMA drugs. One of the studies [32] provides recommendations for alternative prices based on a sensitivity analysis. Using data from the ENDEAR trial, this analysis suggests that to achieve a willingness to pay threshold of $50,000 per life years saved, a nusinersen dosage price of 19% of the current price would be required. With the arrival on the market of three therapies, prices should tend to decrease, which could then make the prices more acceptable. In addition, these new therapies are expected to become the standard of care, and subsequent economic evaluations will need to include drug therapy as a comparator.
Despite high costs, the approved drugs have been granted reimbursement in several countries. In the domain of rare diseases, the small number of patients makes drug development economically challenging. For example, drugs for treatment of Duchenne muscular dys-trophy, which results in costs comparable to SMA2 and SMA3, is associated with ICERs ranging from $944,975 to $2,341,474 [53]. Treatments for Fabry, Gaucher, and Pompe diseases range from $283,000 to $3,485,000, from $46,000 to $459,100, and from $162,800 to $1,108,050, respectively [54]. It is becoming accepted that in these types of conditions, the budget impact should be weighed more heavily than the rough ICER value. Since the fre-quency of the disease is very low, the budget impact is low despite high costs. Therefore, criteria other than cost-effectiveness are important for decision makers, especially for orphan drugs. Value frameworks have been proposed specifically for these rare and debilitating con-ditions. Garrison et al. have designed a framework value with SMA as an example. These authors suggest the importance of the “real option value”, the “value of hope”, and the "value of knowledge" [55]. Health equity (related to severity of disease), caregiver burden, and family
spillovers (in terms of the negative effect on the well-being of family members) are also important in these situations [56].
As treatments for rare diseases are unlikely to be cost effective given their high prices, additional criteria are already being used to inform reimbursement decisions in some countries. One relevant study analyzed use of public funds for orphan drugs in five European countries from the decision-maker’s point of view [57]. Another study was conducted in Italy from the patient’s point of view focusing on two diseases, cystic fibrosis and hemo-philia; it also quantified individual preferences [58]. The two studies concluded that the important factors in the decision-to-pay process are the cost of treatment, the improvement in health of patients, and the value for money. The severity of the disease and the availability of alternative treatments should also be considered but are less important. Furthermore, the technical experts inter-viewed pointed out that an onset of symptoms in early childhood, diagnosis delay, and treatment side effects should also be considered as important social values. As several criteria are relevant, a multi-criteria decision analysis can constitute a valuable solution for decision-making. It allows the influence of each criterion on the decision and relative importance to be defined, going beyond the simple QALY analysis [57, 58].
This literature review has some limitations. First, only two databases (Medline and Scopus) were searched. The work of Sassi et al. [59] showed that by using only Medline, with appropriate search strategies, researchers can significantly reduce the number of irrelevant refer-ences retrieved by their electronic searches that require exclusion by manual selection. They point out that by not using Embase, there is a risk of losing some references compared to Medline, but that Embase does not include a large number of references. These authors conclude that manual searches and searches in databases other than Medline for reviewing economic evaluations have limited incremental return, so that Medline could be considered as the primary source. Nevertheless, we also investigated Scopus, in order to be as thorough as possible.
Second, we limited our search to original articles; con-ference proceedings were not included. It is likely that data presented at conferences on neuromuscular diseases or SMA will be published soon, as the SMA world is in a period of upheaval given that the recent approvals of effective therapies. Nevertheless, decisions on pricing are being made today on the basis of publicly data avail-able. One of the studies we relied upon was itself a rea-nalysis and additional limitations were noted: Patient conditions reported are relative (stabilizing, improv-ing, worsening) instead of absolute and were relative to individual patient’s baseline conditions and not to motor
scale numbers. With respect to clinical trial design, patients who participate in the trials are only a sample of the patient population, particularly in terms of age, and cannot be used as a projection to the entire patient population [34]. A final limitation is that studies funded by the pharmaceutical industry showed lower ICERs. Although the number of studies is too limited to make reliable comparison between industry-sponsored and non-industry sponsored economic evaluations, and the fact that no relationship was observed in other diseases [60], this remains a potential study publication bias as pharmaceutical companies could tend to present most favorable results. Despite the scarcity of economic evalu-ations of SMA, these few published studies will be cen-tral for health authorities who will use these data to drive policy choices. It therefore is important to also consider from research from independent institutes or unsubsi-dized academic groups.
Conclusions
In conclusion, this literature review revealed the substan-tial cost burden of SMA and the high ratio of cost effec-tiveness of the approved drugs at the current price when delivered in post-symptomatic patients. Few studies eval-uating cost and economic benefits of therapy have been conducted so far, and there is a need for further pro-spective and independent economic studies, in patients treated after symptom onset and in patients who are ben-efiting from pre-symptomatic treatment.
Supplementary information
The online version contains supplementary material available at https ://doi. org/10.1186/s1302 3-021-01695 -7.
Additional file 1. List of words used for the search Additional file 2. Strategy for search of MEDLINE Ovid Abbreviations
EMA: European Medicines Agency; FDA: Food and Drug Administration; ICER: Incremental Cost-Effectiveness Ratio; QALY: Quality-Adjusted Life Years; SMA: Spinal Muscular Atrophy.
Acknowledgements
We thank Jacqueline R. Wyatt for editing the manuscript. Authors’ contributions
TD, LS, and MH designed the study. TD, CB and ChB performed the literature search. TD and ChB checked the quality of the studies. MH verified the analyti-cal methods. TD wrote the manuscript with support from MH and LS. MH and LS supervised the work. All authors read and approved the final manuscript. Funding
There was no funding for this study. Availability of data and materials
Data sharing is not applicable to this article as no datasets were generated or analyzed during the current study.
Ethics approval and consent to participate Not applicable.
Consent for publication Not applicable. Competing interests
CB, ChB and MH declare that they have no competing interests relevant to this study. TD has given lectures sponsored by Biogen and Roche. LS has given lectures and has served as a consultant for Roche, Biogen, Avexis, and Cytoki-netics. LS is the project leader of the newborn screening in Southern Belgium funded by Avexis, Roche, and Biogen.
Author details
1 University of Liège, Liège, Belgium. 2 Department of Health Services Research, CAPHRI Care and Public Health Research Institute, Maastricht University, P.O. Box 616, Maastricht 6200 MD, The Netherlands. 3 Department of Paediatrics, Neuromuscular Reference Center Disease, Liège, Belgium. 4 Department of Paediatrics, MDUK Neuromuscular Center, University of Oxford, Oxford, UK.
Received: 3 April 2020 Accepted: 18 January 2021
References
1. Verhaart IEC, Robertson A, Wilson IJ, Aartsma-Rus A, Cameron S, Jones CC, et al. Prevalence, incidence and carrier frequency of 5q-linked spinal mus-cular atrophy—a literature review. Orphanet J Rare Dis. 2017;12(1):124. 2. Zerres K, Rudnik-Schoneborn S. Natural history in proximal spinal
muscular atrophy, Clinical analysis of 445 patients and suggestions for a modification of existing classifications. Arch Neurol. 1995;52(5):518–23. 3. Wijngaarde CA, Stam M, Otto LAM, van Eijk RPA, Cuppen I, Veldhoen ES,
et al. Population-based analysis of survival in spinal muscular atrophy. Neurology. 2020;94(15):e1634–44.
4. Chabanon A, Seferian AM, Daron A, Pereon Y, Cances C, Vuillerot C, et al. Prospective and longitudinal natural history study of patients with Type 2 and 3 spinal muscular atrophy: baseline data NatHis-SMA study. PLoS ONE. 2018;13(7):e0201004.
5. Zerres K, Rudnik-Schoneborn S, Forrest E, Lusakowska A, Borkowska J, Hausmanowa-Petrusewicz I. A collaborative study on the natural history of childhood and juvenile onset proximal spinal muscular atrophy (type II and III SMA): 569 patients. J Neurol Sci. 1997;146(1):67–72.
6. Landfeldt E, Edstrom J, Sejersen T, Tulinius M, Lochmuller H, Kirschner J. Quality of life of patients with spinal muscular atrophy: a systematic review. Eur J Paediatr Neurol EJPN. 2019;23(3):347–56.
7. Ramdas S, Servais L. New treatments in spinal muscular atrophy: an overview of currently available data. Expert Opin Pharmacother. 2020;21(3):307–15.
8. Finkel RS, Mercuri E, Darras BT, Connolly AM, Kuntz NL, Kirschner J, et al. Nusinersen versus sham control in infantile-onset spinal muscular atro-phy. N Engl J Med. 2017;377(18):1723–32.
9. Mendell JR, Al-Zaidy S, Shell R, Arnold WD, Rodino-Klapac LR, Prior TW, et al. Single-dose gene-replacement therapy for spinal muscular atrophy. N Engl J Med. 2017;377(18):1713–22.
10. Lowes L, Al-Zaidy S, Shell R, Arnold W, Rodino-Klapac L, Prior T, et al. AVXS-101 phase 1 gene therapy clinical trial in SMA Type 1: patients treated early with the proposed therapeutic dose were able to sit unassisted at a younger age. Neuromuscular Disorders NMD. 2017;27:S208–9.
11. Roche. FDA approves Roche’s Evrysdi (risdiplam) for treatment of spinal muscular atrophy (SMA) in adults and children 2 months and older 2020.
https ://www.roche .com/media /relea ses/med-cor-2020-08-10b.htm. 12. Dangouloff T, Servais L. Clinical evidence supporting early treatment of
patients with spinal muscular atrophy: current perspectives. Ther Clin Risk Manag. 2019;15:1153–61.
13. De Vivo DC, Bertini E, Swoboda KJ, Hwu WL, Crawford TO, Finkel RS, et al. Nusinersen initiated in infants during the presymptomatic stage of spinal muscular atrophy: interim efficacy and safety results from the Phase 2 NURTURE study. Neuromuscular Disorders NMD. 2019;29(11):842–56.
14. Boemer F, Caberg JH, Dideberg V, Dardenne D, Bours V, Hiligsmann M, et al. Newborn screening for SMA in Southern Belgium. Neuromuscular Disorders NMD. 2019;29(5):343–9.
15. Dangouloff T, Burghes A, Tizzano EF, Servais L. 244th ENMC international workshop: newborn screening in spinal muscular atrophy May 10–12, 2019, Hoofdorp, The Netherlands. Neuromuscular Disorders NMD. 2020;30(1):93–103.
16. Moher D, Liberati A, Tetzlaff J, Altman DG. Preferred reporting items for systematic reviews and meta-analyses: the PRISMA statement. PLoS Med. 2009;6(7):e1000097.
17. Watts RD, Li IW. Use of checklists in reviews of health economic evalua-tions, 2010 to 2018. Value Health. 2019;22(3):377–82.
18. Evers S, Goossens M, de Vet H, van Tulder M, Ament A. Criteria list for assessment of methodological quality of economic evaluations: Con-sensus on Health Economic Criteria. Int J Technol Assess Health Care. 2005;21(2):240–5.
19. Odnoletkova I. CHEC-extended: a tool for the quality assessment of economic evaluations of healthcare interventions 2014. https ://www. resea rchga te.net/publi catio n/31400 3661_CHEC-Exten ded_A_tool_for_ the_quali ty_asses sment _of_econo mic_evalu ation s_of_healt hcare _inter venti ons.
20. Webster I. Official Inflation Data, $100 in 2019 → 2020/Inflation Calcula-tor. 2020 [Based on U.S. Bureau of Labor Statisctics (Consumer Price Index)]. https ://www.offic ialda ta.org/us/infla tion/.
21. Statistics USBoL. Consumer Price Index 2020. https ://www.bls.gov/cpi/. 22. OCDE. Exchange rate (indicator) 2020 [Taux de change (indicateur)]. https
://data.oecd.org/fr/conve rsion /taux-de-chang e.htm#indic ator-chart . 23. LewinGroup. Cost of Amyotrophic Lateral Sclerosis, Muscular Dystrophy,
and Spinal Muscular Atrophy in the United States. Final Report—MDA Cost of Illness in the United States. 2012, March, 1.
24. Armstrong EP, Malone DC, Yeh WS, Dahl GJ, Lee RL, Sicignano N. The eco-nomic burden of spinal muscular atrophy. J Med Econ. 2016;19(8):822–6. 25. Lee M Jr, Franca UL, Graham RJ, McManus ML. Pre-nusinersen
hospitali-zation costs of children with spinal muscular atrophy. Pediatr Neurol. 2019;92:3–5.
26. Farrar MA, Carey KA, Paguinto SG, Chambers G, Kasparian NA. Financial, opportunity and psychosocial costs of spinal muscular atrophy: an exploratory qualitative analysis of Australian carer perspectives. BMJ Open. 2018;8(5):e020907.
27. Darbà J. Direct medical costs of spinal muscular atrophy in the Catalonia region: a population-based analysis. Clin Drug Investig. 2020;40(4):335–41.
28. Peña-Longobardo LM, Aranda-Reneo I, Oliva-Moreno J, Litzkendorf S, Durand-Zaleski I, Tizzano E, et al. The economic impact and health-related quality of life of spinal muscular atrophy. An analysis across Europe. Int J Environ Res Public Health. 2020;17(16):5640.
29. Droege M, Sproule D, Arjunji R, Gauthier-Loiselle M, Cloutier M, Dabbous O. Economic burden of spinal muscular atrophy in the United States: a contemporary assessment. J Med Econ. 2020;23(1):70–9.
30. Klug C, Schreiber-Katz O, Thiele S, Schorling E, Zowe J, Reilich P, et al. Disease burden of spinal muscular atrophy in Germany. Orphanet J Rare Dis. 2016;11(1):58.
31. Chambers GM, Settumba SN, Carey KA, Cairns A, Menezes MP, Ryan M, et al. Prenusinersen economic and health-related quality of life burden of spinal muscular atrophy. Neurology. 2020;95(1):e1–10.
32. Jalali A, Rothwell E, Botkin JR, Anderson RA, Butterfield RJ, Nelson RE. Cost-effectiveness of Nusinersen and universal newborn screening for spinal muscular atrophy. J Pediatr. 2020;227:274–80.
33. Malone DC, Dean R, Arjunji R, Jensen I, Cyr P, Miller B, et al. Cost-effec-tiveness analysis of using onasemnogene abeparvocec (AVXS-101) in spinal muscular atrophy type 1 patients. J Mark Access Health Policy. 2019;7(1):1601484.
34. CADTH Common Drug Reviews. Pharmacoeconomic Review Report: Nusinersen (Spinraza): (Biogen Canada Inc): Indication: Treatment of patients with 5q SMA. Ottawa (ON): Canadian Agency for Drugs and Technologies in Health Copyright © 2018 Canadian Agency for Drugs and Technologies in Health; 2018.
35. Zuluaga-Sanchez S, Teynor M, Knight C, Thompson R, Lundqvist T, Ekelund M, et al. Cost effectiveness of nusinersen in the treatment of patients with infantile-onset and later-onset spinal muscular atrophy in Sweden. PharmacoEconomics. 2019;37(6):845–65.
•fast, convenient online submission
•
thorough peer review by experienced researchers in your field
• rapid publication on acceptance
• support for research data, including large and complex data types
•
gold Open Access which fosters wider collaboration and increased citations maximum visibility for your research: over 100M website views per year
•
At BMC, research is always in progress. Learn more biomedcentral.com/submissions
Ready to submit your research
Ready to submit your research ? Choose BMC and benefit from: ? Choose BMC and benefit from: 36. ICER. Spinraza® and Zolgensma® for Spinal Muscular Atrophy:
Effective-ness and Value [Report]. Institute for Clinical and Economic Review; 2019. Updated 24 May 2019. https ://icer-revie w.org/wp-conte nt/uploa ds/2018/07/ICER_SMA_Final _Evide nce_Repor t_05241 9.pdf.
37. NCP. Cost-effectiveness of Nusinersen (Spinraza) for the treatment of 5q spinal muscular atrophy (SMA). National Center for Pharmacoeconomics; 2017. http://www.ncpe.ie/wp-conte nt/uploa ds/2017/08/Summa ry-Nusin ersen .pdf.
38. D’Amico A, Mercuri E, Tiziano FD, Bertini E. Spinal muscular atrophy. Orphanet J Rare Dis. 2011;6(1):71.
39. Finkel RS, McDermott MP, Kaufmann P, Darras BT, Chung WK, Sproule DM, et al. Observational study of spinal muscular atrophy type I and implica-tions for clinical trials. Neurology. 2014;83(9):810–7.
40. Kolb SJ, Coffey CS, Yankey JW, Krosschell K, Arnold WD, Rutkove SB, et al. Natural history of infantile-onset spinal muscular atrophy. Ann Neurol. 2017;82(6):883–91.
41. Mercuri E, Darras BT, Chiriboga CA, Day JW, Campbell C, Connolly AM, et al. Nusinersen versus Sham control in later-onset spinal muscular atrophy. N Engl J Med. 2018;378(7):625–35.
42. Aragon-Gawinska K, Seferian AM, Daron A, Gargaun E, Vuillerot C, Cances C, et al. Nusinersen in patients older than 7 months with spinal muscular atrophy type 1: a cohort study. Neurology. 2018;91(14):e1312–8. 43. Aragon-Gawinska K, Daron A, Ulinici A, Vanden Brande L, Seferian A,
Gidaro T, et al. Sitting in patients with spinal muscular atrophy type 1 treated with nusinersen. Dev Med Child Neurol. 2020;62(3):310–4. 44. Cardenas J, Menier M, Heitzer MD, Sproule DM. High healthcare resource
use in hospitalized patients with a diagnosis of spinal muscular atrophy type 1 (SMA1): retrospective analysis of the kids’ inpatient database (KID). PharmacoEconomics Open. 2019;3(2):205–13.
45. Schoser B, Hahn A, James E, Gupta D, Gitlin M, Prasad S. A systematic review of the health economics of Pompe disease. Pharmacoecon Open. 2019;3(4):479–93.
46. Grosse SD, Do TQN, Vu M, Feng LB, Berry JG, Sawicki GS. Healthcare expenditures for privately insured US patients with cystic fibrosis, 2010–2016. Pediatr Pulmonol. 2018;53(12):1611–8.
47. Orenstein DM, Abood RN. Cost(s) of caring for patients with cystic fibrosis. Curr Opin Pediatr. 2018;30(3):393–8.
48. Larkindale J, Yang W, Hogan PF, Simon CJ, Zhang Y, Jain A, et al. Cost of illness for neuromuscular diseases in the United States. Muscle Nerve. 2014;49(3):431–8.
49. Schreiber-Katz O, Klug C, Thiele S, Schorling E, Zowe J, Reilich P, et al. Comparative cost of illness analysis and assessment of health care burden of Duchenne and Becker muscular dystrophies in Germany. Orphanet J Rare Dis. 2014;9:210.
50. Lowes LP, Alfano LN, Arnold WD, Shell R, Prior TW, McColly M, et al. Impact of age and motor function in a phase 1/2A study of infants with SMA
type 1 receiving single-dose gene replacement therapy. Pediatr Neurol. 2019;98:39–45.
51. Kariyawasam DST, Russell JS, Wiley V, Alexander IE, Farrar MA. The implementation of newborn screening for spinal muscular atrophy: the Australian experience. Genet Med. 2020;22(3):557–65.
52. Vill K, Kolbel H, Schwartz O, Blaschek A, Olgemoller B, Harms E, et al. One year of newborn screening for SMA—results of a German pilot project. J Neuromuscular Dis. 2019;6(4):503–15.
53. Landfeldt E, Alfredsson L, Straub V, Lochmuller H, Bushby K, Lindgren P. Economic evaluation in Duchenne muscular dystrophy: model frameworks for cost-effectiveness analysis. PharmacoEconomics. 2017;35(2):249–58.
54. Schuller Y, Hollak CE, Biegstraaten M. The quality of economic evaluations of ultra-orphan drugs in Europe—a systematic review. Orphanet J Rare Dis. 2015;10:92.
55. Garrison LP, Jackson T, Paul D, Kenston M. Value-based pricing for emerg-ing gene therapies: the economic case for a higher cost-effectiveness threshold. J Manag Care Spec Pharm. 2019;24:1–7.
56. Jena A, Lakdawalla D. Value frameworks for rare diseases: Should they be different 2017. https://www.healthaffairs.org/do/https ://doi.org/10.1377/ hblog 20170 412.05956 3/full/.
57. López-Bastida J, Ramos-Goñi JM, Aranda-Reneo I, Trapero-Bertran M, Kanavos P, Rodriguez MB. Using a stated preference discrete choice experiment to assess societal value from the perspective of decision-makers in Europe. Does it work for rare diseases? Health Policy (Amster-dam, Netherlands). 2019;123(2):152–8.
58. López-Bastida J, Ramos-Goñi JM, Aranda-Reneo I, Taruscio D, Magrelli A, Kanavos P. Using a stated preference discrete choice experiment to assess societal value from the perspective of patients with rare diseases in Italy. Orphanet J Rare Dis. 2019;14(1):154.
59. Sassi F, Archard L, McDaid D. Searching literature databases for health care economic evaluations: how systematic can we afford to be? Med Care. 2002;40(5):387–94.
60. Fleurence RL, Spackman DE, Hollenbeak C. Does the funding source influence the results in economic evaluations? A case study in bispho-sphonates for the treatment of osteoporosis. PharmacoEconomics. 2010;28(4):295–306.
61. Lopez-Bastida J, Pena-Longobardo LM, Aranda-Reneo I, Tizzano E, Sefton M, Oliva-Moreno J. Social/economic costs and health-related quality of life in patients with spinal muscular atrophy (SMA) in Spain. Orphanet J Rare Dis. 2017;12(1):141.
Publisher’s Note
Springer Nature remains neutral with regard to jurisdictional claims in pub-lished maps and institutional affiliations.

![Table 3 Overview of the characteristics of the six economic evaluations by population, intervention, and results ReferencesPopulationIntervention/comparator/(including drug prices)Results (Drugs costs are never included in the analysis) CADTH [34]SMA1, 2,](https://thumb-eu.123doks.com/thumbv2/123doknet/5950869.146970/8.892.130.797.133.1095/overview-characteristics-evaluations-population-intervention-referencespopulationintervention-comparator-including.webp)