Research Programme of the Research Fund for Coal and Steel
Steel RTD
TGS8
Two INnovations for Earthquake Resistant Design
The INERD Project
.
A. PLUMIER, C. DONEUX Catherine
Université de LiègeInstitut de Mécanique et Génie Civil – Bât.B52/3 Chemin des Chevreuils, 1, B – 4000 LIEGE 1, BELGIUM
C.CASTIGLIONI, J. BRESCIANINI, A. CRESPI , S. DELL’ANNA , L.LAZZAROTTO
Politecnico di MilanoDipartimento di Ingegneria Strutturale, POLITECNICO DI MILANO Piazza Leonardo da Vinci, 32, I-20133 Milano, ITALY
L.CALADO, J.FERREIRA Joao, S. FELIGIONI
ISTInstituto Superior Técnico , Department of Civil Engineering and Architecture Av. Rovisco Pais, P-1049-001 Lisboa, PORTUGAL
O.BURSI , F.FERRARIO, M.SOMMAVILLA
University of TrentoUniversita Degli Studi di Trento,Dipartimento di Ingegneria Mecc. e Strutturale Via Mesiano 77,I-38050 Trento ,ITALY
I.VAYAS , P.THANOPOULOS
NTUANational Technical University of Athens,Department of Civil Engineering Patission Str. 20,GR-10682 Athens,GREECE
T.DEMARCO
ProfilArbed RecherchesProfil ARBED Recherches,B.P. 14, L – 4009 Esch sur Alzette GRAND DUCHE DE LUXEMBOURG
CEC Agreement No7210-PR-316
1 July 2001 to 30 June 2004
ABSTRACT.
The project develops two innovations.
The first innovation promotes a construction measure by which the "soft storey" mechanism is obviated in the lower storeys of reinforced concrete (R.C.) frames by encasing steel profiles in R.C. columns in order to provide them with a basic reliable shear, bending and compression resistance. Tests are performed and comparison of the behaviour of reference reinforced concrete and composite specimens made. Several parameters are studied: axial load, length of anchorage, stiffeners in the panel zone, weak and strong axis bending, configurations with and without infills. The study defines design rules for steel profiles to be encased in ductile R.C. columns, formulas for the behaviour of local strut and tie
mechanism in presence of infills and formulas for the calculation of the shear resistance of a composite beam-to-column panel zone in configurations without infills.
The second innovation consists in using dissipative connections for diagonals of frames with concentric bracings. Two types of connections are studied: the “pin” connections, made of bent rounded or
rectangular bars, and “U-device” connection, made of plates bent in U. Their behaviour is studied experimentally on connections and on complete bracings. Design rules are defined, especially for the pin connection, and fatigue curves obtained. The applicability and interest are set forward by numerical studies and comparative design of structures with classical and with dissipative connections. The innovation demonstrates a higher capacity to dissipate energy. It can be translated into higher behaviour factor q.
STRUCTURE OF THE REPORT.
There are three distinct parts in the report of the INERD project.
The first part is a document focused on the presentation of the design relationships or methods developed in the course of the INERD project. Calling the document a “design guide” might be too ambitious, because there are still assessments to be made in the future for some of the proposed design relationships. It is a “Design Report”. It is presented at the front of this document, in Sections 1 and 2. The second part is a report explaining the meaning of the research activity in the INERD project, the background and the conclusions. It is a “Research Report”, which is presented in Sections 3, 4 and 5 of this document.
The third part of the INERD Report compiles all the experiments, either physical or numerical, with measurements, graphs, curves, etc. It is a “Laboratory Report”. The “Laboratory Report” is not included in the present document, due to its size. It can be obtained separately upon request by email at: [email protected]
TABLE OF CONTENT.
STRUCTURE OF THE REPORT. ... 3
SYMBOLS………7
1. DESIGN REPORT ON COMPOSITE COLUMNS... 9
1.1 Design conditions for the encased steel profile... 9
1.2 Local failure mechanism in case of pilotis structure (presence of infills at all floors
except the first one) Verification formulas. ... 11
1.3. Seismic design of composite beam-to-column joint ... 15
2. DESIGN REPORT ON DISSIPATIVE CONNECTIONS... 17
2.1. Description of the INERD connections... 17
2.2. Benefits of braced frames with INERD connections ... 18
2.3. Mechanical characteristics of pin INERD connections... 19
2.4. Code rules for braced frames with pin INERD-connections... 21
2.5. Practical design procedure and design example... 22
2.6. Design example ... 23
2.7. Design proposal for fatigue... 25
3. RESEARCH REPORT ON DISSIPATIVE COMPOSITE COLUMNS FOR MITIGATION
OF SOFT STOREY FAILURES IN REINFORCED CONCRETE COLUMNS. ... 31
3.1 Definition of the problem and proposal for a solution... 31
3.2. Research approach. Design requirements for the encased steel profile. ... 32
3.3. Test set up and testing procedure. ... 35
3.4. Plastic hinges in columns as dissipative mechanism. ... 37
3.4.1. Specific features of the test set up... 37
3.4.2. Global behaviour of the tests specimens. ... 38
3.4.3. Conclusions from the tests. ... 45
3.4.4. Effect of discrepancies between the concrete design resistance and actual resistance.
... 46
3.4.5. Design resistance of potential local failure mechanisms. ... 48
3.5. Composite panel zone as dissipative mechanism... 56
3.5.1. Forces acting at the beam-to-column joint... 56
3.5.2. Analytical procedure for an effective composite joint design... 59
Panel Zone Resistance... 60
Horizontal Bearing Resistance ... 61
Concrete Compression Field Resistance ... 62
Bond Shear Resistance... 62
3.5.3. Conclusions from the tests. ... 63
3.5.4. Experimental and numerical validation of the analytical formulas... 67
3.6. Conclusions on composite columns. ... 73
4. RESEARCH REPORT ON DISSIPATIVE CONNECTIONS FOR FRAMES WITH
CONCENTRIC BRACINGS. ... 75
4.1. Motivation for using dissipative connections in frames with concentric bracings. ... 75
4.2. Description of the INERD connections and research approach... 76
4.3. Tests on single connections... 78
4.3.1.Test setup and test programme... 78
Pin connections ... 79
U connections... 79
Global comparisons... 85
4.3.3. Results in terms of Fatigue... 85
4.4. Tests on frames with concentric bracings and dissipative connections. ... 90
4.4.1. Test set up and test programme... 90
4.2.2. Results ... 93
Global comparisons... 97
4.5. Theoretical assessment of dissipative connections and of frames with concentric
bracings using dissipative connections. ... 100
4.5.1. Analysis of pin INERD connections ... 100
4.5.2. Frame and connection kinematics ... 110
4.5.3. Response of braced frames with INERD connections under static loading... 113
4.5.4. Response of braced frames with INERD connections under seismic loading ... 115
4.6. Conclusions on dissipative connections in concentric bracings... 122
5. GENERAL CONCLUSION AND FUTURE WORK. ... 125
Symbols.
The symbols used in Section 3 are the following.
ac height of the Stress Block, equal to: (0,58hb/2).
Acs area of the inner concrete strut of the panel zone mechanism.
As,tie total area of a layer of the transversal reinforcement.
As,teel cross sectional area of the steel profile.
Atotal cross sectional area of the composite section.
Av cross sectional shear area of the steel column.
bcf width of the steel column flange.
bcs effective width of the outer concrete strut, equal to: (bc–bcf–2cc).
d effective height of the reinforced concrete column, equal to: (hcol–cc).
ds panel zone height measured centre to centre line of the axis of the continuity plates.
Ec concrete Young modulus.
Es steel Young modulus.
fbd bond design strength.
fcd concrete cylindrical design strength in compression.
fck,c concrete cylindrical characteristic strength in compression accounting for the
confinement effect.
fyd,w yield design strength of the transversal reinforcement.
fym,d,cw mean yield design strength of the steel column web.
fyk,w characteristic yield design strength of the transversal reinforcement.
G dead load.
hb height of the reinforced concrete beam.
hc depth of the column steel profile.
Lbeam distance between inflectionpoints in the beam.
Lcol distance between inflexional points in the column equal to the its free length.
Mg bending moment acting in the beam due to the gravity loads.
Mj,Rd design resisting moment of the joint.
M’j,Rd design resisting moment of the joint, taking into account the Capacity Design.
M’j,Rd,BF,col design resisting moment of the bond mechanism in the composite column.
M’j,Rd,CCF design resisting moment of the concrete compression field mechanism.
M’j,Rd,CCS design resisting moment of the inner concrete compression strut.
M’j,Rd,HBF design resisting moment of the horizontal bearing mechanism.
M’j,Rd,INNER design resisting moment of the inner part of the joint.
M’j,Rd,OUTER design resisting moment of the outer part of the joint.
M’j,Rd,SWP design resisting moment of the shear web panel.
Mj,Sd design stressing moment of the joint.
Mp plastic bending moment.
MRd,beam design resisting moment of the beam region next to the joint.
Ms bending moment acting in the beam due to the seismic loads.
Nrd design compressive resistance of the column.
Nsd design compressive force acting on the column.
Q live load.
r radius of the steel profile between the web and the flange.
stie longitudinal spacing of the transversal reinforcement in the joint region.
tbf thickness of the steel beam flange.
tcf thickness of the steel column flange.
tcw thickness of the steel column web.
Tcb compressive force acting on a set of longitudinal re-bars of the column.
Tmb friction design force developed by a set of longitudinal re-bars of the column.
Ttb tensile force acting on a set of longitudinal re-bars of the column.
Vc shear resistance of the concrete part in the joint region, equal to: (Vc,inner+Vc,outer).
Vj,ccf shear resistance of the concrete compression field in the outer joint region.
Vj,hbf shear resistance of the horizontal bearing mechanism.
Vj,Rd shear design resistance of the composite joint.
Vj,Sd design shear force actingon the joint.
Vj,swp nominal shear resistance of the steel column web.
Vs shear resistance of the transversal reinforcement.
xrb,c distance between the barycentres of the two sets of longitudinal re-bars resisting in
bonding.
αc magnification factor defined in Eurocode 2.
φb total perimeter of a set of longitudinal re-bars encased in the outer zone of the joint,
equal to: Tcb o Ttb.
γc partial safety factor for the concrete at the ULS.
γg partial safety factor for the dead load.
γq partial safety factor for the live load.
γs partial safety factor for the reinforcement steel at ULS.
ν reduction factor from Eurocode 2.
1. DESIGN REPORT ON COMPOSITE COLUMNS
1.1 Design conditions for the encased steel profile
The proposed innovation for the problem of soft storey consists in encasing steel profiles (HE or UC) in the lowest levels of reinforced concrete (R.C.) columns in order to provide them a basic reliable shear and compression resistance. The idea is to use encased steel section as a ductile fuse able to dissipate cyclically the energy of the earthquake in the columns of the lower storey of the buildings which otherwise remain reinforced concrete buildings. The objective is to ensure a minimum structural reliability especially in the possible tricky circumstances of either a bad concrete mix utilisation or an awkward concrete hardening process.
In the concept of the proposal, the steel profiles are "safety belts": if circumstances are such that a soft storey mechanism would form under earthquake action, the plastic hinges in the R.C. column at ground level would not provide much ductility; then the steel profile would come into action. The objectives are:
To achieve this goal, it is necessary to satisfy some simple criteria to design the steel profiles:
• to maintain axial strength, (plastic) moment resistance, and stiffness similar to those of the RC column at the ultimate stage when concrete is locally crushed.
• to provide ductility.
The corresponding detailed design criteria are:
I. The steel section alone should at least be able to take the design axial force of the seismic loading case:
NRd > NSd(γg. G + γq. Q) [1.1]
with γg = 1 and γq = 0,3
II. The steel section alone (not acting composedly) should be able to substitute the deficient concrete section due to the bending moment and shear actions at collapse:
MRd,steel > MRd,concrete [1.2]
VRd,steel > VRd,concrete [1.3]
for axial force NSd considered equal to zero
III. The steel sections should not much modify the local stiffness EI of the single RC column (maximum modification level in the order of 10%) in order not to change the distribution of stiffness in the entire and original RC structure. In fact, a change in stiffness distribution may also signify a variation of the building periods of vibration closely tied to the inertial forces, e.g. seismic forces.
IV. The following ratio should be close to unity in order to achieve a suitable performance of the steel profile along major and minor axis bending:
Rd,comp Rd,concrete major major M M r = ⎛ ⎞ ⎜ ⎟ ⎝ ⎠
[1.4]
The idea developed is to insert steel profiles in columns at ground level. It raises the problem of how to realize the details of the anchorage and how far to extend the anchorage of these steel profiles into the concrete structure of the 1st storey and of the ground level.
At the present state of knowledge, the good behavior of the encased steel profile is ensured provided that the following requirements are met:
-
“long” anchorage of the steel profile in the concrete column of the second floor
long anchorage short anchorage
Figure 1.1. Anchorage of the steel profile into the second floor
- presence of an endplate at the end of the steel profile, to transmit axial forces and bending moment
Figure 1.2. Endplate at the end of the steel profile - stiffeners in the panel zone of the steel profile
- confinement is present in the anchorage zone by the same density of stirrups in the anchorage length as in the critical zones of the reinforced concrete node.
It is clear that all these criteria are on the safe side. It has been seen in the INERD research that short anchorage was also effective and that stiffeners were not absolutely necessary. Unfortunately, these very positive results are linked to a very strong concrete combined with very effective confinement. Some additional research is still needed to allow less severe design rules.
1.2 Local failure mechanism in case of pilotis structure (presence of infills at all floors
except the first one) Verification formulas.
This part is not complete, in the sense that the following formulas represent the “resisting” parts of the possible failure mechanism in case of pilotis structures. The “action effect” part to be considered in the verifications has not been defined. Calculations had been done with possible maximal actions, with the idea that if the verifications were ok with secure actions, the design was ok. But the verifications were not ok, even though the tests showed that no failure occurred. So, it seems that this procedure is too secure and additional work is still needed.
The link between the whole pilotis structure and the beam-to-column node where the local failure mechanism is supposed to occur is presentedat Figure 1.3.
additional steel section plastic hinge crushed concrete
Figure 1.3 . Link between global pilotis structure and local failure mechanism
In the following, the drawings are given for a configuration with the first floor at the top and the second floor at the bottom of the beam-to-column node.
The formation of the compressive strut in the beam is conditioned by local equilibrium in the node, implying steel ties in tension and concrete struts in compression, as shown in Figure 1.4.
compression strut infill reaction re-bars in tension Moment Shear tension in the steel profile γ
compression in the steel profile direct compression by the endplate beam depth
Figure 1. 5. Equilibrium of steel profile in compression
The compression strut force (1) in Figure 1.6 is equilibrated at both ends by compression perpendicular to contact surface (steel profile at one end, infill at the other end (2)) and by tension in re-bars of column and beam (3). The tension in the beam re-bar is also equilibrated by a compressed strut bearing on the vertical side of the infill
.
re-bars in tension (3) compression strut (1) re-bars in tension (3) infill reactions γ bearing compression (2) bearing compression (2)
Figure 1. 6. Equilibrium of one compressed concrete strut
The steel profile in tension is equilibrated by the additional compression coming from the applied vertical load, and also superposed and equilibrated by the compressed strut in the beam. No mechanism is independent. But the estimations of resistance will be done separately because the different mechanisms here are beneficial for each other. So, it is secure to work partly independently.
compression strut 45° crushed concrete contact plate infill b m in b m ax h beam hcolumn hsteel profile 100 400 h colu m n 2 +1 00 h column 2 +100) hbeam - ( h steel profile h
column-hsteel profile
b beam cover c h column 2 +100) h beam - ( 2 2
(a )
strong axis specimen
compression strut 45° crushed concrete contact plate infill b m in b m ax hbea m h column b steel profile 100 400 hcolu m n 2 +1 00 h column 2 +100) hbeam - ( b steel profile b beam cover c hcolumn 2 +100) hbeam - ( 2
(b) weak axis specimen
Figure 1.7. Notations to define the dimensions of the compressedstrut
The dimensions of the compressed strut (1) are represented on Figure 1.7 with the assumption of a 45° slope for the compressed strut. Their resistance are calculated in function of minimum and maximum widths given in the following equations.
Width of the compressed strut for the strong axis specimens bstrut min = 2 2 (hbeam – ( column h 2 + 100) + steel profile h 2 ) [mm] [1.5] bstrut max = 2 2 (hbeam – 100) [mm] [1.6]
Width of the compressed strut for the weak axis specimens bstrut min = 2 2 (hbeam – ( column h 2 + 100)) [1.7] bstrut max = 2 2 (hbeam – ( column h 2 + 100) + steel profile b 2 ) [1.8]
Thickness of the compressed strut
tstrut = bbeam – 2 ccover – φstirrup [1.9]
Resistance of the struts
NRd strut = ν fc bstrut tstrut [1.10]
With ν = 0,6
The bearing compression of the concrete of the strut on the steel profile (2) is also estimated for both strong and weak axis specimens.
For the strong axis specimens, the bearing compression of the concrete is located on the flanges of the steel profile. The resistance to the bearing compression is calculated as follows:
hbearing = bstrutmin 2 = hbeam – (hcolumn
2 + 100) +
steel profile
h
2 [1.11]
wbearing = bsteel profile [1.12]
Resistance = NRd bearing = fc hbearing bsteel profile [1.13]
For the weak axis specimens, the bearing compression is located on the web of steel profile instead of on the flanges. The resistance to the bearing compression is calculated as follows:
hbearing = bstrutmin = hbeam – (hcolumn
2 + 100) [1.14]
wbearing = hsteel profile - 2 tflanges steel profile [1.15]
Resistance = NRd bearing = fc hbearing (hsteel profile - 2 tflanges steel profile) [1.16]
The tension in the re-bars of the beam (3) is limited by the equation:
1.3. Seismic design of composite beam-to-column joint
This part concerns the design of beam-to-column node of moment resisting frames, without infills or without taking into account the possible effect of infills.
The main type of failures occurring at the joint location are a) panel shear failure and b) bearing failure for inner joint region, whereas the outer part of the joint deals with c) concrete shear and d) bond failure. The behaviour of the beam-to-column joint area is tied to the resistance mechanisms reacting to the forces stressing the area under consideration:
− Panel Zone Resistance: this is obtained from the sum of the column steel web panel resistance
(Vj,wps) and of the concrete compression strut resistance (Vj,ccs) generated between the continuity
plates (stiffeners) and the steel profile flanges. The web is considered to carry pure shear stress over an effective panel length ds, which is dependent on the location of the stiffeners in the
column or on the distribution of horizontal bearing stresses. The concrete compression strut is similar to the mechanism used to model shear in a reinforced concrete connection, in which the concrete compression strut could be mobilized in resisting the connection shear either due to the presence of the horizontal stiffener plates welded to the column or due to the friction and the flexural forces acting in the steel column flange.
(
)
(
)
j,wps ym,d,cw v cw s j,wps V =0,7 f⋅ ⋅min A ; t ⋅d + ∆V [1.18] j,ccs 1 cd cs V 0,85 f A sen 1,3 = ⋅ν ⋅ ⋅ ⋅ ⋅ θ [1.19]− Horizontal Bearing Resistance (Vj,hbf): this resistance is determined through a standard Stress
Block model similar to that used for flexural strength calculation in reinforced concrete members and depends on the confinement of the joint area;
ck,c j,ccs c cf c f 1 V 0,85 a b 1,3 ⎛ ⎞ = ⋅⎜ ⋅ ⎟⋅ ⋅ γ ⎝ ⎠ [1.20]
− Concrete Compression Field Resistance (Vj,ccf): the concrete compression field mechanism
consists of several compression struts that act with the horizontal reinforcement to form a truss mechanism. Shear is transferred horizontally from the beam into the compression field by the concrete bearing against the embedded steel column;
(
)
s,tie j,ccf c cd cs yd,w s tie c A 1 1 V min f b 0,9 d ; f 0,9 d cot 1,3 cot tan s ⎛ ⎞ ⎜ ⎟ = ⋅ α ⋅ν ⋅ ⋅ ⋅ ⋅ ⋅ ⋅ ⋅ ⋅ θ ⎜ θ + θ ⎟ ⎝ ⎠ [1.21]
− Bond Shear Resistance (Vj,bf): this resistance depends on the longitudinal rebars acting in friction
with concrete. The bond failure occurs if the compression and tension forces compatible with the moment equilibrium (along with the forces mobilised in the concrete compression field) are greater than the bond strength provided by one set of longitudinal reinforcing bars embedded in the outer most joint region.
j,ccs 1 bd b rb,c
V f x
1,3
= ⋅ ⋅φ ⋅ [1.22]
In Eurocode 8, the beam-to-column joints in moment frames are required to have a high enough moment resistance Mj,Rd in order to enhance the ductile capacity of the columns and to avoid the local
formation of plastic hinges in the column panel zone. Provided that, at the design stage, the plastic hinge formation in the beams is envisaged, it is necessary in any case to take into account the increase in the beam moment values in order to derive the design joint forces.
M
j,Rd> 1,3 (M
beam,Rd,right+ M
beam,Rd,left) [1.23]
Moreover, focusing the attention on the behaviour of an internal beam-to-column joint belonging to adefine the shear force acting in the joint, that depend obviously on the bending moments acting at the left and at the right of the joint.
Considering that the gravitational loads reduce the effects of the seismic action in terms of bending moment acting at the joint and that the column shear reduces the total joint shear action at the beam-to-column joint position and thus increases the shear joint strength. In accordance with these assumptions, and by considering the mechanism mentioned above, in seismic conditions, for an internal beam-to column composite joint it is to check that:
, , ≥ , =0,8⋅
∑
Rd beam − , , j Rd j Sd col wp u s M V V V d [1.24]2. DESIGN REPORT ON DISSIPATIVE CONNECTIONS
2.1. Description of the INERD connections
Innovative dissipative (INERD) connections are used in seismic resistant braced steel frames for the connection of the braces to the adjacent members (columns or beams). Two types of INERD connections were developed:
a) Pin connections
The pin connections consist of two external eye-bars welded or bolted to the adjacent member (column or beam), two internal eye-bars welded to the brace and a pin running through the eye-bars (Figure 2.1). In this type of connection the pin exhibits inelastic bending deformations and dissipates energy due to the fact that the eye-bars are placed at some distance between each other.
b) U-connections
The U-connections consist of one or two bent, U-shaped thick plates that connect the brace to the adjacent member (Figure 2.2). Here again, energy dissipation takes place in the bent plate(s).
The advantage of these connections is that, by appropriate sizing, inelastic deformations are limited within exactly predetermined zones, the pins or the U-plates, whereas the adjacent parts remain elastic. Consequently, braces are protected from buckling and damage is restricted in the pins or the U-plates. These are small parts that may be easily replaced if they are largely deformed, after an unusually strong earthquake.
Figure 2.2 : INERD U-connections
2.2. Benefits of braced frames with INERD connections
Seismic resistant steel structures are designed for stiffness, strength and ductility. Stiffness requirements are imposed in order to limit non-structural damage in case of minor to moderate earthquakes and limit instability effects, strength in order to ensure the capacity of the structure to resist safely the action effects and ductility in order to dissipate part of the seismic input energy through inelastic deformations and therefore reduce the action effects. Conventional frames, both unbraced and braced, have certain disadvantages in respect to the above design criteria (Table 2.1, columns 2 to 4). In addition, braced frames that are widely applied in Europe, face following problems after unusually strong earthquakes that result in some degree of damage: a) the need for strengthening or replacement of damaged and buckled braces which have a certain length and are difficult to handle, b) the need for strengthening and repair of the links or the beams that are part of the main system that supports gravity loading. Such works require therefore considerable skill and are associated with high material and labour costs.
Table 2.1: Structural typologies and main characteristics for Steel Frames
1 2 3 4 5 Moment resisting Frames (MRF) Concentric Braced Frames (CBF) Eccentric Braced Frames (EBF) CBF or EBF with dissipative INERD-connections
Stiffness Low High Moderate High Ductility High Low Moderate High
Strength As required As required As required As required Dissipative
zones at
Braced frames with INERD-connections exhibit following benefits compared to conventional steel frames:
a) Better compliance with the seismic design criteria (Table 2.1, column 5). b) Protection of compression braces against buckling.
c) Activation of all braces, either in compression or in tension, even at large storey drifts. d) Limitation of inelastic action in small parts that may be easily replaced.
e) Possibility for easy inexpensive repair after very strong earthquakes, if required. f) Reduction of overall structural costs for the same performance level.
2.3. Mechanical characteristics of pin INERD connections
The mechanical characteristics of pin INERD connections may be described by their force-deflection-curves. These curves may be approximated by a tri-linear curve with two characteristic points (yield and ultimate). The relevant values, as well as the deformation capacity of the connection, are given in Table 2.2.
Due to further analysis of the research data, this table is slightly different from the table presented in the research report.
Table 2.2. Design formulae for the connection with 2 internal plates
Eye-bars in Force Displacement
Point I
“yielding y” Compression
(
a
/
1
,
1
)
M
2
P
y,Rk p⋅
=
δ
α
(
3
4
α
)
6
I
E
M
5
,
1
p 2 y=
⋅
⋅
⋅
l
⋅
⋅
−
Point II“ultimate u” Compression
(
a
/
1
,
1
)
M
4
P
u,Rk=
⋅
p δII =0,2⋅aPoints I and II Tension 90% of the above values for Py
and Pu
Over-strength for capacity design
checks 30% beyond Pu Deformation capacity Ι P ΙΙ δ a 8 , 0 lim = ⋅ δ y pl p
W
f
M
=
⋅
α =a ll = pin length (axial distance between external eye-bars) a = clear distance between internal and external eye-bars fy = yield stress of pin
Wpl = plastic modulus of pin cross section
I = moment of inertia of pin cross section E = elastic modulus of pin ‘s material
a a l text text h tint tint
b For rectangular pins, Wpl =
bh²/4 and I = bh³/12
h = pin height, b = pin width Py
Pu
δy δII δlim δ
2.4. Code rules for braced frames with pin INERD-connections
Βraced frames with pin INERD-connections may be designed according to the general rules of Eurocode 8, duly modified in order to consider that energy dissipation is taking place in the pin connections and not in the tension braces. Table 2.3 gives the original EC 8 rules for concentric braced frames and the proposed modified rules of such frames with pin INERD connections.
Table 2.3. Code formulation for concentric braced frames with pin INERD connections
Paragraph Original Code text Modified text 6.7.1
Design criteria
(1)P Concentric braced frames shall be designed so that yielding of the diagonals in tension will take place before failure of the connections and before yielding or buckling of the beams or columns.
(1) P Concentric braced frames with pin INERD connections shall be designed so that:
(a) yielding of the pins will take place before compression failure of the diagonals and before yielding or buckling of the beams or columns.
(b) failure of the connections precedes buckling failure of the diagonals (c) yielding of the pins is limited at the damage limitation state
(d) the other connection elements shall be designed with adequate overstrength relevant to the pins.
(2)P The diagonal elements of bracings shall be placed in such a way that the structure exhibits similar load deflection characteristics at each storey in opposite senses of the same braced direction under load reversals.
(2)P The diagonal elements of bracings and their connections shall be placed in such a way that the structure exhibits similar load deflection characteristics at each storey in opposite senses of the same braced direction under load reversals.
6.7.2 Analysis
(2)P The diagonals shall be taken into account as follows in an elastic analysis of the structure for the seismic action: − in frames with diagonal bracings,
only the tension diagonals shall be taken into account;
(3) ……
(2)P The diagonals shall be taken into account as follows in an elastic analysis of the structure for the seismic action:
− in frames with diagonal bracings, both the tension and compression diagonals shall be taken into account;
(3) Does not apply 6.7.3
Diagonal members
(1) to (9) (1) to (9) Do not apply, except (8)
6.7.4 Beams and columns
(1) … (1) as in the original text, with:
Ω is the minimum value of Ωi =
Pu,Rd,i/NEd,i over all the connections of the
diagonals of the braced frame system; where
Pu,Rd,I is the ultimate strength of the pin
2.5. Practical design procedure and design example
For practical applications, the following design steps are recommended:
1. Selection of the pin dimensions, according to the following requirements:
a.
2
cos
H
D
a
8
,
0
limϕ
⋅
⋅
≥
=
δ
[2.1] b. E,ser ser Rk , y Rd , yN
P
P
≥
γ
=
Μ [2.2] c. Ed 0 Rk , u Rd , uN
P
P
≥
γ
=
Μ [2.3] where:δlim = deformation capacity of the pin connection (see Table 2.2.)
a = clear distance between internal and external eye-bars D = lateral drift ratio
H = storey height
φ = angle of inclination of the diagonal
Py,Rk , Pu,Rk yield and ultimate strength of the connection according to Table 2.2.
γΜ0 partial safety factor of resistance (=1,0)
γΜser partial safety factor of resistance (=1,0)
NEd design force of the diagonal
NE,ser = ν
Ed
N
design force of the diagonal at the damage limitation state
ν reduction factor which takes into account the lower return period of the seismic action associated with the damage limitation requirement.
2. Verification of the brace dimensions
b,Rd
u,Rk
N
P
≤
[2.4]where:
Nb,Rd buckling resistance of the diagonal
3. Dimensioning of eye-bars, welds etc
All connection elements (eye-bars, bolts, welds etc.) shall be verified for the capacity design force, equal to:
PEd = 1,3 Pu,Rk [2.5]
The thicknesses of the eye bars shall additionally verify the following requirements:
text ≥ 0,75 h [2.6]
a ≥ h [2.8] With h = pin height,
text = thickness of external eye bars,
tint = thickness of internal eye bars
a = clear distance between external and internal eye-bars
Steel quality of the eye-bars has to be equal to or higher than that of the pin.
2.6. Design example
The lateral stability of a three storey steel building is provided by X-braces (Figure 2.3). For the first storey, the columns sections are HEB 320, S 355 and the brace sections HEB 180, S 355. The pin INERD connections between braces and columns for the first storey shall be designed. The analysis design force for the seismic combination is equal to NEd = 850 kN
.
Figure 2.3 : Design example
Step 1. Verification of the pin
The pin dimensions are 65 x 75 mm, S 235. The clear distance between external and internal eye-bars is equal to a = 87 mm.
NE,ser =
5
,
2
870
= 348 kNFrom Table 2.2, it is:
=
⋅
=
4
5
,
6
5
,
7
W
2 pl 79,2 cm35
,
23
2
,
79
⋅
=
pM
= 1861 kNcm → Py,Rk =)
1
,
1
/
7
,
8
(
1861
2
⋅
= 470 kN → Pu,Rk =)
1
,
1
/
7
,
8
(
1861
4
⋅
= 941 kN eq. [2.2]:=
=
470
kN
>
0
,
1
470
P
y,Rd NE,ser = 348 kN eq. [2.3]:=
=
941
kN
>
0
,
1
941
P
u,Rd NEd = 850 kNStep 2. Verification of the brace dimensions
For the brace, it is Nb,Rd =
χ
z⋅
A
⋅
f
y/
γ
Μ1=
0
,
43
⋅
65
,
3
⋅
35
,
5
/
1
,
1
=
997 kNNt,Rd =
A
⋅
f
y/
γ
Μ1=
65
,
3
⋅
35
,
5
/
1
,
1
=
2.107 kNeq. [2.4]
P
u,Rd=
941
kN
<
N
b,Rd = 997 kNStep 3. Dimensioning of eye-bars, welds etc
All connection elements (eye-bars, bolts, welds etc.) shall be verified for the capacity design force: eq. [2.5] PEd =
1
,
3
⋅
941
= 1223 kNThe design criteria for eye-bars are as following:
• Net section failure
P
Ed≤
N
t,net,Rd• Gross section yielding
P
Ed≤
N
t,,Rd• Bearing failure
P
Ed≤
F
b,RdThe design criteria for bolts (connection of eye-bars to column flanges) are as following:
• Bearing failure
P
Ed≤
F
b,Rd• Shear failure
P
Ed≤
F
v,RdThe design criteria for welds (connection of eye-bars to braces) are as following:
2.7. Design proposal for fatigue.
These design suggestions are based on the experimental tests performed in two types of dissipative devices at Instituto Superior Técnico.
In order to allow the development of possible code provisions these designers guide are made in terms of fatigue curves like the ones shown in EC3.
Fatigue Pin Comparisons
Fatigue behaviour of circular Pin is better than rectangular Pin independently of distance of plates. Fatigue behaviour of circular Pin increases with decreasing of distance of plates.
EC 3 EC3 - 160 EC3 - 140 EC3 - 125 EC3 - 112 EC3 - 100 EC3 - 90 EC3 - 80 EC3 - 71 EC3 - 63 EC3 - 56 EC3 - 50 EC3 - 45 EC3 - 40 EC3 - 36 3.00 3.25 3.50 3.75 4.00 4.25 4.50 0.00 0.25 0.50 0.75 1.00 1.25 1.50 1.75 2.00 Log ( N ) Log ( S ) pin c50 pin r50
Figure 2.4 . Fatigue behaviour of Pin c50 (circular pin whit distance of plates of 50mm) and Pin r50 (rectangular pin whit distance of plates of 50mm)
EC 3 EC3 - 160 EC3 - 140 EC3 - 125 EC3 - 112 EC3 - 100 EC3 - 90 EC3 - 80 EC3 - 71 EC3 - 63 EC3 - 56 EC3 - 50 EC3 - 45 EC3 - 40 EC3 - 36 3.00 3.25 3.50 3.75 4.00 4.25 4.50 0.00 0.25 0.50 0.75 1.00 1.25 1.50 1.75 2.00 Log ( N ) Log ( S ) pin c50 pin c70
Figure 2.5. Fatigue behaviour of Pin c50 (circular pin with distance of plates of 50mm) and Pin c70 (circular pin with distance of plates of 70mm)
Fatigue U-Devices Comparisons
Fatigue behaviour of U-Devices loaded parallel (mola8) is better when compared with those loaded perpendicular (mola 10).
Relative to U-Devices loaded parallel:
1. Fatigue behaviour of U-Devices is better when the angle (α) is different of 45º
2.
Fatigue behaviour of U-Devices increases partially with decreasing of thickness(e)
3. Fatigue behaviour of U-Devices increases partially with increasing of radius (R)
EC 3 EC3 - 160 EC3 - 140 EC3 - 125 EC3 - 112 EC3 - 100 EC3 - 90 EC3 - 80 EC3 - 71 EC3 - 63 EC3 - 56 EC3 - 50 EC3 - 45 EC3 - 40 EC3 - 36 3.00 3.25 3.50 3.75 4.00 4.25 4.50 0.00 0.25 0.50 0.75 1.00 1.25 1.50 1.75 2.00 Log ( N ) Log ( S ) mola8 mola10
Figure 2.6. Fatigue behaviour of U-Devices loaded parallel (mola8) and perpendicular (mola 10).
EC 3 EC3 - 160 EC3 - 140 EC3 - 125 EC3 - 112 EC3 - 100 EC3 - 90 EC3 - 80 EC3 - 71 EC3 - 63 EC3 - 56 EC3 - 50 EC3 - 45 EC3 - 40 EC3 - 36 3.00 3.25 3.50 3.75 4.00 4.25 4.50 0.00 0.25 0.50 0.75 1.00 1.25 1.50 1.75 2.00 Log ( N ) Log ( S ) mola2 mola3
EC 3 EC3 - 160 EC3 - 140 EC3 - 125 EC3 - 112 EC3 - 100 EC3 - 90 EC3 - 80 EC3 - 71 EC3 - 63 EC3 - 56 EC3 - 50 EC3 - 45 EC3 - 40 EC3 - 36 3.00 3.25 3.50 3.75 4.00 4.25 4.50 0.00 0.25 0.50 0.75 1.00 1.25 1.50 1.75 2.00 Log ( N ) Log ( S ) mola3 mola4
Figure 2.8 . Fatigue behaviour of U-Devices mola3 ( thickness e=25mm) and mola4 (e=30mm)
EC 3 EC3 - 160 EC3 - 140 EC3 - 125 EC3 - 112 EC3 - 100 EC3 - 90 EC3 - 80 EC3 - 71 EC3 - 63 EC3 - 56 EC3 - 50 EC3 - 45 EC3 - 40 EC3 - 36 3.00 3.25 3.50 3.75 4.00 4.25 4.50 0.00 0.25 0.50 0.75 1.00 1.25 1.50 1.75 2.00 Log ( N ) Log ( S ) mola4 mola5
Description of EC3
3. RESEARCH REPORT ON DISSIPATIVE COMPOSITE COLUMNS
FOR MITIGATION OF SOFT STOREY FAILURES IN REINFORCED
CONCRETE COLUMNS.
3.1 Definition of the problem and proposal for a solution.
The most frequent failure mode of reinforced concrete (R.C.) buildings is the so called “soft storey” mechanism. It consists in a localisation of buildings’ seismic deformations and rupture in the bottom storey of the building (see Fig.3-1).
after earthquake
plastic hinges soft storey
Figure 3-1: The soft storey mechanism for which composite columns would be of interest.
This phenomenon is basically caused by the fact that the overall shear force applied to the building by an earthquake is higher at the base and by the following factors:
– geometric irregularities and discontinuities in plan and section;
– wide openings in lower storeys which are not present at upper levels and weaken the structure - ground level is often used for offices, shops, lobby in hotels, etc;
– slender columns at ground level – so called “pilotis” type buildings;
– if the lower storey is not originally weakened, it is however there that infills are the most stressed, so that they fail first and create then the openings at ground level;
– the sequence of concreting generally results in an interface between two different concrete in the top section of the column, which is then a section weaker than computed;
The “soft storey” mechanism induces very localised deformations to which correspond local brittle mechanisms: bending combined with compression resulting in the crushing of concrete, or shear due to alternate inclined cracks resulting in the decohesion of the section.
The proposed innovation for the problem of soft storey consists in encasing steel profiles (HE or UC) in the lowest levels of reinforced concrete (R.C.) columns in order to provide them a basic reliable shear and compression resistance. The idea is to use encased steel section as a ductile fuse able to dissipate cyclically the energy of the earthquake in the columns of the lower storey of the buildings which otherwise remain reinforced concrete buildings. The objective is to ensure a minimum structural reliability especially in the possible tricky circumstances of either a bad concrete mix utilisation or an awkward concrete hardening process.
Because the position of the infills in a real structure is not always well known or the infills are not always as effective as it is assumed in the design, the study bear on
- composite column in a configuration without infills in which the sheared panel of the composite column is a crucial weak point, which is studied in the University of Trento.
3.2. Research approach. Design requirements for the encased steel profile.
The R.C. reference building chosen in order to study the problem corresponds to a 6 storeys office building resisting as a pure moment frame, without concrete core. The soft storey situation comes, like in real life situation, from the fact that infills placed in the structure from 1st storey to top prevent the
effective work as moment resisting frame, so that all deformations are concentrated in columns at ground level (see Fig. 3-1).
The design was made according to Eurocode 2 (EC2) [prEN1992], Eurocode 4 (EC4) [prEN1994] and Eurocode 8 (EC8) [prEN1998-1 (2001)] and sections of concrete and steel reinforcements were established corresponding to 3 reference design situations of the R.C. sections:
– Static design: EC2 (gravity loading only), earthquake not considered;
– Low ductility design (“DCL”): EC2 + EC8 considering earthquake with PGA 0,2g (low seismicity), low ductility class building (q=1,5);
– Medium ductility design (“DCM”): EC2 + EC8 considering earthquake with PGA 0,2g (low seismicity), medium ductility class building (q=3,9);
In the concept of the proposal, the steel profiles are "safety belts": if circumstances are such that a soft storey mechanism would form under earthquake action, the plastic hinges in the R.C. column at ground level would not provide much ductility; then the steel profile would come into action.
To achieve this goal, it is necessary to satisfy some simple criteria to design the steel profiles:
• to determine a steel cross section with a low Asteel/Atotal ratio: the steel profiles are inserted in
some critical and limited regions, e.g. the joint regions with a quite high quantity of horizontal, vertical and transversal reinforcing bars. That is, the impact of the steel profile cross sectional area on the overall transverse section has to be minimised.
• to maintain axial strength, (plastic) moment resistance, and stiffness similar to those of the RC column at the ultimate stage when concrete is locally crushed.
• to provide ductility.
Hence, more detailed design criteria have been defined allowing the achievement of the mentioned requirements:
V. The steel section alone should at least be able to take the design axial force of the seismic loading case:
N
Rd> N
Sd(γ
g.G + γ
q.Q)
[3-1]
whit γg = 1 and γq = 0,3
Equation 3-1 should entail the erection of composite columns which resist the dead load of the structure under severe seismic load conditions providing enough residual stiffness to minimise the risk of collapse.
VI. The steel section alone (not acting composedly) should be able to substitute the deficient concrete section due to the bending moment and shear actions at collapse:
M
Rd,steel> M
Rd,concrete[3-2]
V
Rd,steel> V
Rd,concrete[3-3]
The criteria defined in I and II provide a beneficial residual strength after the concrete crushing with a gain in the ductile behaviour too.
VII. The steel sections should not much modify the local stiffness EI of the single RC column (maximum modification level in the order of 10%) in order not to change the distribution of stiffness in the entire and original RC structure. In fact, a change in stiffness distribution may also signify a variation of the building periods of vibration closely tied to the inertial forces, e.g. seismic forces.
VIII. The following ratio should be close to unity in order to achieve a suitable performance of the steel profile along major and minor axis bending:
Rd,comp Rd,concrete major major Rd,comp minor Rd,concrete minor M M r = M r M ⎛ ⎞ ⎜ ⎟ ⎝ ⎠ ⎛ ⎞ ⎜ ⎟ ⎝ ⎠
[3-4]
The computed sections were too large to be tested in laboratory and were scaled down. The test sections are shown on Fig. 3-2.
Figure 3-2 : Reduced sections for the composite columns to be tested
The idea developed in the project is to insert steel profiles in columns at ground level. It raises the problem of how to realize the details of the anchorage and how far to extend the anchorage of these steel profiles into the concrete structure of the 1st storey and of the ground level. Basically 3 designs (C1-C2-C3) were considered (see Fig.3-3):
- in Liege, - anchorage limited within the depth of the 1st storey beams – C2 (400mm).
- anchorage expanded up to mid height of the 1st storey level columns – C1.
- in Trento, - typology in which the steel profile extends from the base up to mid height of the 1st
storey level columns – C1.
- typology in which a steel stump covers only the critical joint region – C3.
In order to ensure that the axial load transfer between the concrete and the steel is efficient in the critical region of the composite column, an endplate is welded at the end of the steel profile (see Fig. 3-4). No shear connectors were used in the load introduction area and in areas with change of the cross section, both to realize an easier solution and to minimize the cost for the fabrication of the specimens.
Moreover specimens with and without the presence of stiffeners delimiting a clear shear panel zone were tested (see Fig.3-4) to study their influence both on the global behaviour of the joint and on the actions transmitted from the concrete column to the inserted steel profile.
a)
b)
c)
Figure 3-3. : Geometrical characteristics of the anchorage and length of steel profiles in the Liege and Trento tests specimens
≤ ≤
≤
Figure 3-4 : Geometrical characteristics of the end plate and stiffeners
Both situations of weak axis and strong axis of the steel profile are considered
All composite tests can be compared to reference reinforced concrete R.C. situations; practically this means that a total of 10 tests on 38 tests are indeed reference R.C. tests; this is a price to pay to assess properly the positive influence of the composite character of components.
Many other parameters may influence the behaviour of the tested composite columns : beam depth / columns depth ratio, material properties, connection design details, value of axial force NSd coupled to
applied bending moment, etc …and the original test programme has been modified several times following the progressive developments of analysis.
The final test program may be summarised into 2 tables. Long anchorage C1
Short anchorage C2
Endplate Stiffeners
Table 3-1. Characteristics of the specimens of the Liege experimental programme
COMPOSITE
long anchorage (C1) short anchorage (C2) phase Design Strong/weak
axis section R.C. with stiffeners without stiffeners with stiffeners without stiffeners PHASE 1 Static strong axis RCL1 COL1 COL2 COL3 COL4
PHASE 2 DCL* strong axis RCL3 COL5 COL6 COL7 COL8
PHASE 3 DCM** strong axis RCL5 COL9 COL10 COL11 COL12
Static weak axis RCL2 COL13
PHASE 4
DCL* weak axis RCL4 COL14
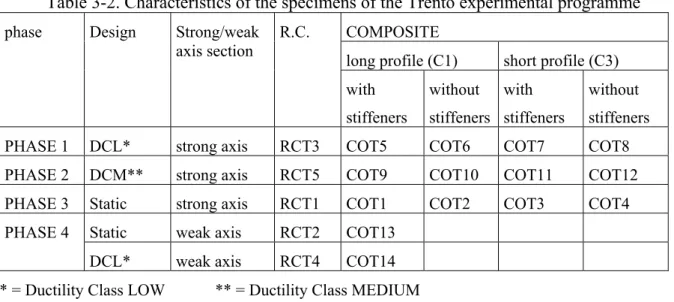
Table 3-2. Characteristics of the specimens of the Trento experimental programme
COMPOSITE
long profile (C1) short profile (C3) phase Design Strong/weak
axis section R.C. with stiffeners without stiffeners with stiffeners without stiffeners
PHASE 1 DCL* strong axis RCT3 COT5 COT6 COT7 COT8
PHASE 2 DCM** strong axis RCT5 COT9 COT10 COT11 COT12 PHASE 3 Static strong axis RCT1 COT1 COT2 COT3 COT4
Static weak axis RCT2 COT13
PHASE 4
DCL* weak axis RCT4 COT14
* = Ductility Class LOW ** = Ductility Class MEDIUM
A set of 128 A4 drawings presenting all details of test set up, steel components, reinforced concrete elements, composite steel concrete elements has been produced for the fabrication of the specimens.
3.3. Test set up and testing procedure.
Slightly different test set up have been designed for the University of Trento and the University of Liège, due to differences in infrastructures and due to the two different aims of the tests:
-the test set up at Trento is designed to test "strong beams-weak columns" situations in order to provide data necessary for the understanding of the behaviour of the composite "panel zone" (beam-column intersection zone).
-the test set up in Liège aims at reproducing a "weak beam-strong columns" situation, necessary to create more difficult situation of anchorage of the encased steel profile ; the effect of infills is simulated by presence of two stiffened steel plate (in yellow at Figure 3-5).
Both test set up allow the application of a constant axial force in the column up to 1000 kN together with the application of a horizontal variable force up to 1000 kN (positive and negative) with a displacement range up to 2000 mm (+-). Drawings are presented hereafter.
Figure
3-
5. Test configuration adopted at the University of Liege (masonry “infills” are in yellow).Figure 3-6.: Test configuration adopted at the University of Trento (no masonry infills).
The choice of a testing programme and the associated loading history depends on the purpose of the experiment, type of specimen and expected failure mode. The ECCS Procedure[1986] has been chosen, indeed, to verify the relationship between a pseudo-static horizontal force and a specified ductility factor given by Codes and Recommendations (ECCS Recommendations for Steel Structures in Seismic Areas).
In the present studies, a vertical constant load N is applied to the column before starting the cyclic application of horizontal loads. A horizontal load is applied to the column at a distance representing the mid height of the storey (1750mm from the beam axis). This load is displacement controlled and applied cyclically in positive and negative value by a 1000 kN actuator. The loading history follows the ECCS Procedure (1986) with a reference "yield displacement" δy value determined as an absolute value
columns, it has been estimated that the interstorey drift angle θy at yield is 0,5% = 5 mrad. The drift
angle in the test set-up is the displacement at the actuator divided by the height of column which is free to deform, so that, in Trento: δy = θy x 3500 =17,5 mm and in Liege: δy = θy x 1750 =8,75 mm is the
yield displacement at the actuator. Then the plastic cycles are applied as defined in the ECCS Procedure - 3 cycles at intervals +/-(2+2n) δy with n=0,1,2,3,…, etc.
3.4. Plastic hinges in columns as dissipative mechanism.
3.4.1. Specific features of the test set up.
total structure substructuretested position in the test setup
Figure 3-7.: Link between the reference structure and the local substructure to be tested.
The test set-up corresponds to a subassemblage zone of a real structure. The link between the real structure and the test set-up is shown on Fig. 3-7. The infills in the test set-up are represented by rigid steel stiffened plates (see Fig.
3-
5 and3-
8).The applied vertical load N corresponds to a compression rate of 0.17 NRd R.C., NRd R.C. being computed
referring to the R.C. section alone and the real properties of the materials.
play between 5 and 10 mm 400 1540 Infill representation by steel plates 100 400 100 400 N 350 A A V 1 LC-217 0 2 foundation 3 LC-3 D-1 LC-1 N’ 3 Sequence of loading: 1 vertical contact plates 2 axial force application 3 horizontal contact plates Global instrumentation: Load Cells LC-1, 2, 3 Displacement transducer D-1
Figure 3- 8 : Addition of plates in the test set-up to ensure the contact and global instrumentation
The chosen test configuration intends to reproduce as accurately as possible the boundary conditions of a column in a soft storey. Nonetheless it has the drawback that the determination of the action effects in the beam and in the portion of the column between the infills cannot be directly deduced from external load. A specific load cell LC-2 is needed to determine the axial load N’ in the column and to deduce the
vertical forces induced by vertical loads. If they do, it is accidental and due to problems of excessive deformations of the beams. To ensure that the infills do not transmit vertical loads in the test set-up, a “play” ensuring no contact has been provided between beams and infills during vertical loading (see Fig.
3-
8). Horizontal contact plates have been placed after the application of the axial load.3.4.2. Global behaviour of the tests specimens.
The failure modes of the composite columns of the strong axis phases are shown in Fig.
3-
9.
(a) Static design (b) DCL (c) DCM
plastic hinge no hinge - shear failure plastic hinge - shear failure Figure3-9: Failure of the composite columns
All the tests results are not graphically presented here. Only some significant moment-rotation (M-θ) diagrams are given hereafter (see Fig.
3-
10 to3-
14). The (M-θ) envelope curves are traced on Fig.3-
15 to3-
19 and allow the direct comparison between specimens.M and θ are defined as follows:
- M is the bending moment in the section which should yield first – section A-A on Fig.8.
M = V(measured at LC-1).1,5 m [3-5]
- θ is the global rotation: θ = D1/1,5 m [3-6]
The moment should also include a parasitical moment due to the system used to apply the axial force to the column. This additional moment is proportional to the horizontal top displacement. This means that it does not influence very much the maximal moment which corresponds to relatively small top displacement (moment increase of maximum 4 % when N is equal to 1000 kN). Its influence is greater on the degradation part of the curve. It has not been taken into account in this analysis and does not modify the conclusions.
The moment-rotation curve of the reference R.C. specimen RCL1 of Phase 1 is presented on Fig.
3-10(a). The maximum resistance is obtained for θy = 21 mrad, followed immediately by a sharp
resistance decrease. The conventional failure (resistance reduced to 80% of maximum resistance) of the specimen is reached for θ80% = 40 mrad. The ductility is θ80%/ θy=1,9. It may be estimated that the total
loss of resistance corresponds to θ around 60 mrad.
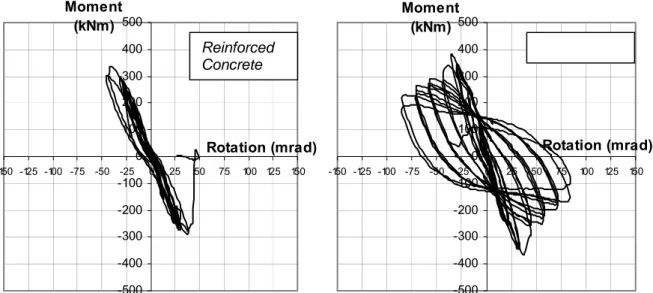
The cyclic moment-rotation curve of the composite specimen COL2 is presented on Fig.
3-
10(b). The maximum resistance is obtained for θy = 25 mrad, followed by a rather ductile behaviour up to θ80% =67 mrad, which is approximately the rotation corresponding to conventional failure. The ductility θ80%/ θy=2,7. The maximum resistance is higher than the one of the reference R.C. specimen by a factor
of 1,4 approximately. It may be estimated that the total loss of resistance corresponds to θ around 100 mrad. That is 66% more than the reference R.C. specimen.
-300 -250 -200 -150 -100 -50 0 50 100 150 200 250 300 -150 -125 -100 -75 -50 -25 0 25 50 75 100 125 150 Rotation (mrad) Moment (kNm) -300 -250 -200 -150 -100 -50 0 50 100 150 200 250 300 -150 -125 -100 -75 -50 -25 0 25 50 75 100 125 150 Rotation (mrad) Moment (kNm)
Figure 3-10 : Moment-Rotation curves for specimens RCL1 and COL2 (static design – strong axis)
-500 -400 -300 -200 -100 0 100 200 300 400 500 -150 -125 -100 -75 -50 -25 0 25 50 75 100 125 150 Rotation (mrad) Moment (kNm) -500 -400 -300 -200 -100 0 100 200 300 400 500 -150 -125 -100 -75 -50 -25 0 25 50 75 100 125 150 Rotation (mrad) Moment (kNm)
Figure 3-11: Moment-Rotation curves for specimens RCL3 and COL6 (low ductility design)
Reinforced Concrete
Reinforced Concrete
-300 -250 -200 -150 -100 -50 0 50 100 150 200 250 300 -150 -125 -100 -75 -50 -25 0 25 50 75 100 125 150 Rotation (mrad) Moment (kNm) -300 -250 -200 -150 -100 -50 0 50 100 150 200 250 300 -150 -125 -100 -75 -50 -25 0 25 50 75 100 125 150 Rotation (mrad) Moment (kNm)
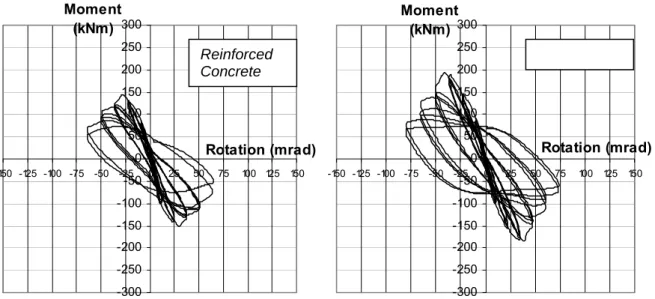
Figure 3-12 : Moment-Rotation curves for specimens RCL5 and COL10 (medium ductility design)
-300 -250 -200 -150 -100 -50 0 50 100 150 200 250 300 -150 -125 -100 -75 -50 -25 0 25 50 75 100 125 150 Rotation (mrad) Moment (kNm) -300 -250 -200 -150 -100 -50 0 50 100 150 200 250 300 -150 -125 -100 -75 -50 -25 0 25 50 75 100 125 150 Rotation (mrad) Moment (kNm)
Figure 3-13 : Moment-Rotation curves for specimens RCL2 and COL13 (static design- weak axis)
Reinforced Concrete
Reinforced Concrete
-300 -250 -200 -150 -100 -50 0 50 100 150 200 250 300 -150 -125 -100 -75 -50 -25 0 25 50 75 100 125 150 Rotation (mrad) Moment (kNm) -300 -250 -200 -150 -100 -50 0 50 100 150 200 250 300 -150 -125 -100 -75 -50 -25 0 25 50 75 100 125 150 Rotation (mrad) Moment (kNm)
Figure 3-14: Moment-Rotation curves for specimens RCL4 and COL14 (low ductility design – weak axis)
-300 -250 -200 -150 -100 -50 0 50 100 150 200 250 300 -150 -125 -100 -75 -50 -25 0 25 50 75 100 125 150 Rotation (mrad) Moment (kNm) RCL1 COL1 COL2 COL3 COL4
Figure 3-15: Envelope curves for all the specimens of phase 1.
-500 -400 -300 -200 -100 0 100 200 300 400 500 -150 -125 -100 -75 -50 -25 0 25 50 75 100 125 150 Rotation (mrad) Moment (kNm) RCL3 COL5 COL6 COL7 COL8
Figure 3-16: Envelope curves for all the specimens of phase 2.
Reinforced Concrete
-300 -250 -200 -150 -100 -50 0 50 100 150 200 250 300 -150 -125 -100 -75 -50 -25 0 25 50 75 100 125 150 Rotation (mrad) Moment (kNm) RCL5 COL9 COL10 COL11 COL12
Figure 3-17 : Envelope curves for all the specimens of phase 3.
-300 -250 -200 -150 -100 -50 0 50 100 150 200 250 300 -150 -125 -100 -75 -50 -25 0 25 50 75 100 125 150 Rotation (mrad) Moment (kNm) RCL2 COL13
Figure 3-18: Envelope curves for some specimens of phase 4 (static design).
-300 -250 -200 -150 -100 -50 0 50 100 150 200 250 300 -150 -125 -100 -75 -50 -25 0 25 50 75 100 125 150 Rotation (mrad) Moment (kNm) RCL4 COL14
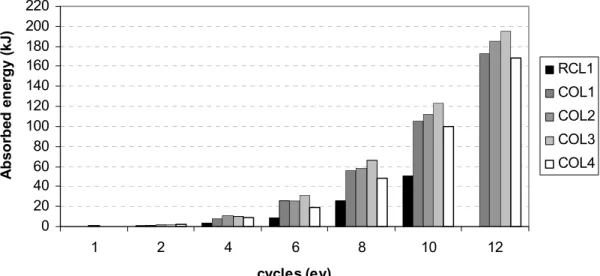
0 20 40 60 80 100 120 140 160 180 200 220 1 2 4 6 8 10 12 cycles (ey) A b so rb ed e n er g y (kJ ) RCL1 COL1 COL2 COL3 COL4
Figure 3-20 : Absorbed energy in function of the cycles for all the specimens of phase 1
.
0 20 40 60 80 100 120 140 160 180 200 220 1 2 4 6 8 8 10 12 cycles (ey) A b so rb ed en er g y ( kJ) RCL3 COL5 COL6 COL7 COL8
Figure 3-21 : Absorbed energy in function of the cycles for all the specimens of phase 2.
0 20 40 60 80 100 120 140 160 180 200 220 1 2 4 6 8 10 12 cycles (ey) A b so rb ed en er g y (kJ ) RCL5 COL10 COL11 COL12
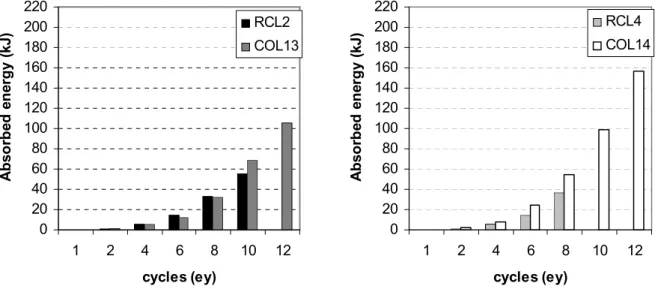
0 20 40 60 80 100 120 140 160 180 200 220 1 2 4 6 8 10 12 cycles (ey) A b so rb ed en er g y (k J) RCL2 COL13 0 20 40 60 80 100 120 140 160 180 200 220 1 2 4 6 8 10 12 cycles (ey) A b so rb ed en er g y (k J) RCL4 COL14
Figure 3-23: Absorbed energy in function of the cycles for all the specimens of phase 4.
Table 3-3 provides comparison data between the test specimens of all the phases. The parameters in the table are defined as follows:
- δy (mm): yield displacement defined as in ATC24 procedure (ATC, 1992). Fig.
3-
24 presentsthe calculation of the yield displacement δy (mm) in function of the horizontal force applied V
(Vmax is the maximum horizontal force reached).
V
δ
V
maxV
max 0.75δ δ
y Measure: deformation δ at V=0.75Vmax max Calculate: deformation δknowing V and 0.75Vy max
Figure 3-24: Assessment of the experimental yield displacement δy
- θy is the rotation (mrad) at yield obtained by geometrical consideration
θy(mrad)=δy(mm).1000/1500(mm)
– θ80% is the rotation (mrad) at which the specimen has lost 20% of its resistance ;
– θ50% is the rotation (mrad) at which the specimen has lost 50% of its resistance ;
– Mpl,exp is the plastic moment of the column obtained experimentally ;
– Mpl,th is the plastic moment of the column obtained from calculations ;
– θcomp is the rotation (mrad) of the composite specimen corresponding to the maximum moment
reached by the R.C. specimen of the same phase;
– θR.C. is the rotation (mrad) of the R.C. specimen corresponding to maximum moment reached
M θ Mmax comp. Mmax R.C. θcomp. envelope curve comp. specimen envelope curve R.C. specimen R.C. θ
Figure 3-25. Rotation θR.C. and θcomp.
– Etotal,50%resist is the energy dissipated until the specimen has lost 50% of its resistance. It is
calculated as the hysteretic area of the force (measured at LC-1) - displacement (measured at D-1) diagram.
– cycles50%resist. nf is the number of cycles to failure
Table 3-3. Comparison between experimental and computed results.
Specimen θy θ80% θ50% Mpl,exp. Mpl,th. θcomp./θR.C. θ80%/θy Etotal,50%resist. cycles50%resist.
(mrad) (mrad) (mrad) (kNm) (kNm) (ductility ratio) (ductility) (kJ) (nf)
RCL1 21 40 51 180 175 1.0 1.9 40 18 COL1 20 51 70 240 235 2.0 2.6 137 24 COL2 25 67 81 255 245 2.4 2.7 149 24 COL3 23 54 77 249 235 2.4 2.3 - 23 COL4 25 68 83 240 245 2.5 2.7 134 23 RCL5 22 48 61 216 195 1.0 2.2 55 18 COL9 18 68 71 231 250 1.8 3.8 - 21 COL10 26 59 73 276 260 1.9 2.3 174 23 COL11 29 56 70 290 250 1.8 1.9 124 22 COL12 22 58 70 272 260 1.9 2.6 138 22 RCL3 30 technical problem 335 285 1.0 - 38 16 COL5 35 43 85 400 415 1.0 1.2 258 25 COL6 31 43 83 385 415 1.0 1.4 269 24 COL7 31 43 100 411 415 1.0 1.4 298 26 COL8 30 43 84 400 415 1.0 1.4 259 24 RCL2 20 38 63 150 150 1.0 1.9 38 18 COL13 31 51 65 190 190 1.8 1.6 75 21 RCL4 21 47 45 195 230 1.0 2.2 33 16 COL14 26 59 87 265 300 1.8 2.3 168 24
3.4.3. Conclusions from the tests.
The following detailed conclusions can be made:
– Additional stiffeners in the steel profile do not significantly influence the resistance of the composite column. It can be concluded that they are not useful.
– There is no significant difference in the resistance of specimens with long and short anchorage length of the steel profile. At this stage it can be concluded that short anchorage is effective. – For each strong axis specimens phases, the reinforced concrete specimen and the specimens with