Receptor (
PIGR
) Haplotypes with Major Effect on IgA
Concentration in Bovine Milk
Sarah Berry1*, Wouter Coppieters4, Stephen Davis1, Alayna Burrett1, Natalie Thomas1, David Palmer2, Van Kelly2, Vladimir Obolonkin3, Kathryn Sanders3, Richard Spelman3, Michel Georges4, Klaus Lehnert1, Russell Snell2
1 ViaLactia Biosciences, Auckland, New Zealand, 2 School of Biological Sciences, University of Auckland, Auckland, New Zealand, 3 Livestock Improvement Corporation, Hamilton, New Zealand,4 Unit of Animal Genomics, GIGA-R & Faculty of Veterinary Medicine, University of Lie`ge (B34), Lie`ge, Belgium
Abstract
The aim of this study was to determine a genetic basis for IgA concentration in milk of Bos taurus. We used a Holstein-Friesian x Jersey F2 crossbred pedigree to undertake a genome-wide search for QTL influencing IgA concentration and yield in colostrum and milk. We identified a single genome-wide significant QTL on chromosome 16, maximising at 4.8 Mbp. The polymeric immunoglobulin receptor gene (PIGR) was within the confidence interval of the QTL. In addition, mRNA expression analysis revealed a liver PIGR expression QTL mapping to the same locus as the IgA quantitative trait locus. Sequencing and subsequent genotyping of the PIGR gene revealed three divergent haplotypes that explained the variance of both the IgA QTL and the PIGR expression QTL. Genetic selection based on these markers will facilitate the production of bovine herds producing milk with higher concentrations of IgA.
Citation: Berry S, Coppieters W, Davis S, Burrett A, Thomas N, et al. (2013) A Triad of Highly Divergent Polymeric Immunoglobulin Receptor (PIGR) Haplotypes with Major Effect on IgA Concentration in Bovine Milk. PLoS ONE 8(3): e57219. doi:10.1371/journal.pone.0057219
Editor: Andrew Dewan, Yale School of Public Health, United States of America Received November 6, 2012; Accepted January 14, 2013; Published March 11, 2013
Copyright: ß 2013 Berry et al. This is an open-access article distributed under the terms of the Creative Commons Attribution License, which permits unrestricted use, distribution, and reproduction in any medium, provided the original author and source are credited.
Funding: Funding from this work was received from the Ministry of Business, Innovation and Employment via a FRST Grant. The funders had no role in study design, data collection and analysis, decision to publish, or preparation of the manuscript.
Competing Interests: Sarah Berry, Stephen Davis, Klaus Lehnert, Alayna Burrett, and Natalie Thomas were employed by ViaLactia Biosciences. Vladimir Obolonkin, Kathryn Sanders and Richard Spelman are employed by LIC, a commercial distributer of bovine germplasm. There are no existing patents, products in development or marketed products to declare. This does not alter the authors’ adherence to all the PLOS ONE policies on sharing data and materials, as detailed online in the guide for authors.
* E-mail: sarah.berry@auckland.ac.nz
Introduction
Transmission of maternal immunoglobulins to offspring via colostrum and milk influences neonatal health, providing essential protection against environmental pathogens [1–3]. Further, the improvement of human nutrition, including infant nutrition, is an important target for food producers. Although bovine milk is the predominant ingredient for most commercially prepared infant formulae, significant compositional differences between human and bovine milk exist. Accordingly, strategies to make the composition and function of infant formula more similar to that of human milk may be useful.
IgA is the most abundant immunoglobulin (Ig) in human colostrum and milk, comprising approximately 90% of the total Ig, whereas only 9% of the total Ig in bovine colostrum and milk is IgA [2]. The concentration of Ig in bovine milk and colostrum varies at different stages of lactation, with early colostrum secretions containing the highest concentrations [4–5]. Colostrum IgA concentrations follow this pattern with the maximum concentration reached during the early colostrum period [4]. Variation in IgA concentration within and between bovine breeds [6–8] has been observed, but the basis for this phenotypic variation has not been elucidated. More recently a possible genetic
basis for natural antibody titres in bovine milk was also suggested [9].
Genetic diversity within an agricultural species may provide opportunity for improvements in production, disease resistance and product differentiation options. To explore this potential within dairy breeds, a Holstein-Friesian x Jersey crossbred trial was conducted, enabling the discovery of genes and mutations associated with variation in milk composition. We have previously shown that natural genetic variation can be successfully used to inform bovine breeding decisions [10–12]. One strategy to increase the concentration of IgA in bovine milk, to more closely match the composition of human milk, is the use of genetic selection, allowing the generation of specialised herds or dairy products.
Our hypothesis was that phenotypic variation in IgA content of bovine colostrum or milk would be, in part, genetically determined. Therefore, our aim was to identify loci associated with IgA, and to establish a selection tool that would allow colostrum and milk IgA to be increased. We searched for chromosomal regions associated with colostrum IgA content and identified a candidate gene, polymeric immunoglobulin receptor (PIGR). We demonstrate that polymorphisms within this gene explain more than 25% of the phenotypic variation for colostrum
IgA and consequently provide the ability to increase milk IgA content through the use of marker-assisted selection.
Materials and Methods Ethics Statement
Ethics approval for all sample collection procedures, manipu-lations and measurements performed on the animals was granted by the Ruakura Animal Ethics Committee, Hamilton, New Zealand. No animals were sacrificed during this study. The samples collected were milk and colostrum samples, which were collected by sub-sampling of milk and colostrum collected during industry-standard milk collections; blood samples, which were collected by venipuncture of the coccygeal vein, in accordance with procedures approved by the ethics committee, and needle biopsy samples of the fat and liver tissue, collected in accordance with procedures approved by the ethics committee. The farm was owned by our research group and managed by professional farm staff.
Trial Pedigree design
A Holstein-Friesian x Jersey crossbred trial was conducted using an F2 pedigree design with a half-sibling family structure, as previously described [12–15]. Briefly, reciprocal crosses of Holstein-Friesian and Jersey animals were carried out to produce six F1 bulls of high genetic merit. Eight-hundred and sixty four F2 female progeny were then produced through mating of high genetic merit F1 cows with these F1 bulls. The herd was formed over two years, producing two cohorts, and a total of 724 F2 cows entered their second lactations. The animals were managed on a single farm under typical dairy farming practices in New Zealand using a seasonal, pasture-based system.
Colostrum and milk sample collection
All measurements for the composition of colostrum and milk were taken during the cows’ second lactation. Animals were milked twice daily, using standard dairy industry practice and the volume of milk was recorded at each milking using electronic milk meters. The animals were managed on a seasonal system, with lactation beginning after calving in spring. Colostrum samples were obtained at the second and the eighth milking after calving (days one and four of lactation, respectively) for analysis of IgA and IgG content. Milk samples were also obtained at mid-lactation (a fixed date approximately three months after calving) for analysis of IgA and IgM, as well as milk fat content and milk protein content, and somatic cell count (SCC). On each day that mid-lactation samples were collected, sub-samples from the morning and afternoon milk collections were combined to make a single composite milk sample for each animal. Total fat and total protein contents, and somatic cell count (SSC), a measure of mastitis, were assessed during standard herd testing procedures by Fourier transform infrared spectroscopy using a MilkoScan FT120 (Foss, 2006; Foss, Hillerød, Denmark). In addition, mid-lactation milk samples from a subset of F2 animals (n = 38) were retained for analysis of secretory component. Live-weight was obtained from each cow during the week of milk sampling.
Analysis of immunoglobulins in milk
IgA concentration was measured using the bovine IgA ELISA quantitation kit (Bethyl Laboratories Inc, Montgomery, Texas, USA), as per manufacturer’s instructions. A reference standard of bovine serum, containing 0.18 mg/mL IgA was used to calibrate the assay for the colostrum samples. IgM was measured using a bovine IgM ELISA quantitation kit (Bethyl Laboratories Inc,
Montgomery, Texas, USA; catalogue number E10-101) as per manufacturer’s instructions. A reference standard of bovine serum, containing 2.5 mg/mL IgM was used to calibrate the assay for the colostrum samples. IgG was measured using a nephlometric assay, as previously described [16]. IgA and IgG was measured in a total of 661 colostrum samples at both the second and eighth milkings. IgA and IgM were measured in 661 mid-lactation milk samples. Analysis of Secretory component in milk
Secretory component, the soluble fragment of PIGR, an IgA receptor, was measured in a subset (n = 38) of the 661 milk samples collected at mid-lactation. Whey was prepared by the addition of acetic acid to a final concentration of 1% followed by centrifu-gation at 3,0006g, 20 min, 8uC. The whey samples were reduced, alkylated with iodoacetamide, and digested with trypsin. The tryptic peptides of whey proteins and the synthetic peptide AAPAGAAIQSR, which corresponds to a tryptic peptide of secretory component, were analysed by reverse phase high performance liquid chromatography using an Agilent Technolo-gies 1100 series capillary liquid chromatograph fitted with an Agilent Technologies Zorbax SB-C18 300 A˚ 0.36150 mm 3.5mm column coupled to an Agilent Technologies model SL ion trap mass spectrometer with an electrospray ionisation interface. The Zorbax column was developed with a gradient of 4% to 56% acetonitrile in 0.1% formic acid/0.005% heptafluor-obutyric acid, over 27 minutes at a flow rate of 4ml/min. The mass spectrometer was operated in single ion monitoring mode which was set to isolate and fragment the doubly protonated ion of peptide AAPAGAAISQR observed at 506.8 m/z; fragment ions were observed by scanning the mass range from 430 m/z to 810 m/z. The predominant fragment ion observed at 435.9 m/z, corresponding to the doubly protonated y9 ion, was used for quantitation; ions observed at 623.3 m/z, corresponding to the b8 ion, and at 704.2 m/z, corresponding to the y7 ion, were used as qualifiers. The peptide AAPAGAAIQSR observed in samples of trypsin-digested whey was quantitated by comparison to a standard curve constructed using the synthetic peptide AAPA-GAAIQSR.
Liver biopsy, mRNA preparation and microarray analysis Liver and adipose tissue biopsies were taken from a subset of the F2 Holstein-Friesian x Jersey crossbred cows. Approximately 480 cows were biopsied, during the third lactation, ten weeks after parturition. Biopsy procedures were in accordance with proce-dures approved by the Ruakura Animal Ethics committee and were conducted as previously described [17]. Biopsy tissue (approximately 0.5 cm3) was placed in a container with 10 volumes RNAlater (Ambion), stored overnight at 4u, and then frozen at 220u. After thawing, the tissue was removed from the RNAlater and homogenised in 750ml TRIzol (Life Technologies) for liver samples, and 750ml QIAzol (Qiagen) for adipose samples. RNA was then extracted according to manufacturer’s instructions. The RNA was quantified using a NanoDrop (ThermoScientific), and a quality assessment was made using an RNA 6000 BioAnalyzer chip (Agilent). Between 5 and 8mg total RNA was labelled using the Affymetrix One-Cycle Target Labeling and Control Reagents Kit (Affymetrix, P/N 900493). 10mg of labeled, fragmented cRNA was hybridized overnight to a GeneChip Bovine Genome Array (Bovine 39 arrays, Affymetrix), and the array was processed and scanned according to the manufacturer’s instructions. The microarray contained 24,027 probe sets repre-senting more than 23,000 transcripts and includes approximately 19,000 UniGene clusters. There were 11 probe pairs per probe set.
Following microarray hybridisation and scanning, gene expres-sion data files (CEL files) were obtained for analysis. The R (version 2.13.1, [18]) computational environment and ‘‘affy’’ library were used as recommended by Affymetrix to assess data quality. Of the 855 data files, 26 were found to have RNA degradation and were consequently removed from further analysis. The remaining 829 data files (359 for adipose tissue, 470 for liver tissue, 334 animals with both liver and fat observations) were processed as one batch using the Affymetrix Robust Multi-Array Average (RMA) normalisation procedure. The output was then adjusted using REML, separated by tissue type and fitted for biopsy date and RNA preparation date as fixed effects. In addition, sire was fitted as a random effect. The resulting residuals were used for QTL identification as described below. Data are presented as adjusted means 6 standard error. Genotyping
Genomic DNA was prepared from whole blood, 1661 animals within the trial pedigree, including 846 F2 daughters, the six F1 sires, 796 F1 dams, and 13 selected F0 sires. The entire pedigree was genotyped using the Illumina BovineSNP50 BeadChip (Illumina, San Diego, USA) which assayed 54,000 SNPs. Additional genotyping of SNPs discovered within the PIGR gene was performed, using the single base extend 1 method and iPlex gold chemistry (Sequenom).
Genome sequencing of F1 sires
Genomic DNA for whole genome sequencing was prepared from whole blood of the six F1 sires, using a phenol-chloroform extraction. Sample preparation and whole genome sequencing was carried out by Illumina FastTrack, using the HiSeq 2000 system. A total of 958Gbase of data (100 bp Paired End, ,320 bp insert size, V2 chemistry) was obtained (average 159.7 Gbase per F1 sire).
Reads were aligned to the Bos Taurus UMD3.1 (bosTau6) genome sequence with BWA version 5 [19] using the default parameters. Indel realignment, duplicate removal and SNP/ INDEL detection was performed on the six alignments simulta-neously using the Genome Analysis Toolkit (GATK; [20]). GATK was also used to recalibrate the quality scores of the variants [21]. Variants with a VSQLOD below one were not analysed. QTL mapping
QTL mapping was conducted using a previously described mixed model that includes a locus-specific haplotype effect (random) as well as an individual polygenic effect (random) to correct for stratification [22]. Genotypes were phased using both familial (Mendelian segregation and linkage) and population (linkage disequilibrium (LD)) information and assigned to 20 ancestral haplotypes using a Hidden Markov Model [22]. The haplotype effect in the mixed model corresponded to the effect of the 20 ancestral haplotypes, which were considered uncorrelated. The covariances between the individual polygenic effects corre-sponded to twice the coefficient of kinship estimated from pedigree records. Variance components were estimated using AIREML [23]. The statistical significance of the haplotype effect was estimated using a likelihood ratio test (LRT = 2LN(LR)) compar-ing the likelihood of the data under the full model with that under a model without haplotype effect. The LRT was assumed to be distributed under the null hypothesis as a mixture of chi-squared with 1 and 2 degrees of freedom [24–25]. Consequently, the threshold for genome-wide significance (expected to be exceeded by chance once per 20 genome scans) was set at 24, corresponding to a Bonferroni-corrected p-value of 9.661027<0.05/54,000,
while the genome-wide suggestive threshold (expected to be exceeded by chance on average once per genome scan) was set at 19.8, corresponding to a Bonferroni-corrected p-value of 8.561026<0.37/54,000.
Statistical analysis of milk phenotypes
Data analysis was performed using R (version 2.13.1, [18]). The final dataset included observations for 661 animals for all phenotypes except secretory component, for which we had observations in 38 animals. The phenotypic variation of IgA concentration, milk volume and IgA yield (IgA concentration multiplied by milk volume) was described using analysis of variance, where milking number (second or eighth), sire (sires 1– 6), calving date and cohort (cohort one or two, determined by birth year) were fitted as fixed effects. The effect of PIGR ‘‘genotype of haplotype’’ (I/I, I/II, I/III, II/II, II/III, III/III) on colostrum IgA and IgG, measured at the 2nd and 8th milkings, and on IgA, IgM, secretory component, milk fat content, milk protein content, milk volume and somatic cell count, all measured at mid-lactation, was determined using a generalized linear model. PIGR ‘‘genotype of haplotype’’, sire and cohort were fitted as fixed effects, while calving date was fitted as a continuous covariate. A significance level of p = 0.05 was used throughout, and LS means and their corresponding standard errors were evaluated using the Effects package in R (version 2.13.1, [18]).
Results
Phenotypic variation of colostrum IgA
The average IgA concentration in colostrum at the second milking was 1.6560.04 mg/mL and, as expected, decreased significantly by the eighth milking to 0.4360.04 mg/mL (P = 1.54610275). Milk volume at the 2nd milking was 8.0760.10 L and at the 8th milking was 9.8260.10 L (P = 3.76610231). The yield, or total amount, of IgA produced also differed significantly between the second and eighth milkings (12.8560.37 mg/milking vs. 4.1060.37 mg/milking, P = 5.35610258). The concentration of IgA in colostrum differed significantly according to transmitting sire, at both the second and the eighth milkings (P = 7.9661026 and P = 7.5261029 respec-tively), as did the yield of IgA at both the second and eighth milkings (P = 1.3861025 and 1.1861026 respectively). IgA con-centration in colostrum was also significantly influenced by cohort (0.3860.01 mg/mL vs. 0.4660.01 mg/mL, P = 0.013) and by calving date (P = 0.0063, data not shown). IgA yield in colostrum was not significantly influenced by cohort (P = 0.59, data not shown) or by calving date (P = 0.559, data not shown). The average of IgA concentration in mature milk, measured at mid-lactation, was 0.6960.03 mg/mL. Milk volume at mid-lactation was 16.7662.80 L, and thus the yield per day of IgA at this time-point was 11.3560.21 mg. The concentration and yield of IgA at mid-lactation differed significantly according to transmitting sire (P = 0.005 and 5.6861027respectively). IgA concentration at mid-lactation was also significantly influenced by cohort (0.6160.012 mg/mL vs. 0.7560.014 mg/mL, P = 3.1061027) and by calving date (P = 1.0161025; data not shown). IgA yield at mid-lactation was significantly influenced by cohort (10.1860.17 mg/milking vs. 12.360.23 mg/milking, P = 2.3661028) but not calving date (P = 0.663, data not shown). A QTL with major effect on colostrum and milk IgA maps to bovine chromosome 16
We scanned the genome for QTL influencing IgA concentra-tion and yield in colostrum and milk using a previously described
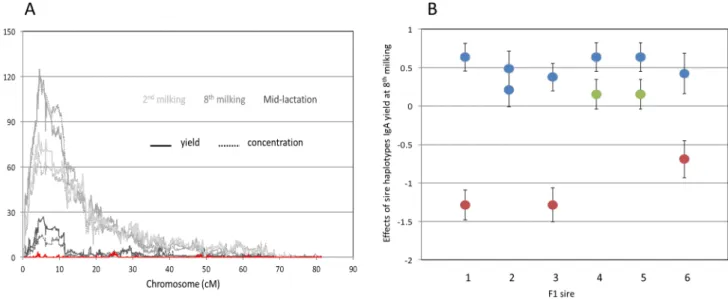
haplotype-based method that simultaneously extracts linkage and LD information and accounts for population stratification [22]. The phenotypes used for this QTL mapping are in Table S1 and genotypes are in Table S2, with marker positions in Table S3. This analysis revealed a single genome-wide significant QTL with major effect on IgA concentration and yield in both colostrum and milk on chromosome 16 (Fig. 1A and Fig. S1). The most likely position of the QTL ranged from position 4,305,200 to 5,540,018 (UMD3.1/bosTau6) depending on the phenotype considered. The 95% confidence interval for the QTL, defined with the LRT-4.6 ( = lod-2) drop-off method applied to the phenotype that yielded the highest LRT, (colostrum IgA yield at the eighth milking; LRT = 124.9 at chromosome position 4,533,875); spanned ,162 Kb (chromosome position 4,466,778–4,628,745). The effects of hidden haplotype state on colostrum IgA yield at the 8th milking ranged from 21.2460.037 to +0.6860.077 mg (Fig. 2). The substitution effects of the haplotypes carried by F1 sires 1, 3 and 6 were large (between 1.19 and 1.67 mg), by F1 sires 4 and 5 intermediate (0.45 mg), and by F1 sire 2 virtually zero (Fig. 1B).
In addition to this significant QTL on chromosome 16, we obtained tentative evidence for a QTL influencing IgA yield at the 2ndcolostrum collection on chromosome 4 (Fig. S1).
An expression QTL (eQTL) influencing hepatic PIGR expression coincides with the IgA QTL
The 95% CI for the IgA QTL encompasses seven annotated genes: IL19, IL20, ITM2C, PIGR, FCAMR, FAIM3 and IL24. PIGR encodes the polymeric immunoglobulin receptor, which has been previously implicated in the binding, and basal to apical translocation of IgA molecules in a variety of cell types including epithelial cells [26–27]. Thus PIGR was an excellent positional candidate gene. To examine whether the PIGR gene might be involved in determining the IgA QTL, we first took advantage of microarray data, available for adipose and hepatic tissue of 359
and 429 F2 cows, respectively. We analyzed the PIGR expression data using the same haplotype-based mixed model approach that was used for IgA, to search for QTL influencing PIGR expression. The phenotypes used for this QTL mapping are in Table S1 and genotypes are in Table S2, with marker positions in Table S3. We obtained a highly significant cis-eQTL (LRT = 145.24) at position 4,540,424, i.e. within the 95% confidence interval of the IgA QTL (eighth colostrum) and within the body of the PIGR gene (Fig. 3A). The effects of hidden haplotype state on PIGR expression ranged from 20.3560.01 to +0.3760.02 (arbitrary units; Fig. 2), and were very significantly correlated (p = 0.01) with their effect on IgA in colostrum and milk (Fig. 2). However, an increase in hepatic PIGR expression was associated with a decrease in IgA secretion into milk. Moreover, despite the correlation between the haplotype effects on PIGR expression and IgA, the substitution effects on PIGR expression of the haplotypes of the F1 sires did not match those on IgA amounts: they were large for sires 4 and 5 (0.48 arbitrary units), intermediate for sires 1, 3 and 6 (0.3187, 0.368 and 0.428 arbitrary units, respectively) and virtually zero for sire 2 (Fig. 3B).
Genome sequencing reveals the segregation of three, highly divergent PIGR haplotypes
We took advantage of genome-wide resequencing data recently generated for the six F1 sires that will be described in more detail elsewhere. We focused our attention on ,24 Kb spanning the 11 exons of the PIGR gene including ,10 Kb of upstream and ,3 Kb of downstream sequence. Sequence depth across this interval averaged 262 (range: 9–451). We analyzed the sequence data using GATK [20–21] and identified 269 sequence variants (251 SNP, 10 deletions, 8 insertions) within this interval. Of these, 258 (i.e. 98%) conformed to one of three segregation patterns in the F1 sires: (i) sires 1, 3 and 6 heterozygous (126 variants), (ii) sires 4 and 5 heterozygous (95 variants), and (iii) sires 1, 3, 4, 5 and 6 heterozygous (37 variants). The most parsimonious explanation of
Figure 1. Chromosome 16 QTL for colostrum and milk IgA content. (A) Location scores (LRT = likelihood ratio test) obtained when scanning bovine chromosome 16 for QTL influencing IgA concentration (dotted lines) and yield (continuous line) in colostrum collected at the 2ndmilking (‘‘2nd colostrum’’; light gray), colostrum collected at the 8thmilking (‘‘8thcolostrum’’; dark gray) and mid-lactation milk (black) using a mixed-model based approach that simultaneously extracts linkage and LD information. The red curve corresponds to the location scores obtained for IgA yield of 8th colostrum (giving the strongest signal in single QTL analysis) when adding the effect of PIGR haplotype (I, II and III; cfr. Fig. 4) in the model. (B) Effect (6 SEM) of the haplotypes of the six F1 sires on IgA yield of the 8thcolostrum (mg/milking). The haplotypes are labeled according to their corresponding PIGR genotype (I: blue; II: green; III: red; cfr. Fig. 4).
this finding is the segregation of three haplotypes (I, II, III) for which the F1 sires would have genotype I/II (sire 1), I/I (sire 2), I/ II (sire 3), I/III (sire 4), I/III (sire 5) and I/II (sire 6) (Table S4). We developed genotyping assays for eight SNPs. Four of those (E3_903 at position 4543550, E4_3938 at position 4540515, E4_4029 at position 4540424, and E5_5183 at position 4539270) would have segregation pattern (i), two (39UTR_9519 at position 4534484 and 39UTR_9640 at position 4534363) segregation pattern (ii), and two (59UTR_-33 at position 4544485 and 59UTR_-9 at position 4544461) segregation pattern (iii). We
genotyped the entire F2 pedigree and phased the resulting genotypes using Phasebook [22]. The three haplotypes predicted from the sequence data of the F1 sires indeed accounted for 98.2% of the chromosomes in the F2 generation (I: 50.3%; II: 12.4%; III: 35.5%).
Closer examination of the sires’ sequences indicated that haplotypes II and III differ at 224/269 variant positions, corresponding to a remarkably high average nucleotide diversity (p) of 1/109. The differences between these two highly divergent haplotypes include 32 exonic variants of which 19 are
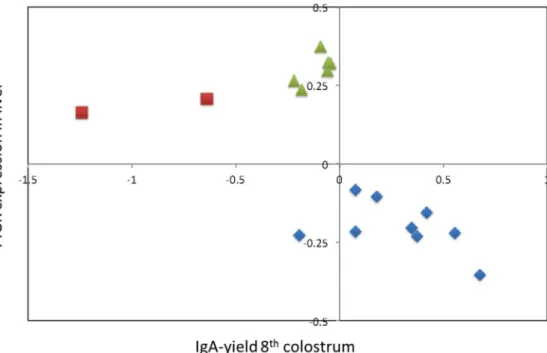
non-Figure 2. Effects of hidden haplotype states. Bivariate effects (Y-axis: PIGR expression in liver; X-axis: IgA yield of 8thcolostrum) of the 20 Hidden Haplotype States at the most likely position of the 8thcolostrum IgA yield QTL (4,533,875). Hidden Haplotype States are labelled according to their PIGR haplotype (I: blue; II: green; III: red; cfr. Fig. 4).
doi:10.1371/journal.pone.0057219.g002
Figure 3. Chromosome 16 eQTL forPIGRmRNA expression. (A) Location scores (LRT = likelihood ratio test) obtained when scanning bovine chromosome 16 for QTL influencing PIGR transcript levels (black line) in liver using a mixed-model based approach that simultaneously extracts linkage and LD information. The red curve corresponds to the location scores obtained for PIGR mRNA expression level (liver) when adding the effect of PIGR haplotype (I, II and III; cfr. Fig. 4) in the model. The gray line corresponds to the location score obtained for IgA yield of the 8thcolostrum (cfr. Fig. 1A). (B) Effect (6 SEM) of the haplotypes of the six F1 sires on PIGR expression level in liver. The haplotypes are labeled according to their corresponding PIGR genotype (I: blue; II: green; III: red; cfr. Fig. 4).
synonymous (Table S4). Moreover, haplotype I appeared recom-binant between these two highly divergent haplotypes: it is closely related to haplotype II at the 39 end (downstream of exon 6; p = 1/ 705), while being closely related to haplotype III in the center (exon 4 – intron 6; p = 1/609). The relationship between the three haplotypes was less contrasted at the 59 end of the PIGR gene (upstream of intron 3), the nucleotide diversity being ,1/200 for all three haplotype comparisons (Fig. 4).
The PIGR haplotype triad fully accounts for the IgA QTL and PIGR eQTL
We determined the correspondence between the hidden haplotype states used for the QTL analysis and the PIGR haplotypes. As can be seen from Fig. 2, the three PIGR haplotypes define three clusters of hidden states that are non-overlapping with respect to their bivariate effect on milk IgA and hepatic PIGR expression levels. When adding PIGR haplotype as a random effect in the QTL analyses, hidden haplotype effects on IgA amount and PIGR expression disappeared, indicating that PIGR haplotypes fully explain the identified QTL (Fig. 1A & 3A). PIGR genotype (I/ I, I/II, I/III, II/II, II/III) accounted for ,4% of the variance of IgA yield/concentration in the 2ndcolostrum milking, ,20% in the 8th colostrum milking, ,17% in mid-lactation, while accounting for ,35% of the variance in PIGR expression level in liver. PIGR haplotype effects on both IgA yield/concentration as well as on PIGR transcript levels appeared to largely act additively (intermediate phenotype of heterozygotes when compared to alternate homozygotes; Fig. 5).
Effect of PIGR genotype on milk composition
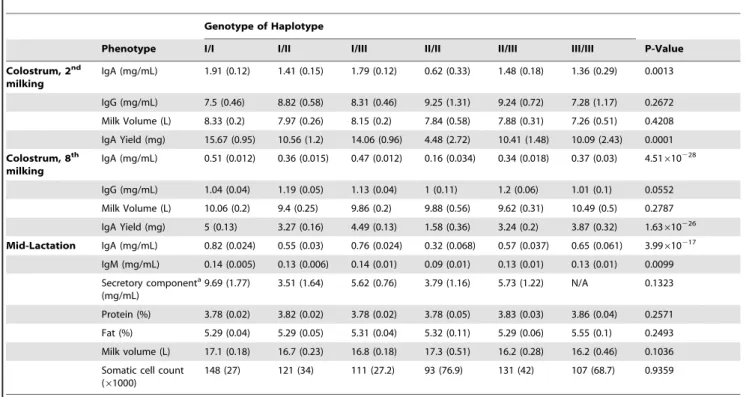
We considered the effect of ‘‘genotype of haplotype’’ on milk composition. The concentration and yield of IgA in colostrum (at the second and eighth milkings), and in mature milk (mid-lactation) was significantly affected by genotype (Table 1). In particular, animals homozygous for haplotype II produced colostrum and milk with approximately one third the concentra-tion of IgA than animals homozygous for haplotype I (Table 1). There was also a significant effect of haplotype on milk IgM concentration, with animals homozygous for haplotype II producing milk with approximately half the concentration of IgM than animals homozygous for haplotype I (Table 1). In contrast, there was no effect of PIGR haplotype on colostrum IgG concentration. No significant effect of genotype was observed for the amount of fat or protein in milk, daily milk yield, or somatic cell count (Table 1).
Discussion
We have demonstrated that the PIGR gene is characterized by three common haplotypes that segregate at intermediate frequen-cies in both HF and Jersey, and that these fully account for (i) a QTL with major effect in milk IgA concentrations, and (ii) a cis-acting eQTL on PIGR transcript levels in adult liver. The IgA QTL is primarily due to the negative effect on milk IgA levels of haplotype II when compared to haplotypes I and III. The most striking difference between haplotype II, and haplotypes I and III, is a 7.3 Kb segment between exons 3 and 10, characterized by 85 genetic variants differentiating II versus I/III. These include 13
Figure 4. Sequence comparison ofPIGRhaplotypes. (A) Variant positions at which the corresponding pair of PIGR haplotypesDiffer (upper line; ‘‘D’’), or are theSame (lower line; ‘‘S’’). The positions of the PIGR exons are marked by the transparent gray boxes. (B) Schematic representation of the three major PIGR haplotypes with indication of the positions at which they differ or not. Within the body of the PIGR gene, haplotype I is appears as a recombinant between haplotype II and III, which differ on average every 109 nucleotides. Upstream of the gene, the three haplotypes differ on average every ,200 nculeotides.
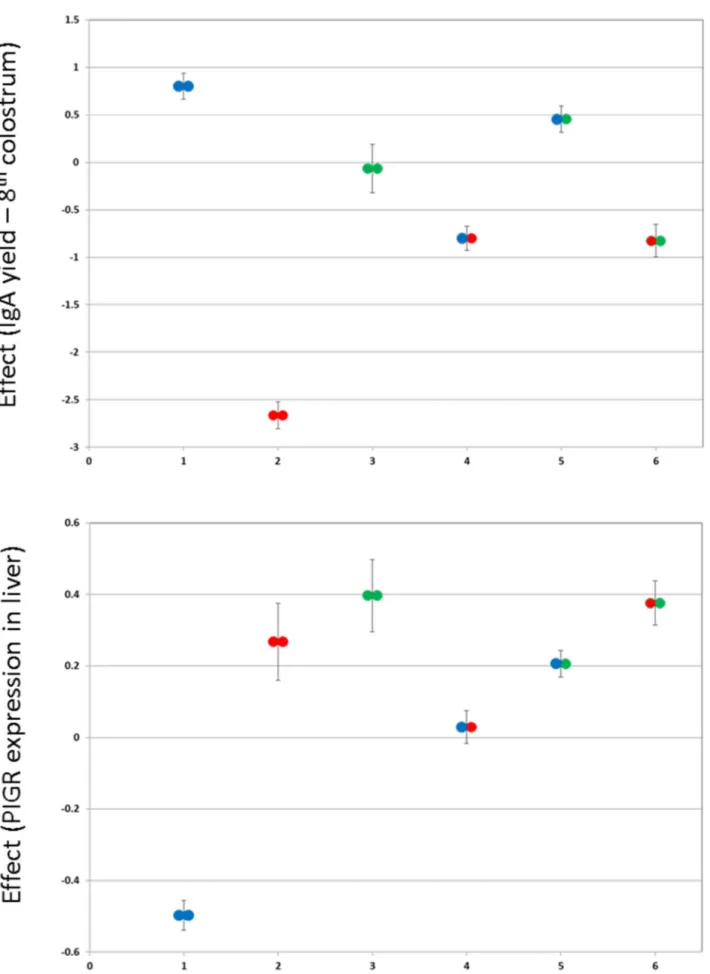
Figure 5. Effect ofPIGRgenotype on IgA yield andPIGRexpression. Phenotypic effects (6 SEM) of the six possible PIGR genotypes (I/I, II/II, III/ III, I/II, I/III, II/III – I: blue; II: green; III: red; cfr. Fig. 4) on IgA yield of the 8thcolostrum (A) and PIGR expression in liver (B). In general the phenotypic mean of the heterozygotes is intermediate between the corresponding alternate homozygotes, supporting additivity.
non-synonymous substitutions (Table S1). A likely hypothesis is that one or several of the structural variants in this segment directly affect the functionality of PIGR and cause the observed QTL effect. All of these variants are in near perfect LD in the analyzed sample. It is therefore impossible to genetically identify the causative variant(s) by association analysis. Further dissection of the molecular mechanisms underlying the corresponding effect will require the analysis of other populations and/or functional assays.
The PIGR eQTL effect is primarily due to the negative effect on hepatic transcript levels of haplotype I, when compared to haplotypes II and III. There are 43 variant positions for which haplotypes II and III are identical yet differ from haplotype I. A plausible hypothesis is that one or several of these (or variants in high LD with them yet outside of the considered region) are directly responsible for the eQTL effect observed in liver. It is noteworthy that five of the corresponding variants cluster within 300 bp from the presumed transcriptional start site, including one with Phastcons score of 0.5. Alternatively, the higher expression levels of haplotypes II and III (when compared to I) could depend on distinct regulatory variants.
In addition to these two major (e)QTL effects, our results support distinct minor effects, underlying (i) the differences between haplotypes I and III with regards to IgA concentrations, and (ii) the differences between haplotypes II and III with regards to PIGR expression. Haplotypes I and III differ most strikingly in the terminal 5.6 Kb of the PIGR gene, with 73 variant positions. However, none of these alters the PIGR open reading frame. Haplotype III shares one non-synonymous substitution differen-tiating it from haplotype I in common with haplotype II (K167R), and this could underlie the observed minor effect on IgA concentrations. As mentioned before, haplotypes II and III differ
at a minimum of 224 positions. Several of these could contribute to the minor II to III eQTL effect. Of note, haplotypes II and III differ for three SNPs with Phastcons scores.0.98, ,1.4 Kb upstream of the transcriptional start site.
Our data does not allow us to draw definitive conclusions with regards to the contribution of regulatory variants to the IgA QTL. The eQTL effect observed in liver may be tissue-specific and not accurately reflect relative PIGR expression in the mammary gland. However, the fact that (i) some haplotype contrasts are strong for IgA concentrations yet weak for expression (I versus III), and vice versa (II versus III), and (ii) increased PIGR expression is associated with decreased IgA concentrations, does not support a direct functional link between IgA QTL and PIGR eQTL.
The nucleotide diversity observed between PIGR haplotypes II and III (p = 1/109) is high. This divergence level is typically expected for haplotypes sampled in distinct sub-species rather than in the same species. A plausible hypothesis is that the two haplotypes originate from distinct bovine sub-species that have been independently domesticated and have subsequently under-gone hybridization. This situation is reminiscent of the highly divergent IGF2 haplotypes that have been observed in commercial European pig populations shown to respectively trace back to Asian and European wild boar populations [28].
It has been proposed that PIGR is also a transporter of IgM [27,29– 30]. In agreement with this observation, our data show a significant effect of the PIGR gene on the concentration of IgM in milk, suggesting that this receptor indeed is important for the secretion of IgM into bovine milk and that similar genetic mechanisms underlie phenotypic variation in both IgA and IgM. There was no effect of the PIGR gene on the concentration of IgG in milk.
Secretory IgA provides the first line of defence against environmental pathogens. Within the mammary gland, secretory
Table 1. Effect of PIGR haplotype on milk composition traits.
Genotype of Haplotype
Phenotype I/I I/II I/III II/II II/III III/III P-Value Colostrum, 2nd milking IgA (mg/mL) 1.91 (0.12) 1.41 (0.15) 1.79 (0.12) 0.62 (0.33) 1.48 (0.18) 1.36 (0.29) 0.0013 IgG (mg/mL) 7.5 (0.46) 8.82 (0.58) 8.31 (0.46) 9.25 (1.31) 9.24 (0.72) 7.28 (1.17) 0.2672 Milk Volume (L) 8.33 (0.2) 7.97 (0.26) 8.15 (0.2) 7.84 (0.58) 7.88 (0.31) 7.26 (0.51) 0.4208 IgA Yield (mg) 15.67 (0.95) 10.56 (1.2) 14.06 (0.96) 4.48 (2.72) 10.41 (1.48) 10.09 (2.43) 0.0001 Colostrum, 8th milking IgA (mg/mL) 0.51 (0.012) 0.36 (0.015) 0.47 (0.012) 0.16 (0.034) 0.34 (0.018) 0.37 (0.03) 4.51610228 IgG (mg/mL) 1.04 (0.04) 1.19 (0.05) 1.13 (0.04) 1 (0.11) 1.2 (0.06) 1.01 (0.1) 0.0552 Milk Volume (L) 10.06 (0.2) 9.4 (0.25) 9.86 (0.2) 9.88 (0.56) 9.62 (0.31) 10.49 (0.5) 0.2787 IgA Yield (mg) 5 (0.13) 3.27 (0.16) 4.49 (0.13) 1.58 (0.36) 3.24 (0.2) 3.87 (0.32) 1.63610226 Mid-Lactation IgA (mg/mL) 0.82 (0.024) 0.55 (0.03) 0.76 (0.024) 0.32 (0.068) 0.57 (0.037) 0.65 (0.061) 3.99610217 IgM (mg/mL) 0.14 (0.005) 0.13 (0.006) 0.14 (0.01) 0.09 (0.01) 0.13 (0.01) 0.13 (0.01) 0.0099 Secretory componenta (mg/mL) 9.69 (1.77) 3.51 (1.64) 5.62 (0.76) 3.79 (1.16) 5.73 (1.22) N/A 0.1323 Protein (%) 3.78 (0.02) 3.82 (0.02) 3.78 (0.02) 3.78 (0.05) 3.83 (0.03) 3.86 (0.04) 0.2571 Fat (%) 5.29 (0.04) 5.29 (0.05) 5.31 (0.04) 5.32 (0.11) 5.29 (0.06) 5.55 (0.1) 0.2493 Milk volume (L) 17.1 (0.18) 16.7 (0.23) 16.8 (0.18) 17.3 (0.51) 16.2 (0.28) 16.2 (0.46) 0.1036 Somatic cell count
(61000)
148 (27) 121 (34) 111 (27.2) 93 (76.9) 131 (42) 107 (68.7) 0.9359 a
n = 38 observations.
mean presented with standard error in brackets. doi:10.1371/journal.pone.0057219.t001
IgA may play a dual role, providing protection against environ-mental pathogens causing mastitis [31–32] as well as providing critical immunity to the neonate. Therefore, it is interesting to speculate whether polymorphisms in the PIGR gene may also relate to disease resistance in the cow and the calf.
In conclusion, we describe mutations within the bovine PIGR gene which form a genetic basis for variation in the secretion of IgA into bovine colostrum and milk. Genetic selection based on these markers will facilitate the production of bovine herds producing milk with higher concentrations of IgA.
Supporting Information
Figure S1 Genome-wide scan for QTL affecting IgA, IgG and IgM. Manhattan plots obtained using a haplotype-based mixed model that simultaneously extracts linkage and LD information and corrects for stratification. For antibody (IgA, IgG or IgM as indicated) concentration (left column) and yield (right column) in 2nd colostrum, 8th colostrum or mid-lactation milk. The LRT threshold for wide significance is 24, while the genome-wide suggestive threshold is 20.
(TIF)
Table S1 Phenotype data used for QTL mapping. ID = unique animal identification number. Cohort = cohort 1 or 2, based on year of birth. Phenotypes listed are milk volume, IgA concentra-tion, IgA yield, IgG concentraconcentra-tion, and IgG yield for the second and eighth milkings, IgA concentration and yield at mid-lactation, PIGR mRNA expression in liver and fat tissue.
(XLS)
Table S2 Genotypes in the PIGR region. ID = unique animal ID. Genotypes are listed as 1 or 2 for both the paternal and maternal alleles.
(XLS)
Table S3 Marker map information. For the markers listed in Table S2, the bovine chromosome 16 map position (UMD3.1) is given, along with RS# if available.
(XLS)
Table S4 Sequence variant data for the six F1 sires. Sires are numbered 1001–1006. Sequence variant information is given in terms of reference allele and alternative allele, as well as reference amino acid and alternative amino acid where applicable. (XLS)
Acknowledgments
The authors wish to thank staff at the Whareroa farm staff for assistance with animal management and sample collection, Colin Prosser and staff (AgResearch) for conducting the immunoglobulin assays and Liam Williams (University of Auckland) for assistance with the microarray experiment. Technical assistance from Ashley Smith and Hamish Ward (ViaLactia Biosciences) was also gratefully received.
Author Contributions
Conceived and designed the experiments: SB R. Snell KL R. Spelman SD WC MG. Performed the experiments: NT AB DP VK. Analyzed the data: SB WC SD MG VO KS. Wrote the paper: SB WC MG R. Snell.
References
1. Korhonen H, Marnila P, Gill HS (2000) Milk immunoglobulins and complement factors. Br J Nutr 84: S75–80.
2. Wheeler TT, Hodgkinson AJ, Prosser CG, Davis SR (2007) Immune components of colostrum and milk - a historical perspective. J Mammary Gland Biol Neoplasia 12: 237–47.
3. Stelwagen K, Carpenter E, Haigh B, Hodgkinson A, Wheeler TT (2009) Immune components of bovine colostrum and milk. J Anim Sci S87: 3–9. 4. Porter P (1972) Immunoglobulins in bovine mammary secretions quantitative
absorption by the neonatal calf. Electrophoresis 1970: 225–238.
5. Butler JE, Kiddy CA, Pierce CS, Rock CA (1972) Quantitative changes associated with calving in the levels of bovine immunoglobulins in selected body fluids. I. Changes in the levels of IgA, IgGl and total protein. Can J Comp Med 36: 234–42.
6. Mazengera KE, Kennedy BW, Burnside EB, Wilkie BN, Burton JH (1985) Genetic parameters of bovine serum immunoglobulins. J Dairy Sci 68: 2309–14. 7. Vann RC, Holloway JW, Carstens GE, Boyd ME, Randel RD (1995) Influence of calf genotype on colostral immunoglobulins in Bos Taurus and Bos Indicus cows and serum immunoglobulins in their calves. J Anim Sci 73: 3044–3050. 8. van Knegsel ATM, de Vries Reilingh G, Meulenberg S, van den Brand H,
Dijkstra J, et al. (2007) Natural antibodies related to energy balance in early lactation dairy cows. J Dairy Sci 90: 5490–8.
9. Ploegaert TC, Wijga WS, Tijhaar E, van der Poel JJ, Lam TJGM, et al. (2010) Genetic variation of natural antibodies in milk of dutch Holstein-Friesian cows. J Dairy Sci 93: 5467–73.
10. Grisart B, Coppieters W, Farnir F, Karim L, Ford C, et al. (2002) Positional candidate cloning of a QTL in dairy cattle: identification of a missense mutation in the bovine DGAT1 gene with major effect on milk yield and composition. Genome Res 12: 222–31.
11. Blott S, Kim JJ, Moisio S, Schmidt-Ku¨ntzel A, Cornet A, et al. (2003) Molecular dissection of a quantitative trait locus: a phenylalanine-to-tyrosine substitution in the transmembrane domain of the bovine growth hormone receptor is associated with a major effect on milk yield and composition. Genetics 163: 253–66. 12. Berry SD, Davis SR, Beattie EM, Thomas NL, Burrett AK, et al. (2009)
Mutation in bovine beta-carotene oxygenase 2 affects milk color. Genetics 182: 923–6.
13. Spelman RJ, Miller FM, Hooper JD, Thielen M, Garrick DJ (2001) Experimental design for QTL trial involving New Zealand Friesian and Jersey breeds. Proc Assoc Advmt Anim Breed Genet 14: 393–396
14. Berry SD, Lopez-Villalobos N, Beattie EM, Davis SR, Adams LF, et al. (2010) Mapping a quantitative trait locus for the concentration of beta-lactoglobulin in milk, and the effect of beta-lactoglobulin genetic variants on the composition of milk from Holstein-Friesian x Jersey crossbred cows. N Z Vet J 58: 1–5.
15. Karim L, Takeda H, Lin L, Druet T, Arias JC, et al. (2011) Variants modulating the expression of a chromosome domain encompassing PLAG1 influence bovine stature. Nat Genet 43: 405–13.
16. Collin R, McLaren R, Thomson M, Malcolm D (2002) Development and validation of a nephelometric immunoassay for IgG1 in milk. J Dairy Res 69: 27–35.
17. Littlejohn MD, Walker CG, Ward HE, Lehnert KB, Snell RG, et al. (2010) Effects of reduced frequency of milk removal on gene expression in the bovine mammary gland. Physiol Genomics 41: 21–32.
18. R Development Core Team, (2012) R: A language and environment for statistical computing. R Foundation for Statistical Computing, Vienna, Austria. ISBN 3-900051-07-0. Available: http://www.R-project.org/. Accessed 2013 Feb 7.
19. Li H, Durbin R (2009) Fast and accurate short read alignment with Burrows-Wheeler transform. Bioinformatics 25: 1754–1760.
20. McKenna A, Hanna M, Banks E, Sivachenko A, Cibulskis K, et al. (2010) The genome analysis toolkit: a MapReduce framework for analyzing next-generation DNA sequencing data. Genome Res 20: 1297–303
21. DePristo M, Banks E, Poplin R, Garimella K, Maguire J, et al. (2011) A framework for variation discovery and genotyping using next-generation DNA sequencing data. Nat Genet 43: 491–498.
22. Druet T, Georges M (2010) A hidden markov model combining linkage and linkage disequilibrium information for haplotype reconstruction and quantitative trait locus fine mapping. Genetics 184: 789–98.
23. Tarre´s J, Liu Z, Ducrocq V, Reinhardt F, Reents R (2007) Validation of an approximate REML algorithm for parameter estimation in a multitrait, multiple across-country evaluation model: a simulation study. J Dairy Sci 90: 4846–55 24. Xu S, Atchley WR (1995) A random model approach to interval mapping of
quantitative trait loci. Genetics 141: 1189–97
25. Grignola FE, Hoeschele I, Zhang Q, Thaller G (1996) Mapping quantitative trait loci in outcross populations via residual maximum likelihood. II. A simulation study. Genet Sel Evol 28: 491–504.
26. Kaetzel CS, Robinson JK, Chintalacharuvu KR, Vaerman JP, Lamm ME (1991) The polymeric immunoglobulin receptor (secretory component) mediates transport of immune complexes across epithelial cells: a local defense function for IgA. PNAS 88: 8796–800
27. Johansen FE, Pekna M, Norderhaug IN, Haneberg B, Hietala MA, et al. (1999) Absence of epithelial immunoglobulin A transport, with increased mucosal leakiness, in polymeric immunoglobulin receptor/secretory component-deficient mice. J Exp Med 4: 915–22.
28. Van Laere AS, Nguyen M, Braunschweig M, Nezer C, Collette C, et al. (2003) A regulatory mutation in IGF2 causes a major QTL effect on muscle growth in the pig. Nature 425: 832–6.
29. Kaetzel CS (2005) The polymeric immunoglobulin receptor: bridging innate and adaptive immune responses at mucosal surfaces. Immunol Rev 206: 83–99
30. Wijburg OL, Uren TK, Simpfendorfer K, Johansen FE, Brandtzaeg P, et al. (2006) Innate secretory antibodies protect against natural Salmonella typhimur-ium infection. J Exp Med 23: 21–6.
31. Guidry AJ, Miller RH (1986) Immunoglobulin isotype concentrations in milk as affected by stage of lactation and parity. J Dairy Sci 69: 1799–805.
32. Sordillo LM, Streicher KL (2002) Mammary gland immunity and mastitis susceptibility. J Mammary Gland Biol Neoplasia 7: 135–46.