SUBMITTED TO DIOXIN 2003
SPECIAL SESSION
“THE ULTIMATE TRACE METHOD: WHAT IS POSSIBLE?”
Chair: Donald Patterson, Center for Disease Control and Prevention, USAUNIVERSAL INTEGRATED EXTRACTION AND CLEAN-UP SYSTEM
FOR THE MEASUREMENT OF TRACE LEVELS OF HALOGENATED
POLLUTANT IN BIOLOGICAL FLUIDS AND SOLIDS
Jean-François Focant1, Catherine Pirard1, Gauthier Eppe1, Hamid Shirkhan2 and Edwin De Pauw1 1
Mass Spectrometry Laboratory, University of Liège, B6c Sart-Tilman, B-4000 Liège, Belgium. E-mail : Catherine.Pirard@ulg.ac.be
2
Fluid Management Systems, Inc., 56-58 Felton Street, Waltham, MA 02453, USA.
Introduction
Accurately and cost/time-effectively measuring trace-levels of dioxins and other halogenated pollutants in various types of matrices has been, and still often is, a challenge for scientists. As time goes, analyte concentrations usually decrease while the amount of sample available for analysis tend to be smaller and new comers join the list of compounds to be screened for. Especially in the case of epidemiological studies on human samples and for QC screening of food- and feedstuffs, the number of samples to process is permanently rising. Fortunately, in the mean time, the spectrum of available techniques became broader and existing instruments and assays became more reliable and more sensitive.
Nevertheless, in order to produce reliable results under strong QA/QC criteria, rigorous high throughput sample preparation procedures have to be used for the isolation and purification of trace compounds. The present paper is therefore dedicated to a brief overview of some recent developments in the area of automated sample preparation for the analysis of dioxins and some other selected halogenated pollutants in biological matrices that are characterized by trace-level concentrations.
Material and methods
Automated extraction and clean-up instrument.
The commercially available automated sample preparation Power-PrepTM system (FMS Inc., Waltham, MA, USA) was used. In its basic form, this modular system is made of PC-controlled valves and pumps that manage solvents and samples through various types of disposable columns. Column sizes and sorbent types varies depending applications but classical sets are usually made of multi-layer silica, basic alumina and carbon sorbents [1]. A more recent version of the system has the capability to handle the extraction step for liquids as well as for solids. Solid phase extraction (SPE) and pressurized liquid extraction (PLE) are used for this purpose. Those extraction steps are part of the system, the sample is loaded, extracted, cleaned-up and, fractionated into different fractions that are finally collected.
Analyses.
Gas chromatography-Magnetic sector high resolution mass spectrometry (GC-HRMS). For PCDD and PCDF analyses, an Agilent 6890 GC was connected to either an Autospec Ultima HR mass spectrometer (Micromass, Manchester, UK) or a Finnigan MAT95XL (Finnigan, Bremen, Germany) HR mass spectrometer. They operated at a resolution of 10,000 in the selected ion monitoring mode (SIM) was used [1]. Gas chromatography-Quadrupole ion strorage (tandem-in-time) mass spectrometry (GC-QISTMS). For PCB and PBDE analyses, a ThermoQuest Trace GC
PolarisQ ion trap mass spectrometer (Austin, Tx, USA) was used based on classical split-splitless injection mode [2]. Programmable Temperature Vaporization-Large Volume (PTV-LV) injections were also used for PCDD/Fs using Silcosteel deactivated liners [3].
Results and Discussion
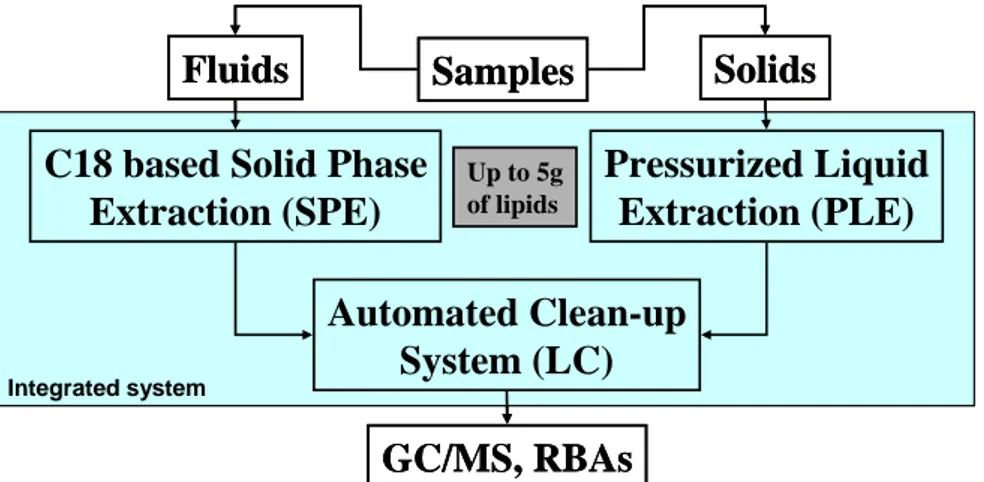
From the early clean-up automation work [4] where samples had still to be extracted using classical manual methods prior processing, the so-called Power-prep instrument evolved to a more comprehensive form. This system results from the integration of the extraction step into the automated sample clean-up stage (Figure 1) [5,6].
GC/MS, RBAs
Fluids
Solids
C18 based Solid Phase
Extraction (SPE)
Pressurized Liquid
Extraction (PLE)
Automated Clean-up
System (LC)
Samples
Up to 5g of lipids Integrated systemGC/MS, RBAs
Fluids
Solids
C18 based Solid Phase
Extraction (SPE)
Pressurized Liquid
Extraction (PLE)
Automated Clean-up
System (LC)
Samples
Up to 5g of lipids Integrated systemFig. 1: Integrated extraction and clean-up system dedicated to the high throughput sample preparation in the area of selected halogenated pollutant analysis.
Furthermore, as the sample size vary drastically depending if human or foodstuff samples are considered, the integrated system was modified to accommodate the targeted range of lipid quantities [1]. Any of those system improvements were validated under strict QC criteria and all the details as well as the fractionation schemes have been reported elsewhere [1,5,6]. Reproducibility, repeatability, accuracy, robustness and, recovery rates fulfill QA requirements (Table 1). The automation of complex manual steps further minimizes the potential intra- and inter-laboratory variation, allows easier data comparisons in between studies and, simplify the establishment of SOPs.
The developed procedures are suited for the analysis of 7 PCDDs, 10 PCDFs, 3 non-ortho PCBs, 8 mono-ortho PCBs, 7 marker PCBs (Arolcor 1260) and, 25 PBDEs in various biological matrices such as human (serum, adipose tissues, breast milk) and foodstuffs (cow milk, meat, fish, fat, animal feedingstuffs, …) [2,7]. Those analytes are collected in different fractions issued from the same sample. As PCDD/Fs are at the lower concentration end, the required sample size is defined regarding their measurement. In practice, around 40 ml of human serum or a sample size equivalent to 4 g of lipids, in the case of foodstuffs, are processed. Volumes of solvents are therefore related to those amounts of samples and act on the blank levels for all analytes. Although the blank levels (and related method LODs) for PCDD/Fs are lower than what is usually observed for manual sample preparation, LOD values for PCBs and PBDEs are logically higher than what can be achieved using smaller sample size (Table 2).
Table 1: Accuracy values for PCDD/F concentrations measured in representative QC samples using the integrated SPE and PLE systems.
Integrated SPE Integrated PLE
Milk Serum Eggs Feedingstuffs
Level (pg/g milk) Accuracy (%) Level (pg/g fat) Accuracy (%) Level (pg/g fat) Accuracy (%) Level (pg/g d.w.) Accuracy (%) 2 1 ,3,7,8 TCDD 0.25 134.2 3.93 104.3 2.39 83.0 - -,2,3,7,8 PeCDD 0.79 130.5 16.62 90.5 8.57 102.5 - -2,3,4,7,8 HxCDD 0.42 95.0 1.60 84.4 0.95 91.9 0.01 -,2,3,6,7,8 HxCDD 0.98 100.6 2.02 74.2 1.07 93.3 0.15 48.5 ,2,3,7,8,9 HxCDD 0.34 110.8 1.66 88.8 0.96 89.0 0.07 78.6 ,2,3,4,6,7,8 HpCDD - - 0.27 95.9 0.06 115.3 1.35 68.9 CDD - - - - 0.01 87.8 0.08 95.1 ,3,7,8 TCDF - - 0.59 87.5 0.30 80.2 0.01 84.8 ,2,3,7,8 PeCDF - - 1.04 91.3 0.62 80.0 - -,3,4,7,8 PeCDF 1.81 123.5 10.09 92.7 6.27 70.8 0.03 115.1 ,2,3,4,7,8 HxCDF 0.94 93.6 1.71 92.6 0.99 93.5 - -,2,3,6,7,8 HxCDF 1.01 109.1 1.87 87.9 1.12 76.6 - -,2,3,7,8,9 HxCDF 1.01 110.9 1.86 94.5 1.14 86.6 - -,3,4,6,7,8 HxCDF - - 1.97 83.2 1.08 69.9 - -,2,3,4,6,7,8 HpCDF - - 0.19 106.3 0.11 - 0.02 99.6 CDF - - - - 0.01 104.7 0.03 100.1 um PCDD/F 7.61 112 44.08 92.8 25.74 86.6 1.71 67.2 1, 1 1 1 O 2 1 2 1 1 1 2 1 O S
Table 2: Example of method LODs for the measurement of selected PCDD/Fs, PCBs and, PBDEs considering the clean-up of foodstuffs samples (equivalent to 4 g of lipids).
Method LODs Recoveries (%) Method LODs Recoveries (%) P 2, 1, 1, 1, 1, 1, O 2, 1, 2, 1, 1, 1, 2, 1, O Non-P PC P PC M P CDD/Fs (pg/g fat) PCB-52 1.78 65 3,7,8 TCDD 0.1 70 PCB-101 0.83 97 2,3,7,8 PeCDD 0.15 85 PCB-153 0.25 63 2,3,4,7,8 HxCDD 0.17 62 PCB-138 0.41 94 2,3,6,7,8 HxCDD 0.15 64 PCB-180 0.15 81 2,3,7,8,9 HxCDD 0.16 66 Mono-ortho PCBs (ng/g fat) 2,3,4,6,7,8 HpCDD 0.69 99 PCB-105 0.03 57 CDD 5.32 66 PCB-114 0.1 108 3,7,8 TCDF 0.12 101 PCB-118 0.16 104 2,3,7,8 PeCDF 0.1 88 PCB-123 0.3 100 3,4,7,8 PeCDF 0.14 87 PCB-156 0.02 102 2,3,4,7,8 HxCDF 0.11 72 PCB-157 0.08 98 2,3,6,7,8 HxCDF 0.11 73 PCB-167 0.45 101 2,3,7,8,9 HxCDF 0.11 70 PCB-189 2.73 66 3,4,6,7,8 HxCDF 0.13 68 PBDEs (pg/g fat) 2,3,4,6,7,8 HpCDF 0.69 112 BDE-28 50.23 67 CDF 0.19 69 BDE-47 64.15 79
ortho PCBs (pg/g fat) BDE-66 15.29 58
CB-77 18.88 91 BDE-100 16.75 66
B-81 8.47 81 BDE-99 39.85 77
CB-126 1.58 84 BDE-85 15.11 62
B-169 0.1 72 BDE-154 8.56 77
arker PCBs (Aroclor 1260) (ng/g fat) BDE-153 17.89 62
CB-28 2.38 65
When low lipid level matrices such as serum and breast milk are considered, LODs (on a lipid basis) are even further increased. However, they remain good enough to allow measurements in non-occupationally exposed populations [8], making this multi-analytes procedures viable. The miniaturization of some parts of the system should allow to lower those LODs in order to follow the current decreasing trend regarding the concentration of some of the analytes in most matrices. Additionally, since the system is so modular, any type of specific method can be implemented. For example, if only PCBs and PBDEs have to be analyzed, much smaller sample size can be used under simplified (faster, smaller sorbent and solvent quantities) conditions to easily achieve lower method LODs.
Currently, the various types of physico-chemical instruments (HRMS, QISTMS, Time-of-Flight mass spectrometry (TOFMS)) that can be used for measurements require such a high throughput sample preparation step in order to remain fed with the optimum amount of samples. The fractionation process is also required due to the limited number of analytes that can actually be separated by classical GC columns coupled to MS. In fact, even when considering the emerging comprehensive multi-dimensional gas chromatography-TOFMS (GCxGC-TOFMS) or a biological approach using enzyme immuno-assays (EIAs) or receptor binding assays (RBAs), the fractionation approach makes sense.
Actually, even if GCxGC-TOFMS is suited to accommodate several types of analytes [9], dynamic range and sensitivity issues do not currently allow to consider all compounds simultaneously. In the case of high throughput EIAs and RBAs, if they intrinsically offer the possibility to measure the global toxicity of a sample, they are more and more dedicated to be used for screening of large numbers of samples in a regulatory context. Regulatory values are, however, always based on a selected number and types of analytes. The use of those biological assays by mean of coupling with the automated fractionation process is an efficient approach to avoid the production of large amounts of false positive results due to cross-reactivities and to ensure the production of the large number of extracts for screening purpose. Fractions can also always be recombined to produce highly purified cocktails of analytes, if required.
Se
Fig. 2: Analytical pyramid in which trace methods have to fit.
Conclusions
When considering trace methods, independently of the final analytical tool to be used to perform the measurement, the automated integrated extraction and clean-up system fits into the analytical pyramid (Figure 2). Due to its versatility, the system can be used to isolate different classes of analytes in various types of matrices. As it is made of modules (1 to 10 sample lines), it can further be used as a high throughput sample preparation tool but also when lower sample input is needed. The low LODs for PCDD/Fs made this system adequate to be used in the lower-upper bound context implemented for foodstuffs monitoring.
References
[1] J.-F. Focant, G. Eppe, C. Pirard. A.-C. Massart, J.-E. Andre and E. De Pauw, Chemosphere 48 (2002) 167.
[2] J.-F. Focant, G. Eppe, C. Pirard and E. De Pauw, J. Chromatogr.A 925 (2001) 207. [3] G. Eppe, J.-F. Focant, C. Pirard and E. De Pauw, Organohalogen Compd. 50 (2001) 186. [4] C.R. Lapeza Jr., D.G. Patterson Jr., J.A. Liddle, Anal. Chem. 58 (1986) 713.
[5] J.-F. Focant and E. De Pauw, J. Chromatogr.B 776 (2002) 199.
[6] J.-F. Focant, H. Shirkhan and E. De Pauw, Organohalogen Compd. 55 (2002) 33. [7] C. Pirard, E. De Pauw and J.-F. Focant, J. Chromatogr.A (2003), in press.
[8] C. Pirard, E. De Pauw and J.-F. Focant Organohalogen Compd, submitted for publication. [9] J.-F. Focant, A. Sjödin and D.G. Patterson Jr., Organohalogen Compd., 2003.