HAL Id: hal-00934217
https://hal.archives-ouvertes.fr/hal-00934217
Preprint submitted on 21 Jan 2014HAL is a multi-disciplinary open access
archive for the deposit and dissemination of sci-entific research documents, whether they are pub-lished or not. The documents may come from
L’archive ouverte pluridisciplinaire HAL, est destinée au dépôt et à la diffusion de documents scientifiques de niveau recherche, publiés ou non, émanant des établissements d’enseignement et de
Flexibility assessment in nuclear energy dominated
systems with increased wind energy shares
Rodica Loisel, David Shropshire, Christian Thiel, Arnaud Mercier
To cite this version:
Rodica Loisel, David Shropshire, Christian Thiel, Arnaud Mercier. Flexibility assessment in nuclear energy dominated systems with increased wind energy shares. 2014. �hal-00934217�
EA 4272
Flexibility assessment in nuclear
energy dominated systems with
increased wind energy shares
Rodica Loisel*
David Shropshire**
Christian Thiel**
Arnaud Mercier**
2014/04
(*) LEMNA - Université de Nantes (**) Institute for Energy and Transport, DG Joint Research Centre, European Commission
Laboratoire d’Economie et de Management Nantes-Atlantique Université de Nantes
Chemin de la Censive du Tertre – BP 52231
D
o
cu
m
en
t
d
e
T
ra
va
il
W
o
rk
in
g
P
ap
er
Flexibility assessment in nuclear energy dominated systems with increased wind energy shares
Rodica Loisel*a,b, David Shropshirea, Christian Thiela, Arnaud Merciera
Abstract
This study analyses the system integration of wind energy in terms of load balancing and power plants scheduling. The case study is the French power system, which relies on high rates of nuclear power, representing 78% in the total generation (2008). The study evaluates the ability of nuclear reactors to follow the load under several configurations of power plants in 2030 with at least 28 GW wind power representing 11% in the total generation. A dynamic optimization dispatching model is built with a detailed discrete-time formulation under the nuclear power ramp up and down constraints. Results show that operating the French power system with high infeed of wind power by 2030 seems technically feasible but relies heavily on the capacity of nuclear reactors to follow variations, on energy storage to insure flexibility and on the market capacity to allow generators to adapt continuously to the demand. Simulations show that balancing the wind power variation is less a matter of installing more flexible capacities, as load factors might decrease and reduce the investors’ interest when prices are relatively low. Balancing becomes more an issue of ramping rates and unit scheduling, power market regulation and real-time market interactions with the day-ahead and intra-day markets.
Keywords: power plants dispatching, flexibility, wind, nuclear, ramping rates.
Introduction
The deployment of renewable energy in the European Union has led to substantial wind power generation, but has also increased the concern over the reliability of power systems [1]. According to estimations of the Global Wind Energy Council, France has the second largest wind potential among Member States. The installed wind capacity is planned to increase from the current 7 GW (2012)1 to about 25 GW by 2020 [2], out of which the on-shore wind potential is documented to reach 19 GW by 2020 at 24% load factor, and off-shore wind power 6 GW at 34% load factor.
One of the issues raised by the wind power integration concerns the flexibility requirements [3,4]. The literature is rich with computer models simulating power systems with increased wind power levels ([5]-[8]). This study gives an original appreciation of
* Corresponding author, rodica.loisel@univ-nantes.fr
a European Commission, DG Joint Research Centre, Institute for Energy and Transport,
P.O. Box 2, 1755 ZG Petten, The Netherlands
the flexibility in systems with a large composition of must-run power plants by analysing the system capability to involve quick-starting and long-lasting capacities on three market segments: the day-ahead market, the positive and the negative regulation markets.
The literature documents different approaches to define reserve requirements. Holttinen [6] shows that wind power variations require additional reserves similarly to the demand variation. Goransson and Johnsson [7] take into account the forecast errors for wind power only when determining the size of the secondary reserve. While Maurer et al. [9] suggests that all variable renewable forecast errors could be balanced through tertiary reserves, because the wind power is forecasted at the same time frame as the tertiary control can be activated. In this study, it is assumed that the balancing of wind fluctuations occurs mostly on the day-ahead market. The issue raised is how the variability of increased wind power will interact with the nuclear power generation, considering the high share in the French electricity generation (78% in 2008), and projections for increased rigidity due to fewer reactors and projected higher utilization rates in the long-term levels [10].
Despite the March 2011 Fukushima accident and adverse public perception of nuclear safety, globally today the nuclear power is back on the policy agendas of many countries, with projections for new nuclear power plants [11]. The main drivers are an increasing energy demand, the concerns over the climate change, the security of supply and the dependence on imports of fossil fuels. Most of the studies show that the nuclear energy is the most cost-effective over the base-load technologies [18], while some others show that in liberalized markets, the cost competitiveness of nuclear power is questionable [11]. This study analyses the nuclear power from a different perspective, and estimates the flexibility capability of nuclear power reactors installed within the French power system. Their capacity to follow the load variations is tested in a system built by 2030 with a short-term perspective from intra-year to an intra-hour timeline. A cost minimization linear programming model has been developed to this aim. Section 2 describes the study case and the methodological approach. Section 3 presents the model results with focus on the dispatching of power plants. Section 4 concludes on the possible solutions to balance the wind variability.
2. Case study framework 2.1. Case definition
The French power system is the second largest in Europe, after the German system. The technological mix in 2008 is mainly composed of nuclear power, providing about 78% of the electricity generation, hydropower (10%), coal (4%), gas (4%), oil (1.1%), wind (1%), and biomass (less than 1%).2 The share of renewables attains 12% of the French electricity generation in 2008 and is planned to increase to 23% by 2020 [2]. France imports nearly all of its oil, gas and coal, but has a good diversification of its import
sources [12]. France benefits from a strategic geographical location in Western Europe and from significant cross-border connections with neighboring countries (15.75 GW). The perspective of future trends in the French market are closely related to the European power market evolution, such as the decentralization in generation, the reduction of over-capacity and the ageing infrastructure. Particular challenges are related to structural imbalances for meeting the peak demand. The country exports mostly baseload electricity and imports mainly during peak periods. The French government intends to enhance the flexibility of the power grids and to boost investments in peaking capacity.
The nuclear power capacity will decline between 2020 and 2030 due to ageing, with some possibilities to extend the lifetime for some of the reactors. New projects are planned or under construction for European Pressurized Water Reactors (EPRs) and for generation IV reactors beyond 2040 [12]. The nuclear reactors currently used in France are the Pressurized Water Reactor type, which is flexible to some extent and has good technical capacities for load-following [13]. The interaction with higher wind power generation will depend however on technical constraints in providing more flexibility but also on the market design to schedule power plants.
2.2. Model description
A power plant dispatching model is designed to describe the power generators in the French system. The model, called Dispa-SET, is developed within Joint Research Centre in the context of activities undertaken under the Strategic Energy Technology Plan. Two scenarios are built for 2030 around the issue: how much gas-fired capacities would be installed as back-up for the wind variability? The first scenario is based on installed capacity data from EC [10] and a second one assumes lower gas-fired capacities such as the utilization rate would result in higher profits and increased interest for investors. A description of the model can be found in Loisel [14], with an application to the energy storage business model, for compressed air energy storage applications. The model is based on linear programming, and it is implemented in GAMS.3 The program minimizes the annual system costs of operating power generators. The model aggregates major generator types into representative technologies (see Table 1). For a given amount of installed capacity, the model determines the most cost-efficient combination of technologies that meets the demand under the system constraints.
Fixed demands accounting for the national supply and the power export flows are addressed on the spot market and regulated markets. Imports are instead adjusted by the model, as a function of fixed import power prices and system needs to fill the gap between supply and demand. Dynamic principles describe the system over one year, with (8784×2) time slices, according to the French balancing mechanism setting imbalance prices and volumes every half-hour.
Technology Installed capacity Efficiency Fuel Cost CO2 emissi Max Loads O&M
costs Ramp Efficiency Fuel Cost Max Loads O&M costs Ramp MW €/MWhkg/kWh %/year €/MWh %/half-hour EC 2030 GAS 2030 €/MWh %/year €/MWh%/half-hour
Nuclear Old 63360 33% 2.7 75% 1.75 6% 40458 40458 34% 3.01 93% 1.75 1%
Nuclear New 17339 17339 36% 3.01 92% 0.61 2%
Coal 10406 36% 7.7 0.34 27% 1.69 14% 1251 1251 40% 9.13 55% 1 15%
Hydro RoR 10315 100% 0 29% 2.5 100% 21363 21363 100% 0 30% 2.48 100%
Hydro Lake 13824 100% 0 29% 2.5 100% 100% 0 30% 2.48 100%
Oil steam turbine 436 39% 15.4 0.28 9% 0.86 30% 0 0 17.65
Oil gas turbine 7373 33% 9% 2.1 100% 5826 5826 39% 0.01% 0.86 100%
CCGT 883 57% 20.3 0.20 76% 0.86 50% 16832 2530 65% 24.90 10% 0.4 100% NGGT 410 39% 76% 0.86 100% 7821 1175 45% 10% 0.4 100% Biomass 446 27% 23.3 0.36 17% 2.1 100% 2547 2547 30% 37.69 60% 2 100% CHP 6600 35% 20.3 0.25 42% 8 100% 7377 7377 40% 0.25 50% 6 100% Wind On-shore 3422 100% 0 19% 0 100% 18939 18939 100% 0 26% 0 100% Wind Off-shore 9000 9000 100% 0 34% 0 100% Solar 13 17% 0 8% 0 100% 11090 11090 17% 0 14% 0.01 100% Other RES 1731 1731 100% 0 38% 2 100% Storage 4302 81% 0 100% 4000 4000 81% 0 100% Imports 15570 8% 38.9 80% 20000 20000 25% 22.7 80% Total Capacity MW 121791 165575 144627 Demand, GWh 490483 598214 598214 Export, GWh 58689 46951 46951 Loss, GWh 10848 12756 12756 2008 2030 Installed capacity, MW
Note. The figures highlighted show the differences between the two scenarios built for 2030.
The objective function is the sum of variable costs only, such as the fuel costs, the carbon price, the variable O&M costs and the import price. Technical constraints are minimum operational loads, the ramping restrictions and the maximum load factors. Minimum operational levels are introduced to avoid high start-up and shut-down costs for nuclear and coal-fired power plants; they can also define power purchase obligations (biomass) and the lack of heat demand for CHP.
Ramping rates define the output variation between two periods, from one half-hour to the next one. They are defined for nuclear and coal-fired plants only. Maximum load factors define the maximum use of a technology due to decreased demand, load-following, limited natural resource inflow or the power plant unavailability during maintenance. The maximum load factors reported in Table 1 are calibrated against the data on the capacity installed and the power generation by technology [10]. These rates increase by 2030 due to technological progress for both wind power and solar power. The values for annual load factors shown in Table 2 are instead the outputs of the model, simulated under the constraint of the above maximum load factor rates.
The model baselines the power system in the reference year 2008. The database is composed of real half-hour figures for power demand and of hourly data for export-import flows and hydro power generation.4 Technology description is documented by Eurostat5 and EC [10] for installed capacities, and by SETIS databases for operational parameters6. Calibration of ramping rates for nuclear power is based on the real data7 on hourly generation in 2008, with a maximum up of the generation of 6% and a ramp-down of -6% per half-hour. Despite this wide range, more than 90% of the number of events of nuclear power variation concentrates within the range of variation of -1% and +1% of the power recorded in the previous half-hour. For 2030, the EC scenario is using
higher load factors (90%) for lower installed capacity than in 2008 (57.7 GW against 63.4 GW); thus, a decrease in ramping capability is assumed, i.e. ± 1% in 2030. The storage capacity installed stands for pumped hydropower storage applications, thereby having an efficiency rate as high as 81% [24].
2.3. Scenarios description
Three scenarios are built, one for 2008 and two for 2030.
The reference scenario, EC 2030, is documented by EC projections (the scenario called
Reference [10]). The model assumes a demand increase from 490 TWh in 2008 to 598
TWh in 2030, with equivalent load spreads between the two periods. The EC projection does not integrate any demand side control measures nor the development of electrical vehicles which could change the demand curve [15].
Most of the planned projects in EC 2030 are for nuclear, natural gas and renewable energies. Nuclear power capacity in 2008 is 63.36 GW composed of 58 nuclear reactors connected to the grid, located on 19 sites. The total nuclear fleet in 2030 would consist of up to 30% new reactors (EPRs), 50% repowered (extended lifetime) reactors, and 20% consisting of reactors remaining from the 2008 fleet ([12], p. 127).
France exports mostly baseload electricity, but with the decrease in the nuclear power in the future, exports will be reduced and imports will become more significant. Additional cross-border capacities are planned to enhance trade with Spain, Italy and Belgium, and to alleviate also transmission congestion. The model assumes an increase in capacities from the current 15750 MW to 20000 MW by 2030. The model assumes that exports decrease by 20% in 2030. Imports are adjusted by the model, driven by the gap between demand and supply, and by price difference between countries.
The alternative case, GAS 2030, assumes a lower amount of installed capacity for combined-cycle gas turbines (CCGT) and natural gas gas-turbines (NGGT). The generation by technology remains unchanged compared to the scenario EC 2030, and the only difference is in the use of the gas-fired units, which results in higher load factors and increased profits for investors. The case GAS 2030 assumes an operation of 3500 hours for CCGT and 1700 hours for NGGT, which improves the economic attractiveness. In the scenario EC 2030, the load factors of gas-fired plants are about 10% for CCGT and 0.7% for NGGT (see Table 1), corresponding roughly to respectively 880 and 60 full hours of operation. The scenario GAS 2030 is representing the case of decentralization in generation and reduced installed capacities.
The model has a perfect forecast of the wind profile, substantiated by further progress in wind forecast techniques [16]. Since the wind power fluctuations are perfectly foreseeable, balancing of wind fluctuations occurs on the day-ahead market.
Sensitivity scenarios test the system flexibility by assuming forecast errors, and alternatively, a lack of wind during one week.
3. Results and discussion
3.1. Power plants dispatching in 2030
Table 2 presents the main results, here aggregated, such as the annual generation and annual load factors. The technology energy mix obtained for 2030 is composed of similar shares in the total power generation between the two scenarios EC 2030 and GAS 2030 for nuclear 70%, hydro 9%, coal 1%, oil 0.1%, wind 11%, solar 2% and biomass 1%. Harder constraints set on gas-fired capacity in the scenario GAS 2030 enhance a different dispatching of power plants, which results in less gas and more CHP-based power generation, as well as in additional storage discharge. More power is generated in the GAS 2030 case, in order to fuel the storage plants and to offer the missing flexibility due to lower gas capacity. Consequently, the load factor of storage technologies increases by 13% between the two cases.
In both scenarios, the wind power generation amounts to 70 TWh in 2030 for an installed capacity of 28 GW, and represents 11% of the total power generation. Wind curtailment occurs occasionally when ramping rates and minimum operational levels constrain the system, but attains low levels over the year (1.3 GWh in the EC 2030 case and 4.9 GWh in GAS 2030 case). In the case GAS 2030, the wind curtailment occurs eight times during the year and enhances a decrease in the spot price down to zero during those events. The low number of curtailments implies that the system is flexible enough to integrate the wind power, due mainly to the nuclear power capacity to follow the load and to the flexibility of hydro and gas-fired technologies.
Genera tion Annual Load Generat ion Annual Load Genera tion Annual Load GWh % GWh % GWh % Nuclear Old 432592 78% 78% 319845 90% 49% 319845 90% 49% Nuclear New 137075 90% 21% 137075 90% 21% Coal 24680 27% 4.5% 5824 53% 1% 5824 53% 1% Hydro RoR 26860 30% 4.8% Hydro Lake 35999 30% 6.5%
Oil steam turbine 5829 9% 1.1% 0 0
Oil gas turbine 345 9% 0.1% 461 0.8% 0.1% 461 0.9% 0.1%
CCGT 5895 76% 1% 14782 10% 2% 8787 40% 1.3% NGGT 2739 76% 0.5% 470 0.7% 0.1% 1984 19% 0.3% Biomass 196 5% 0.04% 6712 30% 1.0% 6712 30% 1.0% CHP 13493 23% 2.4% 19507 30% 3.0% 23605 36% 3.6% Wind On-shore 5727 19% 1% 43608 26% 6.7% 43608 26% 6.7% Wind Off-shore 27045 34% 4.1% 27044 34% 4.1% Solar 9 8% 0% 13638 14% 2.1% 13638 14% 2.1% Other RES 5807 38% 0.9% 5820 38% 0.9% Total Generation, GWh 554362 652170 651782 Storage 2467 7% 3638 10% 4776 0% Imports 9135 7% 2% 8000 5% 1% 8000 1% 1% Export, GWh (input) 58689 11% 46951 7% 46951 7% Net imports, GWh -49554 -38951 -38951 GAS 2030 Technology Share in the total Generat ion 9% 31% 57379 Share in the total Generat ion 31% 57398 EC 2030 Share in the total Generat ion 9% 2008
Note. Hydro power units are aggregated in one technology in 2030, due to memory constraints.
The scenario EC 2030 records low load factor rates of gas-fired units, which would decrease the profit rate of investors and their incentives to keep operational the entire capacity. To reverse this trend, the scenario Gas 2030 assumes a lower installed gas-fired capacity, which would improve the use and the economics of gas-based units. In support to the scenario EC 2030, it is to be noticed that by 2016, France will develop a market that would compensate utilities for maintaining spare capacity; this would prevent the retirement of unprofitable power stations with low load factors due to increased renewable installed capacities [25].
3.2. Assessment of system flexibility in 2030
The French nuclear power, with an annual load factor of ~78%, is low when compared with other countries†, due to the French specificity to use the nuclear power for baseload, semi-base load and regulation provision. Some 46 nuclear power units are endowed with additional control rods for load-following [17] which allow nuclear to play a more active role in providing regulation [13].
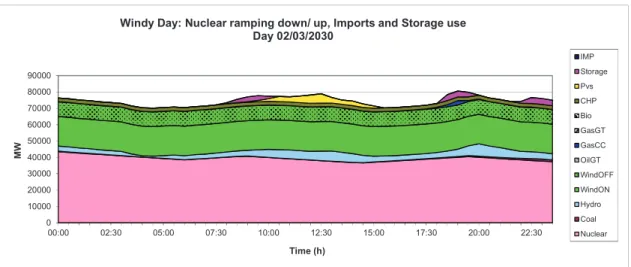
Figure 1 illustrates the dispatching of power plants during the 48 half-hour time slices of a weekday (Friday) with a significant wind power infeed. The favourable position of wind power in the merit order curve makes the system dispatch the wind-based technology in substitution to other alternatives. The nuclear power is crowded out during
low demand at the beginning of the day with a pace within the range ±1% between two half-hour time slices. With the demand increase during that day, the nuclear power is triggered up. Until it gets full power, other options are activated, such as gas-fired units and storage discharge. At noon, PV power generation replaces these peak technologies. Fig. 1. Power plants dispatching during a windy day, scenario EC 2030
0 10000 20000 30000 40000 50000 60000 70000 80000 90000 00:00 02:30 05:00 07:30 10:00 12:30 15:00 17:30 20:00 22:30 M W Time (h)
Windy Day: Nuclear ramping down/ up, Imports and Storage use Day 02/03/2030 IMP Storage Pvs CHP Bio GasGT GasCC OilGT WindOFF WindON Hydro Coal Nuclear
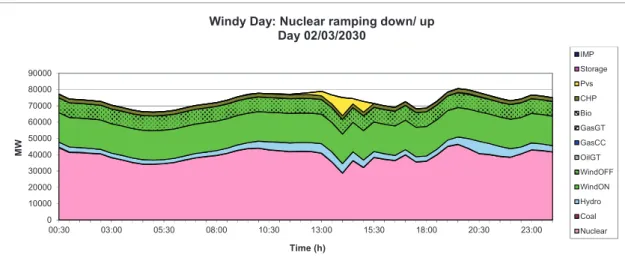
In Table 3, real data recorded for nuclear power in 2008 shows that the average is of 172 MWh/2 for the downward variation and of 190 MWh/2 for the upward variation. These levels increase by 2030 in EC 2030 case to 468 MWh/2 and to 461 MWh/2 respectively. For ramping rates higher than the level chosen for these simulations (1%), the wind power variability would increase the speed of up- and down-ward variations as shown in the Annexe 1. For instance, if ramp rates are allowed to be lifted toward ± 6%, the number of ramping events becomes more distributed over the range of ramp rates (i.e., 0-1%, 1-2%, etc.). This implies that a more flexible nuclear system would be more effective at reducing the variable supply. By 2030, the load factor increase from 78% in 2008 to 90% which enhances a less flexible nuclear power system. Figure 2 shows the system reaction during the same day as in Fig 1, but considering no ramping constraints on nuclear reactors.
0 10000 20000 30000 40000 50000 60000 70000 80000 90000 00:30 03:00 05:30 08:00 10:30 13:00 15:30 18:00 20:30 23:00 M W Time (h)
Windy Day: Nuclear ramping down/ up Day 02/03/2030 IMP Storage Pvs CHP Bio GasGT GasCC OilGT WindOFF WindON Hydro Coal Nuclear
Table 3. Nuclear power statistics from real data and from model simulations: the number # of fluctuations in the range ±6%; and average variations (MWh/2)
Model EC2030, ramp < 2% Model GAS2030, ramp < 2% Test EC 2030, ramp = 100%
Ramp % # Ramp % # Ramp % # Ramp % # Ramp % #
~ 6 1 ~ 6 49 ~ 6 0 ~ 6 0 ~ 6 944 5, 6 7 5, 6 92 5, 6 0 5, 6 0 5, 6 280 4, 5 13 4, 5 68 4, 5 0 4, 5 0 4, 5 403 3, 4 37 3, 4 97 3, 4 0 3, 4 0 3, 4 614 2, 3 115 2, 3 189 2, 3 0 2, 3 0 2, 3 704 1, 2 642 1, 2 690 1, 2 5256 1, 2 5136 1, 2 887 0, 1 7549 0, 1 7271 0, 1 881 0, 1 848 0, 1 1226 ~-6 1 ~-6 70 ~-6 0 ~-6 0 ~-6 960 -6, -5 3 -6, -5 112 -6, -5 0 -6, -5 0 -6, -5 307 -5, -4 2 -5, -4 51 -5, -4 0 -5, -4 0 -5, -4 463 -4, -3 32 -4, -3 79 -4, -3 0 -4, -3 0 -4, -3 656 -3, -2 139 -3, -2 181 -3, -2 0 -3, -2 0 -3, -2 861 -2, -1 515 -2, -1 549 -2, -1 5189 -2, -1 5028 -2, -1 1241 -1, -0 8119 -1, -0 7800 -1, -0 842 -1, -0 849 -1, -0 1287 % MWh/2 % MWh/2 % MWh/2 % MWh/2 % MWh/2
Min -6.4% -2783 Min -6% -2861 Min -1.4% -751 Min -1.4% -751 Min -26% -11938
Average down -0.4% -171.8 Average down -1% -268 Average down -1.2% -583 Average down -1.2% -581 Average down -3% -1701
Average up 0.4% 190 Average up 1% 282 Average up 1.2% 573 Average up 1.2% 571 Average up 4% 1942
MAX 6.4% 2554 MAX 6% 2648 MAX 1.4% 741 MAX 1.4% 741 MAX 56% 14164
Effective Generation, Data
RTE 2008 2008, ramp allowed = 6%
Model
In theory, an EPR can load-follow within the range of 25-100% of nominal full power and is designed to change load at most twice per day. A ramping rate of 5% per minute going from 25 to 100% of capacity can be achieved, but would be limited to 100 cycles a year [19].
In practice, data might be different at a system level compared to individual technology parameters. If some equipment can increase their power very quickly, in practice, grid codes and economic costs induce lower ramp rates than the technical potential. In this model, ramping operations are not monetized, while in practice additional monitoring and mechanical constraints would be expected to increase plant costs [17]. Technical aspects add to factors reducing the load factor, since the load-following induces more frequent maintenance and reduces the availability of nuclear power plants. This induces a cost in the system, due to accumulated damages from erosion, fatigue and corrosion, and to additional operations such as the treatment and the discharge of the water. Therefore the ramping rates in this model are fixed at ±1% by 2030, taking into account the statistics of
nuclear power in the base year, the results simulations for different ramping values and the high load factor recorded in 2030.
From a market perspective, the power price is set at the equilibrium between supply and demand and is the marginal cost of producing the last unit of electricity. Table 4 shows the prices obtained with the model on spot and reserve power markets. The GAS 2030 scenario shows a lower price on average (23 €/MWh in GAS 2030 against 29 €/MWh in EC 2030 case) due to lower gas consumption (-28%). The power price is based on variable operational cost and on fuel costs, therefore, when it is activated, the gas-fired technology is the marginal plant setting the power price. The peak prices are higher in GAS 2030 case than in EC 2030, due to the market tensions created by lower installed capacities.
Table 4. Prices on the day-ahead and balancing markets Generation / Prices Day-ahead PR+ PR- SR+ SR- TR+ TR- Day-ahead PR+ PR- SR+ SR- TR+ TR-Total Volume, GWh 652,202 1,082 1,796 187 232 201 1.1 651,801 1,082 1,796 187 232 201 1 Peak Load, MW 107,489 2,219 2,727 782 655 1,195 200 109,229 2,219 2,727 782 655 1,195 200 Average Price, €/MWh 29 30 24 30 29 30 22 23 25 20 25 29 25 29 Maximum Price, €/MWh 38 38 37 37 37 38 22 48 42 37 42 37 39 37 Minimum Price, €/MWh 0.00 1.2 4.4 1.2 22.1 1.2 22.1 0 1.2 4.2 1.2 4.4 1.2 4.4 EC 2030 GAS 2030
Note: PR, SR and TR represent primary, secondary and tertiary reserves respectively while +/– correspond to the positive and negative regulations.
The balancing market price could be underestimated by the assumption that the operators can continuously make the trade-off between the day-ahead market and the balancing/ real-time market. Within this design, the generator can make a choice to allocate its supply as an ancillary service or as energy as in [20]. If the arbitrage between markets was not possible, a higher margin of reserve would be necessary to ensure the liquidity on both markets at each moment and would result in lower levels of capacity factors. The comparison between the EC and GAS scenarios is similar to the trade-off between more flexibility and more efficiency. Several areas are exploited currently in France, at the demand level within smart grid and green city projects; on the supply side, with energy storage applications; and in the trade design, through interconnections and by moving the adjustment mechanism closer to the real-time [12].
3.3. Sensitivity tests
Two sensitivity tests were conducted: a forecast error test (3.3.1) and no wind case (3.3.2). Since the GAS 2030 scenario has lower market liquidity, this scenario is taken further to understand the sensitivity to different wind power profiles. The model tests the system capability to provide positive regulation only. For negative forecast errors, wind power curtailment can occur, since this wind excess is considered to be imputable to the wind power operator and not to the market itself.
3.3.1 The forecast error test analyses the flexibility of the system for short-term wind power variations. Assuming forecast errors during a 6 hour period, the test simulates the
system reaction to a lower wind power level, by 5% than predicted. This downward variation is balanced differently by the market according to the duration. During the first half-hour, primary and secondary reserves are activated, the next half-hour the secondary reserve only is still active, the next hour tertiary reserves substitute the secondary reserve, and finally, for the next four hours, balancing needs are provided by the spot market. The test selects a day with high power demand (11th of January, during a weekday-Friday) and high wind potential to evaluate the forecast errors from 16:00 to 22:00.
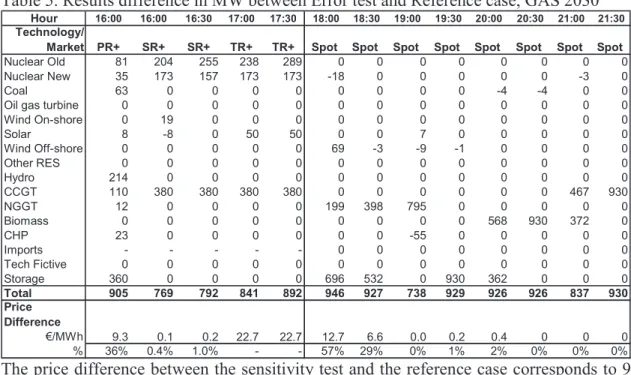
Table 5 shows the variation by technology for each market segment between the error test and the reference case. The test results in additional regulation requirements of 905 MW on the primary market, and in average 770 MW for secondary adjustment, 850 MW on the tertiary market and 900 MW on the spot market. The reference hour listed in the table is the beginning of the 30 minute period (e.g., 21:30 to 22:00).
Table 5. Results difference in MW between Error test and Reference case, GAS 2030
Hour 16:00 16:00 16:30 17:00 17:30 18:00 18:30 19:00 19:30 20:00 20:30 21:00 21:30
Technology/
Market PR+ SR+ SR+ TR+ TR+ Spot Spot Spot Spot Spot Spot Spot Spot
Nuclear Old 81 204 255 238 289 0 0 0 0 0 0 0 0
Nuclear New 35 173 157 173 173 -18 0 0 0 0 0 -3 0
Coal 63 0 0 0 0 0 0 0 0 -4 -4 0 0
Oil gas turbine 0 0 0 0 0 0 0 0 0 0 0 0 0
Wind On-shore 0 19 0 0 0 0 0 0 0 0 0 0 0 Solar 8 -8 0 50 50 0 0 7 0 0 0 0 0 Wind Off-shore 0 0 0 0 0 69 -3 -9 -1 0 0 0 0 Other RES 0 0 0 0 0 0 0 0 0 0 0 0 0 Hydro 214 0 0 0 0 0 0 0 0 0 0 0 0 CCGT 110 380 380 380 380 0 0 0 0 0 0 467 930 NGGT 12 0 0 0 0 199 398 795 0 0 0 0 0 Biomass 0 0 0 0 0 0 0 0 0 568 930 372 0 CHP 23 0 0 0 0 0 0 -55 0 0 0 0 0 Imports - - - 0 0 0 0 0 0 0 0 Tech Fictive 0 0 0 0 0 0 0 0 0 0 0 0 0 Storage 360 0 0 0 0 696 532 0 930 362 0 0 0 Total 905 769 792 841 892 946 927 738 929 926 926 837 930 Price Difference €/MWh 9.3 0.1 0.2 22.7 22.7 12.7 6.6 0.0 0.2 0.4 0 0 0 % 36% 0.4% 1.0% - - 57% 29% 0% 1% 2% 0% 0% 0%
The price difference between the sensitivity test and the reference case corresponds to 9 €/MWh on the primary regulation market, and is negligible on the secondary market. The price difference on the tertiary reserve market corresponds to the equilibrium price itself, because the demand for tertiary services is zero during this period in the reference case. On the spot market, the price difference is higher during the first half-hour since the decrease in wind power potential enhances the rescheduling of power plants, and exerts a tension on the market equilibrium. At the end of the test period, the shock is completely absorbed on the spot market, as the price differential becomes zero.
By technology, it has to be noticed the activation of power plants which were already operational – nuclear, coal, CCGT and CHP; and that only NGGT, hydro and storage act as reserves. Solar power is also used for tertiary regulation during an evening time simulation, and corresponds to reliable provision based on concentrated solar power provision. Storage and NGGT are also bidding in the spot market due to price increase
which makes transactions attractive. Imports are not modelled as an option for real-time balancing purpose in order to estimate the capability of the generation system itself to balance the wind forecast errors.
The system has proved the robustness to balance wind forecast errors during 6 hours. The way this capability could be aggregated over the entire year depends on the frequency of the event. The balancing need could be satisfied if the event would have by assumption a daily basis frequency. Limits are however to be highlighted, for nuclear power with concern to the load factor in particular, since it attains already a high level (90%); and for hydro-power, since its generation is constrained by resource availability. Alternatives such as CCGT, NGGT and storage by contrast would still have a large capacity to increase their use over the entire year. For pumped hydro storage technology, the potential of high number of cycles allows for increased capacity factors which could moreover increase the storage investment profitability [21].
3.3.2 No wind case tests the capacity of the system to react during one week without wind from 26th of February to 4th of March. This amounts to a loss of wind power of 3.2 TWh over the entire week between the reference case, GAS 2030, and the No Wind Test. Results show that the system offsets the wind power by using following technologies with their respective shares in the total compensated generation: nuclear (47%), coal (4%), oil (1.5%), CCGT (8%), NGGT (3%), biomass (8%), PVS (5%), CHP (8%), imports (10.5%), and other renewables (5%).
Figure 3 shows the spot price difference between a day with significant wind power generation and the same day without wind at all. Results highlight a price difference in range of 1-21 €/MWh during the study day. If extended for a week then the difference ranges from 1-26 €/MWh with an average of 9.6 Euros between the two cases. This is in line with experiences in other European countries with similar rates of wind penetration such as assumed here, showing a price decrease in range of 3-23 €/MWh [22; 23].
Fig. 3. Spot price difference in cases with and without wind, in the scenario GAS 2030
Spot price sensitivity to wind
Day 2nd March 2030 0 5 10 15 20 25 30 35 40 00:30 03:00 05:30 08:00 10:30 13:00 15:30 18:00 20:30 23:00 Tim e (h) € /M W h No Wind Case Wind Case
The scenario GAS 2030 proves the system flexibility to balance forecast errors and wind power variations. These effects should be analyzed in relationship with the relatively low level of variable renewables, 13%. Wind and solar decrease the use of thermal generators but they could still remain synchronized to the grid and activated according to the resources variability, which avoids additional investments in back-up capacities.
4. Conclusions
The study shows by means of a dynamic optimization model that operating the French power system with 28 GW of wind power (or 11% of the total generation) by 2030 seems technically feasible for the infrastructure documented in EC [10]. But successful wind integration relies heavily on three factors: 1) the capacity of nuclear reactors to follow variations, 2) storage applications to insure flexibility and 3) market capacity to allow generators to adapt continuously to the demand. Simulations show that balancing the wind power variations is an issue of ramping rates and of unit scheduling.
This study shows that the nuclear power operating at higher load factors (90%) by 2030 as stated in EC [10] is not conflicting with the variable nature of wind power. Given the French fleet of nuclear reactors capability to follow the load, the wind power is almost entirely integrated by the system, as only a negligible share of wind power is curtailed (0.002% of the wind power generated). Further research would be necessary to estimate the value of the flexibility provided with the nuclear power in the French power system; this would improve the economics of nuclear power and the profitability of using the nuclear power to balance the wind power variation.
The market design by 2030 would influence the cost and the mechanism of balancing the wind power fluctuations. Today, intra-day mechanisms that allow rescheduling power plants still remain inflexible to an extent. Market regulation is changing by extending the balancing areas and by opening the market to more operators. Balancing wind fluctuations result in extra costs on real-time and day-ahead markets. To date, the major French generation operator, Electricité de France, EdF, is not paid for the provision of balancing services due to wind power variations, since these costs remain very low. This could become an issue at higher wind penetration rates, requiring in the future the internalisation of balancing costs into the power price. Concluding however on the way the wind power impacts the system cost should at the same time account for the influence that the wind power would have on the nuclear power industry in terms of ramping costs. The current liberalization of the electricity markets raises challenges for the market organization. If more centralized markets concentrate trades and increase market liquidity, the decentralization instead would decrease the ability to optimize the use of capacities. The choice of the optimal technology mix will be based on the trade-off between more flexible systems and more efficient ones. The system will need a different market design such as the ongoing capacity market development, and new technologies and solutions such as smart grids, demand-side management, interconnections, distributed generation and power storage applications.
References
1. European Commission: Offshore Wind Energy: Action needed to deliver on the Energy Policy Objectives for 2020 and beyond, COM (2008) 768.
2. NRAP, National action plan for the promotion of renewable energies. 2009-2020; 2009.
http://ec.europa.eu/energy/renewables/action_plan_en.htm
3. Gross R, Heptonstall P, Anderson D, Green T, Leach M, Skea J. The Costs and Impacts of Intermittency: An assessment of the evidence on the costs and impacts of intermittent generation on the British electricity network, UK Energy Research Centre, 2006.
4. Purvins A, Zubaryeva A, Llorente M, Tzimas E, Mercier A. Challenges and options for a large wind power uptake by the European electricity system. Applied Energy 2011; 88:1461-9.
5. Traber T, Kemfert C. Gone with the wind? – Electricity market prices and incentives to invest in thermal power plants under increasing wind energy supply, Energy Economics 2011; 33:249-256.
6. Holttinen H. Impact of hourly wind power variations on the system operation in the Nordic countries. Wind Energy 2005; 8:197–218.
7. Goransson L, Johnsson F. Dispatch modeling of a regional power generation system – Integrating wind power, Renewable Energy 2009; 34:1040–1049.
8. Pandzic H, Kuzle I, Capuder T. Virtual power plant mid-term dispatch optimization. Applied Energy 2013; 101:134-141.
9. Maurer C, Krahl S, Weber H. Dimensioning of secondary and tertiary control reserve by probabilistic methods, European Transactions on Electrical Power 2009; 19:544-552.
10. European Commission. EU Energy Trends to 2030 – update 2009, 2010.
http://ec.europa.eu/energy/observatory/trends_2030/doc/trends_to_2030_update_2009.pdf
11. Linares P, Conchado A, The economics of new nuclear power plants in liberalized electricity markets, Energy Economics 2013; 40 (S1): S119-S125.
12. IEA, Energy Policies of IEA Countries. France, 2009 Review
http://www.iea.org/textbase/nppdf/free/2009/france2009.pdf.
13] Bruynoogh, C, Eriksson A, Fulli G. Load-following operating mode at Nuclear Power Plants (NPPs) and incidence on Operation and Maintenance (O&M) costs, JRC Report, 2010.
14. Loisel R. Power system flexibility with electricity storage technologies: a technical-economic assessment of Compressed Air Energy Storage, International Journal of Electrical Power & Energy Systems 2012; 42:542-552.
15. Thiel C, Perujo A, Mercier A. Cost and CO2 aspects of future vehicle options in Europe under new energy policy scenarios. Energy Policy 2010; 38:7142-7151.
16. EWEA. Large scale integration of wind energy in the European power supply: analysis, issues and recommendations, 2005.
17. Pouret L, Buttery N, Nuttall WJ. Is nuclear power inflexible?. Nuclear Future 2009; 5:333-341.
18. Shropshire DE, Williams KA, Boore WB, Smith JD, Dixon BW, Dunzik-Gougar M et al. Advanced Fuel Cycle Cost Basis, Idaho National Laboratory, 2009.
19. AREVA, Preconstruction Safety Report, Sub-chapter 1.2, General description of the unit, UKEPR Issue 01, 2009. http://www.epr-reactor.co.uk/.
20. Farahmand H, Doorman GL. Balancing market integration in the Northern European continent. Applied Energy 2012; 96:316–326.
21. Loisel R, Mercier A, Gatzen C, Elms N, Petric H. Valuation Framework for Large Scale Electricity Storage in a Case with Wind Curtailment. Energy Policy 2010; 38:7323-7337.
22. EWEA. Wind energy and electricity prices. Exploring the merit order effect, Poyry; 2010. http://www.ewea.org/fileadmin/ewea_documents/documents/publications/reports/MeritOrder.pdf. 23. Bach PF. The Effects of Wind Power on Spot Prices, Renewable Energy Foundation, London, 2009.
24. European Commission, Electricity Storage in the Power Sector in Technology Map of the SET-Plan, JRC-SETIS Work Group, EUR 24979 EN - 2011, http://setis.ec.europa.eu/about-setis/2009-technology-map-final-draft/2011_Technology_Map1.pdf/view.
25. ACER, The Agency for the Cooperation of Energy Regulators, Capacity Remuneration mechanisms and the internal market for electricity, Report July 2013.
Annex 1. Simulations results for different ramping rates for nuclear power generators in the scenario EC 2030
Ramp rate < 1% Ramp rate < 2% Ramp rate < 3% Ramp rate < 4% Ramp rate < 5% Ramp rate < 6%
Ramp up % # Ramp down % # Ramp up % # Ramp down % # Ramp up % # Ramp down % # Ramp up % # Ramp down % # Ramp up % # Ramp down % # Ramp up % # Ramp down % # 5, 6 0 -6, -5 0 5, 6 0 -6, -5 0 5, 6 0 -6, -5 0 5, 6 0 -6, -5 0 5, 6 0 -6, -5 0 5, 6 1349 -6, -5 977 4, 5 0 -5, -4 0 4, 5 0 -5, -4 0 4, 5 0 -5, -4 0 4, 5 0 -5, -4 0 4, 5 1926 -5, -4 1551 4, 5 399 -5, -4 466 3, 4 0 -4, -3 0 3, 4 0 -4, -3 0 3, 4 0 -4, -3 0 3, 4 2876 -4, -3 2450 3, 4 556 -4, -3 646 3, 4 603 -4, -3 671 2, 3 0 -3, -2 0 2, 3 0 -3, -2 0 2, 3 4342 -3, -2 4090 2, 3 613 -3, -2 852 2, 3 705 -3, -2 911 2, 3 702 -3, -2 905 1, 2 0 -2, -1 0 1, 2 5256 -2, -1 5189 1, 2 686 -2, -1 873 1, 2 989 -2, -1 1239 1, 2 1165 -2, -1 1362 1, 2 1191 -2, -1 1421 0, 1 6471 -1, 0 6405 0, 1 881 -1, 0 842 0, 1 895 -1, 0 948 0, 1 1259 -1, 0 1372 0, 1 1309 -1, 0 1399 0, 1 1267 -1, 0 1346 Footnotes
1http://www.suivi-eolien.com/ (website last accessed on 17/10/2012)
2
http://epp.eurostat.ec.europa.eu/ (last accessed on 17/10/2012)
3
www.gams.com/dd/docs/solvers/cplex.pdf
4
www.rte-france.com (website last accessed on 17/10/2012).
5
http://epp.eurostat.ec.europa.eu/ (last accessed on 17/10/2012)
6
http://setis.ec.europa.eu/ (website last accessed on 17/10/2012)
7