UNIVERSITÉ DE MONTRÉAL
CANADA’S TRADE FLOWS OF ELECTRONIC WASTE: MAPS AND
TRENDS
BAHRAM VAKILIAN
DÉPARTEMENT DE MATHÉMATIQUES ET DE GÉNIE INDUSTRIEL ÉCOLE POLYTECHNIQUE DE MONTRÉAL
MÉMOIRE PRÉSENTÉ EN VUE DE L’OBTENTION DU DIPLÔME DE MAÎTRISE ÈS SCIENCES APPLIQUÉES
(GÉNIE INDUSTRIEL) DECEMBER 2014
UNIVERSITÉ DE MONTRÉAL
ÉCOLE POLYTECHNIQUE DE MONTRÉAL
Ce mémoire intitulé :
CANADA’S TRADE FLOWS OF ELECTRONIC WASTE: MAPS AND TRENDS
présenté par : VAKILIAN Bahram
en vue de l’obtention du diplôme de : Maîtrise ès sciences appliquées a été dûment acceptée par le jury d’examen constitué de :
M. MARGNI Manuele, Doctorat, président
Mme BERNARD Sophie, Ph. D., membre et directeur de recherche M. WARIN Thierry, Ph. D., membre et codirecteur de recherche M. JOANIS Marcelin, Ph. D., membre
DEDICATION
This thesis is dedicated to my parents for their love, endless support and encouragement.
ACKNOWLEDGEMENTS
I am heartily thankful to my supervisor, Assistant Professor Sophie Bernard and co-supervisor, Associate Professor Thierry Warin, whose encouragement, guidance and support from the initial to the final level enabled me to develop an understanding of the subject.
I would like to dedicate this work to my beloved parents Mohammad, Anis, my sister Bita, and my brother Kian who always believed in me, were always there for me and will always be whenever I need them and specially my grandmother Eshrat who passed away a long time ago but whose spirit is always with me.
Lastly, I offer my regards and blessings to all of those who supported me in any respect during the completion of the project.
RÉSUMÉ
Avec les avancées technologiques et l'utilisation généralisée des dispositifs électroniques, le sujet des rebuts électroniques comme l’une des sources de déchets avec la croissance la plus rapide au monde, particulièrement en Amérique du Nord, a été largement souligné dans les cercles politiques et académiques.
L’étude porte sur ce sujet dans un contexte canadien et pose l’hypothèse selon laquelle il est largement admis que les pays développés exportent leurs rebuts électroniques vers les pays en développement; le Canada serait donc un exportateur de déchets électroniques vers ces pays.
Afin de répondre à la question de recherche et soutenir l’hypothèse, l’étude cartographie le réseau Canadien du commerce des déchets électroniques au moyen du code de base de données de l’ONU Comtrade 854810 comme données de substitution pour les années 2013 et 1996 et identifie la tendance au cours de ces périodes. Les partenaires commerciaux, les destinations, avec leur ampleur et leurs directions au cours des différentes années sont également démontrés. En poursuivant l'analyse grâce à l'utilisation de modèles de séries chronologiques, cette étude projette les flux commerciaux pour les années 2014 à 2018.
En outre, cette recherche a évalué les facteurs d’échanges internationaux, y compris les réglementations nationales et internationales, les raisons de ces opérations ainsi que les avantages et les contraintes potentielles.
En conclusion l’étude démontre que l'hypothèse est rejetée; l'analyse des données de substitutions montre que le flux de déchets électroniques du Canada, bien qu'il soit censé être axé vers l'exportation, a été ces dernières années dirigé vers l'importation. Au cours de la dernière décennie, le pays est passé d’exportateur à importateur net de déchets électroniques.
Les projections pour les années 2014 à 2018 démontrent que les importations et les exportations devraient continuer de croître sensiblement au même rythme et qu’à la fin de cette période, la position du Canada sera semblable à celle de l’année 2013 en tant qu'importateur net de déchets électroniques avec trois fois plus d'importation que d’'exportation.
ABSTRACT
By the expansion of technology advancement and the pandemic use of electronic devices among various communities, the topic of electronic waste as one of the most rapidly growing source of waste in different parts of the earth, especially in the North American region has been vastly pointed out in the political and academic circles.
This study focuses on this issue at the Canadian scale in order to answer the hypothesis that it is widely accepted that developed countries export their electronic waste to developing countries; therefore Canada is an exporter of electronic waste to developing countries.
In order to answer the research question and its hypothesis, this study, by means of UN Comtrade database code 854810 as the proxy data, mapped the Canadian e-waste trade network for 2013 and 1996, and identified its trends during these periods. The trade partners and destinations as well as their magnitude and directions in different years have also been shown. By continuing the analysis via the use of time series models, this study has forecasted the short term future of these trade flows from 2014 to 2018.
Furthermore, this research evaluated the international trade factors, including domestic and international regulations, along with the reasons of such trades as well as the benefits and potential limitations.
In conclusion, this research analysis rejected the hypothesis; the analysis on the UN Comtrade database code 854810 shows that the proxies e-waste flow for Canada, despite the fact that it is expected to be more toward export, has been in recent years on the import. In the last decade, the country from a net exporter switched to the net importer of electronic wastes.
The forecasts outcome also shows that the Canadian import and export from 2014 to 2018 are expected to continue rising with almost the same speed, and that by the end of this period, Canada will still stay similar to the latest stage in 2013 as a net importer of the electronic waste with three times more import than export.
TABLE OF CONTENTS
DEDICATION ...III ACKNOWLEDGEMENTS ... IV RÉSUMÉ ...V ABSTRACT ... VI TABLE OF CONTENTS ... VII LIST OF TABLES ... XI LIST OF ABBREVIATIONS AND NOTATIONS ... XV LIST OF APPENDICES ... XVIII
CHAPTER 1 INTRODUCTION ... 1
1.1 Importance of the Study ... 1
1.2 Research Objectives... 1
1.3 Research Questions and Hypothesis... 2
1.4 Thesis Chronology... 3
CHAPTER 2 LITERATURE REVIEW ... 4
2.1 E-waste General Prospect ... 4
2.2 Government of Canada’s E-waste Definition ... 4
2.3 Canada’s Recycling Capacity ... 5
2.5 Electronic Product Stewardship Canada ... 7
2.6 Global Trade Flows and the Waste Haven Hypothesis ... 8
2.7 Basel Convention ... 11
2.8 E-waste Categories ... 14
2.9 Similar Studies... 15
CHAPTER 3 REGULATIONS AND LEGISLATIONS ... 21
3.1 Canada’s Federal E-waste Legislations ... 21
3.2 Canada’s Provincial E-waste Legislations... 22
3.2.1 Ontario ... 22 3.2.2 Quebec ... 24 3.2.3 British Columbia ... 25 3.2.4 Alberta... 26 3.2.5 Manitoba ... 28 3.2.6 Saskatchewan ... 29 3.2.7 Nova Scotia ... 30
3.2.8 Newfoundland and Labrador ... 31
3.2.9 Prince Edward Island ... 32
3.3 Non E-waste Regulated Provinces ... 33
3.4.1 Provincial Legislation Comparison... 33
3.4.2 U.S. vs. Canada ... 37
3.4.3 Canada vs. European Union ... 38
CHAPTER 4 DATA ANALYSIS ... 42
4.1 Collected Data ... 42
4.2 Methodology... 45
4.3 Analysis of the Data... 46
4.3.1 Canada’s e-waste Trade Flow... 47
4.3.2 Canada e-waste Trade Network ... 52
4.3.3 Main Trade Partners... 57
4.4 Illicit Trades ... 60
4.4.1 Reported Data from Different Countries ... 60
4.4.2 Gap Analysis ... 60
CHAPTER 5 FUTURE TRENDS ... 68
5.1 Time Series Model ... 68
5.1.1 Double Exponential Method for Import ... 69
5.1.2 Exponential Growth Trend Model for Import ... 73
5.1.3 Import Model Comparison ... 77
5.1.5 Exponential Growth Trend Model for Export ... 84
5.1.6 Export Model Comparison ... 88
5.2 Discussion and Recommendation ... 91
5.2.1 E-waste Database ... 91
5.2.2 Identified Solutions ... 93
CONCLUSION ... 96
REFERENCES... 98
LIST OF TABLES
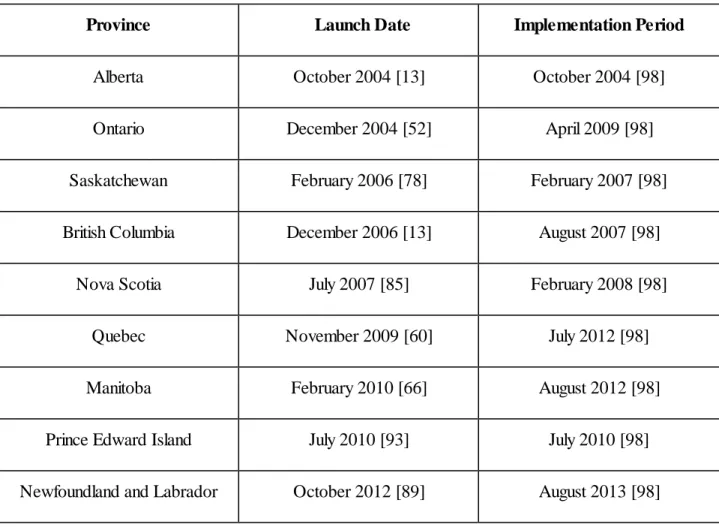
Table 3-1: Provincial launching and implementation time frame differences... 34
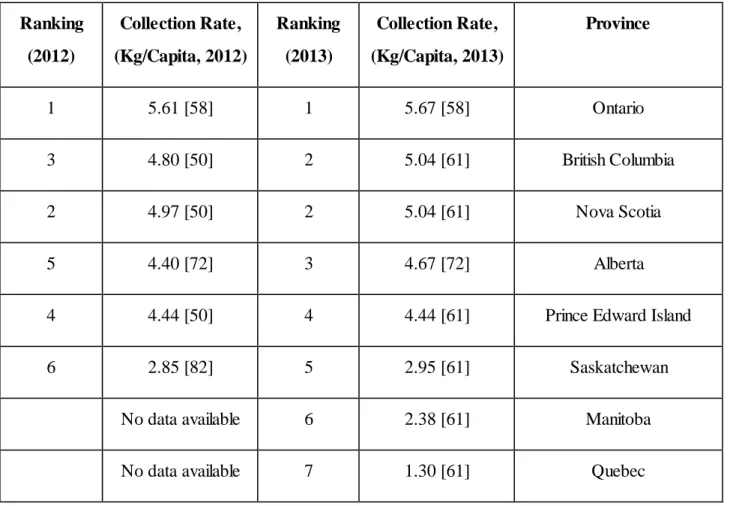
Table 3-2: Provincial end-of-life electronics collection rate ranking for 2012 and 2013 ... 36
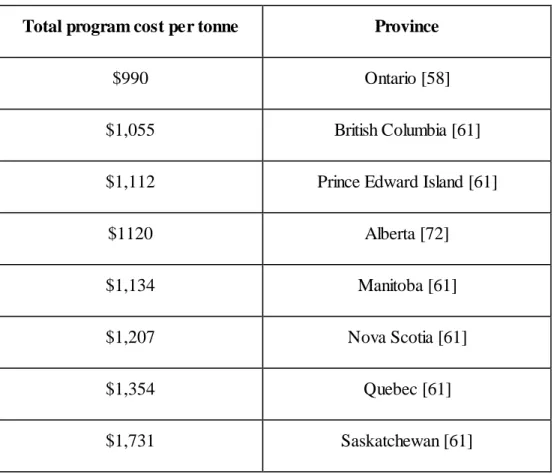
Table 3-3: Provincial total program cost per tonne of collection for 2013 ... 37
Table 4-1: UN Comtrade Dataset Code 854810 Advantages ... 43
Table 4-2: UN Comtrade Dataset Code 854810 Disadvantages ... 44
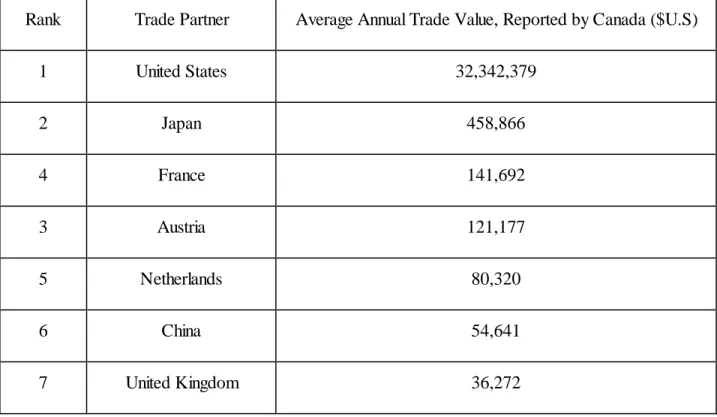
Table 4-3: Canada’s main trade partners with respect to the average annual trade value, from 1996 to 2013 ... 58
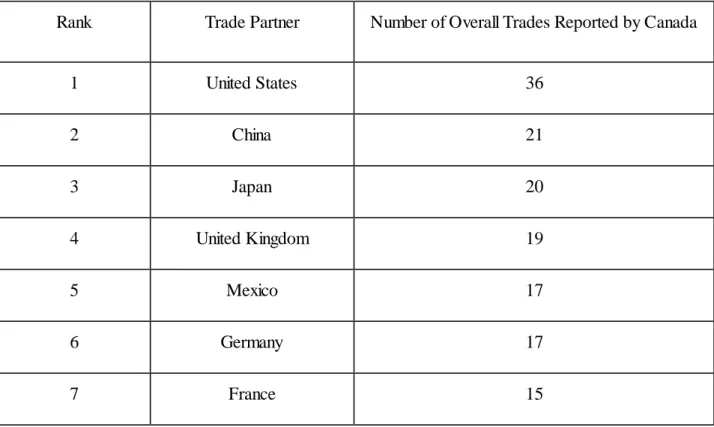
Table 4-4: The main trade partners with respect to the overall number of trades reported by Canada, from 1996 to 2013 ... 59
Table 5-1: Summary and results of the double exponential method for import data ... 71
Table 5-2: Accuracy measurements in double exponential method for import ... 72
Table 5-3: Forecast using the double exponential method for import ... 72
Table 5-4: Summary and results table of exponential growth trend model for import data... 75
Table 5-5: Accuracy measurements in exponential growth trend model for import ... 76
Table 5-6: Forecast using the exponential growth trend model for import ... 76
Table 5-7: Accuracy measurement comparison for import models... 78
Table 5-8: Error measurement comparison for import models ... 79
Table 5-9: Summary and results of the double exponential method for export data ... 82
Table 5-11: Forecast using the double exponential method for export ... 83
Table 5-12: Summary and results table of exponential growth trend model for export data... 86
Table 5-13: Accuracy measurements in exponential growth trend method for export ... 87
Table 5-14: Forecast of exponential growth trend model for export ... 87
Table 5-15: Accuracy measure comparison for export models ... 88
Table 5-16: Error measurement comparison for export models ... 90
Table A-1: [Waste by HS code] © Elsevier, Inc., 2012. Reproduced with permission [25] ... 107
Table D-1: [Specialties and capacities of consumer battery recycling facilities] © Environment Canada, 2013. Reproduced with permission [109, table. ES-2] ... 110
Table E-1: [Capacity of Canadian secondary lead smelters] © Environment Canada, 2013. Reproduced with permission [109, table. ES-3] ... 111
Table G-1: [The main trade partners with respect to the overall number of trade reported by Canada, from 1996 to 2013]... 113
LIST OF FIGURES
Figure 2-1: Global trade in e-waste, 2001 © John Wiley & Sons, Inc., 2010. Reproduced with
permission [44, fig. 1] ... 17
Figure 2-2: Global trade in e-waste, 2006 © John Wiley & Sons, Inc., 2010. Reproduced with permission [44, fig. 2] ... 18
Figure 2-3: The changing geography of global trade in electronic discards, inter-regional trade, 1996-2012 © John Wiley & Sons, Inc., 2014. Reproduced with permission [45] ... 19
Figure 3-1: WEEE collection rate, 2010 © Eurostat, 2013. Reproduced with permission [104]... 40
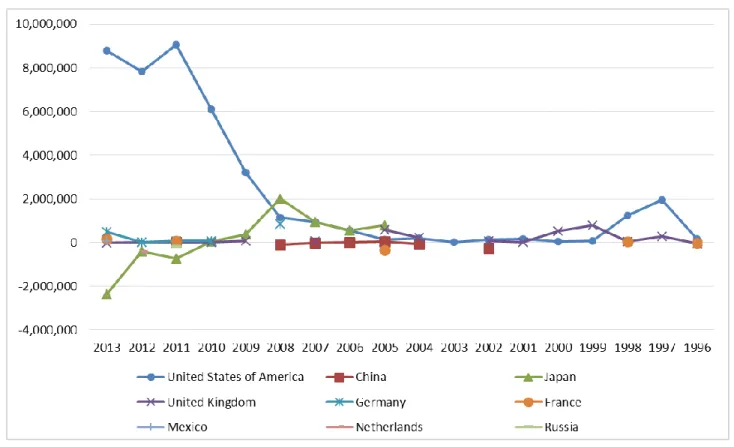
Figure 4-1: Canada’s e-waste trade flow, 1996 - 2013 ... 48
Figure 4-2: Canada’s e-waste trade network, import 2013... 53
Figure 4-3: Canada’s e-waste trade network, export 2013... 54
Figure 4-4: Canada’s e-waste trade network, import 1996... 56
Figure 4-5: Canada’s e-waste trade network, export 1996... 57
Figure 4-6: Canadian imports reported differences with other countries exports reported... 61
Figure 4-7: Canadian exports reported differences with other countries imports reported... 62
Figure 4-8: Canadian imports reported differences with other countries exports reported divided on the average of both parties report’s numbers... 64
Figure 4-9: Canadian exports reported differences with other countries imports reported divided on the average of both parties report’s numbers... 65
Figure 5-1: Fits and Forecasts using the double exponential method for import ... 70
Figure 5-3: Fits and Forecasts using the exponential growth trend model for import ... 74
Figure 5-4: Time series plot of exponential growth trend model for import data with forecasts... 77
Figure 5-5: Residual series of double exponential method and exponential growth trend model for import data ... 80
Figure 5-6: Fits and Forecasts using the Double exponential method for export ... 81
Figure 5-7: Time series plot of double exponential method for export data with forecasts... 84
Figure 5-8: Fits and Forecasts using the exponential growth trend model for export ... 85
Figure 5-9: Time series plot of exponential growth trend model for export data with forecasts... 88
Figure 5-10: Residual series of double exponential method and exponential growth trend model for export data... 91
Figure 5-11: Official and unofficial data collection sources ... 93
Figure B-1: [US Exports of SLABs to Canada, Mexico and all other destinations, 2002–2011] © Commission for Environmental Cooperation (CEC), 2013. Reproduced with permission [108, fig. 3-1] ... 108
Figure C-1: [North American imports and exports of Spent Lead-acid Batteries (SLABs), 2011] © Commission for Environmental Cooperation (CEC), 2013. Reproduced with permission [108, fig. 3-1] ... 109
Figure F-1: [Facilities processing Spent Lead-acid Batteries (SLABs) in Canada and the United States] © Commission for Environmental Cooperation (CEC), 2013. Reproduced with permission [108, fig. 1-1a]... 112
LIST OF ABBREVIATIONS AND NOTATIONS
ACES Atlantic Canada Electronics Stewardship ARMA Alberta Recycling Management Authority BAN Basel Actin Network
BC British Columbia
BOL Bill of Lading
CCME Canadian Council for Ministers of Environment CEA Consumer Electronics Association
CFL Compact Fluorescent Light CPI Consumer Price Index CRT Cathode Ray Tube
CWTA Canadian Wireless Telecommunications Association
EC European Commission
EEE Electronic and Electrical Equipment EFC Electro-Federation Canada
EHFs Environmental Handling Fees EMA Environmental Management Act EPA Environmental Protection Agency
EPEA Environmental Protection and Enhancement Act EPEAT Electronic Product Environmental Assessment Tool EPI Environmental Performance Index
EPR Extended Producer Responsibility
EPRA Electronic Products Recycling Association EPS Electronic Product Stewardship
EPSC Electronic Product Stewardship Canada EQA Environment Quality Act
ESABC Electronic Stewardship Association of British Columbia
EU European Union
GDP Gross Domestic Product
HS Harmonised System
HTB Home Theater in a Box
ITAC Information Technology Association of Canada MAD Mean Absolute Deviation
MAPE Mean Absolute Percentage Error MSD Mean Squared Deviation
OECD Organization for Economic Cooperation and Development OES Ontario Electronic Stewardship
PSPs Provincial Electronic Product Stewardship Programs PWGSC Public Works and Government Services Canada RCC Retail Council of Canada
RCRA Resource Conservation and Recovery Act RCMP Royal Canadian Mounted Police
RECYC Société Québécoise de Récupération et de Recyclage RoHS Restriction of Hazardous Substances
SVTC Silicon Valley Toxics Coalition
SWEEP Saskatchewan Waste Electronic Equipment Program
UN United Nations
WEEE Waste of Electrical and Electronic Equipment WDA Waste Diversion Act
WDO Waste Diversion Ontario
LIST OF APPENDICES
APPENDIX A - WASTE BY HS CODE ... 107
APPENDIX B - US EXPORTS OF SLABS TO CANADA, MEXICO AND ALL OTHER DESTINATIONS, 2002-2011 ... 108
APPENDIX C - NORTH AMERICAN IMPORTS AND EXPORTS OF SPENT LEAD-ACID BATTERIES (SLABS), 2011 ... 109
APPENDIX D - SPECIALTIES AND CAPACITIES OF CONSUMER BATTERY RECYCLING FACILITIES... 110
APPENDIX E - CAPACITY OF CANADIAN SECONDARY LEAD SMELTERS ... 111
APPENDIX F - FACILITIES PROCESSING SPENT LEAD-ACID BATTERIES (SLABS) IN CANADA AND THE UNITED STATES ... 112
APPENDIX G - THE MAIN TRADE PARTNERS WITH RESPECT TO THE OVERALL NUMBER OF TRADE REPORTED BY CANADA, FROM 1996 TO 2013... 113
APPENDIX H - MAPE DEFINITION AND EQUATION ... 116
APPENDIX I - MAD DEFINITION AND EQUATION ... 117
CHAPTER 1
INTRODUCTION
1.1 Importance of the Study
Canada’s environment is effected by electronic waste (E-Waste) and the influence of the defined regulations for its disposal and the export from the country. Based on information from Environment Canada, more than 140,000 metric tonnes of electronic equipment are aggregated in Canadian landfills annually [1, 2], which consist of various electronic products, from phones, televisions, computer equipment, and batteries to small electronic home appliances. It is anticipated that the same size of this landfill’s wastes are exported annually to developing countries recycling operations, due to less expensive labor and recycling processes which is approximately 10 times cheaper than through domestic disposal [3].
Although no such database that shows the e-waste trade flow of the countries through their export and import capacities and their trade partners on a global basis is in existence, Canada is therefore not an exception. Despite this limitation, this research analysis by use of proxy data will show that the e-waste flow for Canada, although expected in the other past literatures, has changed dramatically toward new destinations with lots of trade flow gaps.
Therefore, it is by tracking these trade flows as well as their capacity to each final destination that the economy would profit; this would be done by identifying the illegal trade flows and potential gaps in the current regulations for decreasing illegal trades and domestic disposal. Also, introducing a time series model for forecasting this growth potential based on the available statistics from preceding years with the involved influential trade flow factors could help the government to provide a better recycling infrastructure for confronting this environmental issue in the coming years.
1.2 Research Objectives
The aim of this thesis is to identify the e-waste trade flows of Canada along with its partners, destinations as well as its past, present and future trends. In this way, there are three major objectives defined that have been followed throughout this thesis:
Evaluation of the international trade factors, including domestic and international regulations along with reasons of such trades as well as benefits and potential gaps.
Mapping Canada’s e-waste trade network and characterizing the trade destinations and partners.
With conditions imposed on data, developing a time series model for forecasting the future growth trend potential of Canada’s e-waste.
1.3 Research Questions and Hypothesis
In order to achieve the research objectives, this study will answer the following question and hypothesis: Have there been changes to Canada’s e-waste trade flow in past years and in which direction? Hypothesis: It is widely accepted that developed countries export their electronic waste to developing countries; Canada is an exporter of electronic waste to developing countries.
To answer the above question and hypothesis, the following detailed narrowed down questions need to be answered first:
How should this flow be measured?
Which factors influence this trade flow the most?
What is the short-term future picture of e-waste flow in Canada?
The detailed methodologies adopted for finding the answers for the above questions have been explained in chapters four and five.
1.4 Thesis Chronology
This study is structured in five chapters, starting with the explanation of the importance of this study and its objectives along with its milestones of the achievements and the research questions in the initial section.
In the second part, the issue of e-waste is discussed as a general term, including its definition, variations and identified trade flows, together with its prospect of regulation in the international format. Furthermore, in this section also, the situation of WEEE in Canada along with its challenges, current recycling capacities and the responsible organizations will be evaluated.
In the third chapter, the e-waste legislation and the regulations at the state and the provincial levels are discussed. Furthermore, a detailed view of each provincial regulation, as well as their comparison with each other and with other countries including the European Union and the United States is analyzed. Chapter four will be the core of the database and the methodology used in this study as well as its analysis for identifying and mapping the e-waste trade network of Canada along with its main trade partners. Furthermore, this chapter will look at the identified gaps, their analysis and illegal flows discoveries.
In the fifth and final chapter, the future trend of e-waste in Canada, conducted with the use of two time series models, are analyzed and the short forecast results for five years has been offered for both the import and the export. In this section, recommendations are also provided for the e-waste database issue as well as its potential ways for creation in addition to a few identified solutions discussed for confronting the issue of e-waste at the national level.
The final point of this thesis is a summary of the total findings and the conclusion along with a few recommendations for the future studies in this topic.
CHAPTER 2
LITERATURE REVIEW
2.1 E-waste General Prospect
The debate between developed and developing countries as well as their current and future roles on the world’s global flow map of e-waste has drawn great interest in the political, economic, and academic realms. By expanding the use of electronic items in 21st century, the topic of Electronic Wastes as one of
the hazardous items that negatively affects the environment has been vastly used and discussed in recent years [4]. Despite this cumulative interest, to the best of the author’s knowledge, there have been limited studies done on the trade flow of e-waste in Canada with concentration on the current country’s legislations and import and export trade partners.
Presently, Waste of Electrical and Electronic Equipment (WEEE) is a term which refers to about 900 electronic products in 58 different categories worldwide [5]. This type of waste, which represents about 5% of the total solid waste, is growing faster annually than any other source of municipal waste on the planet [6]. In the United States alone, this expansion is estimated to be 8.6% annually, which is one of the highest expansion rates among developed countries. This is assuming that American municipal waste increases by only 1.2% per year [7]. Luckily, this expansion is slightly lower in Canada since it is estimated to be 4% annually [8]. In this way, the latest statistics for e-waste generated in Canada in 2012, shows a volume of 24.72 kg per inhabitant and 860.74 metric kilotonnes for the entire nation [9]. On the other hand, in 2006 the United Nations (UN) estimated that 20 to 50 million tonnes of e-waste were produced annually worldwide [10]. In 2010, the UN then made the estimation was predicted that there would be a production of 40 to 70 million tonnes by 2015, mainly due to expansion of the role of electronic products in any community lifestyle [11]. In this way, Canada is not an exception and is influenced annually by this expansion.
2.2 Government of Canada’s E-waste Definition
WEEE category has been defined differently among countries. In Canada, the government defines e-waste as the “…surplus electronic and electrical equipment that is not suitable for reuse…” [12].
Based on this definition, any electronics that are no longer reusable fall under the e-waste category. This has slightly become controversial recently due to the fact that the e-waste definition varies among different countries as the time period of using electronic devices has decreased by users due to technological improvements rather than technical problems. Therefore, it is common to see people dispose electronic devices such as mobile phones and laptops, even though they are still usable. These devices have to be considered as e-waste, but because this is not the case, these devices end up in developing countries as second hand electronic devices for reuse purposes.
Furthermore, the government of Canada defines electronic and electrical equipment as “…any
equipment with a plug, battery or that uses electricity to perform its intended function excluding vehicles and vehicle parts…” [12].
2.3 Canada’s Recycling Capacity
By looking through the annual export data, the limited capacity recycling sites compared to the produced e-waste amount per year in Canada can be more obvious. In the province of Ontario, which is the most populated province in Canada, 9.1% out of 14,586,000 household electronic used appliances had been collected for the purpose of reuse or recycling, which consists of information technology and telecommunications equipment’s in 2004; the rest been discarded [13].
On the other hand from an organizational and non-residential perspective, findings from a survey by the Ontario Electronic Stewardship (OES) in 2011 shows that if this province is used as a benchmark for the country’s e-waste problem, two-thirds of businesses do not even have any end of life plan for their electronic products due to the fact that their use of electronic products is expanding each year. The fact that the technology lifecycle changes for these businesses must be taken into account as well because their lifecycles within many organizations is currently between 18 to 36 months due to the constant upgrades, which serves as another direct contributing factor to the production of e-wastes [14]. By considering this fact, it seems reasonable then to accept the estimate that generally about 50 to 80 % of all end life electronic products are exported annually from North American countries to developing countries in Asia and elsewhere instead of being recycled domestically [15].
On the other hand and more specifically on just the mobile phone market, the research by recycle my cell program of Canadian Wireless Telecommunications Association (CWTA) shows, despite this fact that 96% of the all materials used in cell phones are recyclable, only 12% of the country’s cell phones has been recycled [16, 17].
Generally speaking, it is estimated that in Canada itself, out of all produced e-wastes during a given year, only 10% are recycled or refurbished whereas the remaining 90% are disposed into the country‘s landfills [8]. One of the main reasons for this low recycling rate and high disposal rate in landfills which is based on the Electronic Product Stewardship (EPS) in Canada, is the cost of recycling electronic products in the country. This is estimated to be four times more than the use of a landfilling disposal [18]. Therefore, by expanding on this procedure, the risk of the waste percolating into the soil and the water resources as well as negatively influencing nature are heightened and the need for new recycling sites for the long term are essential.
2.4 Regulations
By the start of the 21st century, Canada like most industrial nations, followed the global trend and has
ratified several programs and policies for controlling and monitoring electronic products as well as their end of life cycle in the hopes of transferring the responsibility and financial weight of e-waste disposal and recycling from the users to the producers. In this way, initiatives such as the Electronic Product Stewardship (EPS) program are of paramount importance among effective programs which are intended to extend producers responsibility (EPR) at both the provincial and federal levels. Although the program design changes in different provinces, it generally forces electronic producers to improve the eco-friendliness of their products by eliminating the use of toxic materials such as toxic chemicals in the product [9, 19]. Currently, this program is in effect in nine provinces, including British Columbia, Nova Scotia, Prince Edward Island, Ontario, Saskatchewan, Manitoba, Quebec, Newfoundland and Labrador and Alberta [20].
From a historical perspective, more than half of the Canadian provinces designed their own legislations between 2003 and 2010 for disposable e-wastes [21]. Therefore, due to the fact that Canada’s e-waste legislations are mainly provincial, the comparison of similar legislations from other parts of the world such
as those found in the U.S can be useful in showing significant differences. As an example, in the U.S. one of the traditional systems used for managing the e-waste costs is general tax base funding. In this model, a fixed amount of tax is imposed on all taxpayers for funding the e-waste costs to the entire society [22]. Although this e-waste cost management system does not specify the targeted electronic consumers and producers, it was used in past years among different states and it has only been in recent years that the system has started to change. This shows the recent creativity of this e-waste regulation topic among developed countries especially in the North American region after the expansion of electronic production and consumption. In chapter three, these issues along with the detailed comparison of the Canadian provincial legislations will be evaluated.
2.5 Electronic Product Stewardship Canada
The Electronic Product Stewardship (EPS) is a Canadian non-profit organization established in 2003 from a collaboration effort from the Electro-Federation Canada (EFC) and the Information Technology Association of Canada (ITAC), two fundamental Canadian associations in electronics and technology. The main intent of this establishment was to prepare a platform to serve both governmental and industrial organizations in order to promote, design and implement sustainable effective and efficient solutions for the electronic waste problem in the country. According to claims from the organization, since 2004 more than 380,000 tonnes of e-waste products have been diverted from entering landfills by various recycling programs in throughout many provinces including British Columbia, Alberta, Saskatchewan, Manitoba, Ontario, Quebec, Nova Scotia, PEI, and Newfoundland. Examples of such electronic products include mobile phones, computers, printers, televisions and audio/video devices [18, 20].
The Canadian sections of the leading electronic corporations are the main members of this organization. More than 30 well-known corporations are involved such as IBM, Apple, Dell, Toshiba, Sony, Lenovo, Panasonic, Samsung, Hewlett-Packard (HP), Cisco Systems Inc. and Canon are the main board members, and the associate members consist of Asus, LG Electronics Inc., Microsoft, BenQ America Corp., Ciaratech, NetApp Inc., Northern Micro Inc., EMC Corporation, Epson Cisco Systems Inc., MMD-Philips, Fujitsu Canada Inc., Xerox Canada Ltd., Lexmark Canada Inc., Oracle Inc. and Brother International Corporation (Canada) Ltd. [20].
Since 2006, the organization publishes an annual report for further investigation on an environmentally friendly design of the electronic products each year. The report aims to examine technology developments and changes in different manufacturers and their impact on the recycling and closing loop systems progresses. The report also investigates the hazardous and non-hazardous materials contained in different electronic products and their reuse or recovery yearly change of the technology [20].
In the 2013 report, EPSC claims that the amount collected per capita since the program’s launch was 5.1kg on average, in which, Ontario had the highest amount collected per capita [18].
2.6 Global Trade Flows and the Waste Haven Hypothesis
Through the expansion of industrialization, developed countries have seen greater incentives in recent years to export e-waste to Asia and the other developing countries [23]. The driving factors for these incentives are due to regulatory stringencies and shifting pollution from these industrialized countries to the developing ones, which is widely known as the pollution haven effect [24].
As based on this hypothesis and looking at the international waste haven effects in detail, the waste trade flow leans toward countries with a lower environmental regulation. In other words, the increase in waste imports is directly linked to deterioration in environmental regulations. In general, it is expected that for every percent drop in the environmental regulations in one of the bilateral waste trade partners, the import of the wastes from the other foreign trade partner increases by 0.32%. This issue can be more understandable when taking into consideration that developed countries in average gain from a 39% higher environmental regulation index than the average developing nation’s environmental regulation index [25].
These effects can be even more sensible when combined by the other waste trading facts. The pollution haven effect is also suggesting that by rising the per capita income in a country, the willingness for accepting the foreign hazardous waste in a country decreases [26]. As it is not hard to imagine that in most cases, the so called developed nations are gaining from the higher per capita income and GDP, which makes it easier to guess why a waste trade flow goes towards developing countries rather than developed ones.
On the other hand, it is widely assumed in most of these trading cases, the majority go against international treaties such as the transboundary movement of hazardous waste in the Basel convention which restricts countries for implementing illegal exports other countries [27], and EC legislation (the Waste Shipment Regulation) [28].
As an example, a 2005 study by Greenpeace International in Europe shows that out of 18 European seaports that have been inspected by this organization, 47% of these exported wastes, including e-waste, that were being shipped to various places in the world were taking place illegally [29].
By considering the forecasts for the future prospect of e-waste production, this illegal trade flow can be even further expanded. It is expected that over the next 20 years, a western European household would produce an estimated 900 kg of e-waste, which is the equivalent of about 46 kg per year [30].
On the other hand, it is estimated that in the European Union that around 60% to 75% of all the medium and large-sized appliances are not collected properly annually for recycling purposes; rather, they would be involved in the so called hidden flows, in which a portion ends up being exported into developing Asian and African nations. A possible reason behind this phenomenon, as mentioned before for the other parts of the world and among the industrialized countries, is based on the labor cost; recycling a computer in a country like Sweden would cost about €10 whereas in countries such as India, the same recycling cost would be only €1.5 [28].
In the North American region, most of the flow goes toward Asian countries, the most significant being China. The observations from the Silicon Valley Toxics Coalition (SVTC) in the U.S. and the Basel Action Network (BAN), both of which are non-governmental organizations, showed and predicted that almost 80% of e-wastes in the United States which were collected for the domestic recycling have been exported to the informal recycling sites in developing countries [31]. Although this number compared to the landfills disposal in the country is relatively low, it shows that a great export volume into the other developing countries exists.
Studies from the U.S. Environmental Protection Agency (EPA) from 2003 to 2005 show that about 80 to 85% of the e-waste generated during this period in the United States have been discarded into
landfills; therefore, all these exports is the 80% of the 15% to 20% of the remaining e-waste. The volume of the landfills disposal in 2005 is estimated to be more than 1.36 million metric tonnes [32].
The Asian sector is the major destination of the global e-waste and is therefore an important recycling port. China has a major role in the WEEE trade flow map of Asia, as it is the main importer of the e-waste and, at the same time, is the largest exporter of the electronic equipment’s [33]. The second rank in the region is India which is also the second most populated area in the world. In Delhi, which is the second largest city in India, more than 10,000 to 20,000 tonnes of e-waste has been recorded annually, in which there are more than 25,000 workers are employed on the scrap yards [29].
In Canada this trade is expected to be more toward Asian countries, mainly China. A study by the Basel Actin Network (BAN) team in 2002 shows a large amount of e-waste labeled by different Canadian institutions such as Air Canada, destined from Vancouver, British Columbia to Guiyu, a city in the Guangdong province of China. This shipment consists of e-waste products such as printers and computers, which are the sort of hazardous e-waste products that are banned from being exported under the Basel convention. Canada, as a full member, is expected to refrain from getting involved in these illegal shipments because of its agreement to the convention. BAN estimated that about 20,000 tonnes of e-waste from these kinds of exports has come from just the computer waste sector into the Asian region in 2002 [15].
Also according to a report given by the RCMP, there has been over 500,000 kg of e-waste that has been shipped solely from the port of Vancouver towards developing countries from 2005 onwards [34]. Based on the mentioned reports, it can be expected that with respect to future prospects, this trend of e-waste trade flow will continue or even grow. This study did not find any evidence based on the literature review conducted for Canada or any other developed countries that show information to the contrary. It is widely accepted that waste and e-waste are moving from the developed to the less developing countries.
There are different factors that can explain this issue. A difference between treatment and disposal costs among developed and developing countries can account for part of the reason; however, the fact that it can be due to less restrictive environmental regulations between southern and northern countries that may
cause this issue. A study by Bernard [35], on the second-hand markets shows, strict laws and regulations found in the North that induce Northern firms so that product reusability is reduced. As a result, the flow of non-reusable waste towards the southern regions increases, resulting in a magnification of the pollution haven effect [35].
By analyzing past data and the literature reviewed, it can be seen that Canada, like any other developed country, is expected to be part of the e-waste trade flow to developing countries. The difference for Canada however is that these trades were not traced back to the nation and the driven factors were not analyzed in depth as much as other countries. This is keeping in mind that the amount of e-waste has increased from 2002 as the amount of electronic products has increased in the country. In 2011 alone, Canadians invested more than $11.5 billion in electronic devices, excluding the amounts spent on cellphones and video games [36]. In a tangible technology example of the new generation of electronic products in the country, it was estimated that more than 500,000 tablets were imported in 2010 and that this amount increased threefold to 1,500,000 the year after [37]. There is no doubt that this huge amount of tablets is going to become e-waste in the following years.
Generally speaking, the e-waste issue that the world will face in the future will constantly grow annually, which is evident by way of the many examples that can be illustrated. Based on the Consumer Electronics Association (CEA), the total market revenue of the global electronic products in 2014 is estimated to be around $208 billion. With such revenue, is not unexpected to see producers produce more electronic products and consumers desire to consume more [38]. Therefore by the coming years is not unexpected to see the topic of e-waste is getting more highlighted into the world news headlines.
2.7 Basel Convention
From an historical perspective, the Basel convention is most renowned for its progress in controlling the transboundary movements of hazardous wastes under the mandate of protecting human health as well as the environment from their adverse effects. The first convention took place on the 22nd of March
1989 in Basel, Switzerland, with its actions officially being taken into effect on the 5th of May 1992 [39]. In 1995, the Ban Amendment was adopted to the Convention, prohibiting the export of any hazardous waste from the nations as shown in Annex VII to those nations that are not listed in this
section; this basically comprises of all OECD and European Union countries, including Liechtenstein. From this point forward, this relation will be noted as being among A7 and non-A7 countries [40]. From the initial steps, Canada was one of the first countries who signed the convention on 22nd of
March 1989 and ratified it on 28 August 1992. This is not the case for the other important member of the North American region, the United States which signed the contract but did not ratify it [41].
As per the information at the time of this study, 181 parties are members of the Basel Convention. From these nations, Sao Tome and Principe, and Afghanistan are the two most recent countries who ratified this convention [41].
Canada, as one of the full members to this convention, is therefore required to follow the rules and policies exerted by the convention for the transboundary movements of its hazardous wastes. Some of these general obligations are as follows:
I: In the scope of the convention in article 1, section 1b. of the Basel convention mentions that wastes shall be considered hazardous in the transboundary movements, if “…Wastes that are not covered under paragraph (a) but are defined as, or are considered to be, hazardous wastes by the domestic legislation of the party of export, import or transit…” (Basel convention. Article 1, 1, b) [39].
II: General obligations in article 4 section 1b. for export countries Basel convention mention: “…Parties shall prohibit or shall not permit the export of hazardous wastes and other wastes to the parties which have prohibited the import of such wastes, when notified pursuant to subparagraph (a)...” (Basel convention. Article 4, 1, b) [39].
III: In the other part, general obligations in article 4 section 2d. ask parties to take proper measures for ensuring that “…the transboundary movement of hazardous wastes and other wastes is reduced to the minimum consistent with the environmentally sound and efficient management of such wastes, and is conducted in a manner which will protect human health and the environment against the adverse effects which may result from such movement…” (Basel convention. Article 4, 2, d) [39].
IV: Also, general obligations in article 4 section 2e. ask parties to take proper measures to “…not allow the export of hazardous wastes or other wastes to a State or group of States belonging to an economic organization that are parties, particularly developing countries, which have prohibited by their legislation all imports, or if it has reason to believe that the wastes in question will not be managed in an environmentally sound manner…” (Basel convention. Article 4, 2, e) [39].
The above clauses are a portion of the obligations to which Canada, as a full member of Basel convention must follow. A study on “Exporting Harm: The High-Tech Trashing of Asia, The Canadian Story” from the Basel Convention shows that Canada like other convention members, does not necessarily follow the policies that members are obliged to follow. In some cases, Canada has been in violation of some of them.
As an example, the case of exported e-wastes from Vancouver to China in 2002 contains policies which have been vastly violated by Canada. As the above clauses clearly show, exporter parties are prohibited to export hazardous wastes to other countries if the importer parties prohibits the import of such wastes, in this case, China as the importer prohibited the import of electronic wastes. Canada’s position in this case was to ignore categorizing e-waste under the hazardous wastes; however, even if this is their position as the exporter party, the importer party policies are still important according to the Basel Convention. Therefore, Canada cannot ignore the importer country regulations [15].
Also as the articles (4, 2, d) and (4, 2, e) address clearly, the parties need to take precautions in ensuring that the exported hazardous wastes from their nations are being handled in an environmentally appropriate manner; in the case of 2002, these articles have been violated, as Canada does not took any precaution activities [15].
Although the case that was mentioned above is outdated since it occurred 12 years ago, it is still important to note the lessons learnt from this case because there is always the possibility that similar events could happen in the future. This is true regardless of the fact that many modifications have been done on existing legislations. Also it should be mention that the above clauses are only a small part of the obligations and responsibilities that Canada as a full member needs to follow and there are many more that need to be considered.
2.8 E-waste Categories
E-waste or WEEE covers a wide range of products that contain different materials. These materials can be divided into the hazardous and non-hazardous categories. Each category consists of 1000 different substances ranging from ferrous materials such as iron and steel which account for more than 50% of the e-waste substances to other materials such as plastic accounting for 21% as well as other non-ferrous metals such as gold, silver, aluminum, platinum which account for 13% of the overall substances of the WEEE products respectively [42].
The main type of products are categorized into 10 different sections, each of which contains a wide range of different electronic products. These categories are sorted by United Nations Environmental Program and EU directive as follows [42, 43];
1. Large household appliances: i.e. Refrigerators and freezers 2. Small household appliances: i.e. Toasters and coffee machines
3. IT and telecommunications equipment: i.e. Mobile phones and computers 4. Consumer equipment: i.e. Television sets and video cameras
5. Lighting equipment: i.e. Straight fluorescent lamps and compact fluorescent lamps
6. Electrical and electronic tools (with the exception of large-scale stationary industrial tools): i.e. Tools for welding and soldering
7. Toys, leisure and sports equipment: i.e. Video games and electric toys
8. Medical devices (with the exception of all implanted and infected products): i.e. Radiotherapy and dialysis equipment
9. Monitoring and control instruments: i.e. Thermostats and smoke detectors 10. Automatic dispensers: i.e. Automatic dispensers for hot drinks [42, 43]
One issue that should not be overlooked and must be considered in all of the above categories, especially in the IT and telecommunications sectors, is the effect of hazardous chemical compounds among the 1000 substances which influence the environment, despite a less elevated effect with respect to the other factors. Gallium is one of the 200 different chemical compounds of a mobile phone and is toxic; however, it has not been documented vastly in literature. Few environmental organizations such as Greenpeace in recent years have started to document Gallium as well as other toxic materials that may have been overlooked [28].
2.9 Similar Studies
There are several quantitative and qualitative studies done in this field which have heavily influenced the core of this thesis. This section briefly outlines these studies and their findings.
In similar studies to this topic, Nordbrand [28] investigated the e-waste trade flows from the EU to developing countries. It is a concentrated study on the trade flows of the European countries, especially Sweden, and the export of the second hand goods and the e-waste illegal trade flows to the developing countries.
This paper evaluates the Euro zone policies, and the paper mentioned improvements for these regulations. It also cites illegal movements that occur in different formats such as mislabeled shipments within the import and export countries for covering up and rounding the regulations for the illegal exports, and concludes that factors such as price reduction of the valuable substances such as metal can decrease the motives of the importing countries for receiving the e-waste products.
Furthermore, Nordbrand [28] mentioned that besides all the findings, there is still a further need for future studies on this topic in the international platform for more findings in the e-waste trade flow between EU and the other courtiers.
Another similar study by Rolf et al. [27] was conducted on the global perspectives on e-waste. The paper studied different aspects of waste in the global format from facing challenges by different e-waste categories expansion to environmental problems that may cause in different parts of the world, especially among developing nations such as China, India and South Africa. They studied in detail
various definitions of e-waste as defined by different organizations, and tried to investigate more on the role of managerial approach between developed and developing countries and the effect of domestic and international regulations on the trades between them.
In conclusion, Rolf et al. [27] mentioned three major obstacles in industrial countries that may cause an effect on the management of the end life of products, obstacles such as; lack of reliable data and appropriate international standards and finally lack of a safe WEEE recycling infrastructure.
Furthermore in another series of related studies done by Lepawsky and his colleagues in 2010 [44] and 2014 [45]. Lepawsky and Mcnabb [44] investigated mapping international flows of electronic waste, with the intent of identifying the global e-waste direction in different timing periods. They used the UN COMTRADE database for this analysis and as shown in Figure 2-1 for the year 2001 and in Figure 2-2 for the year 2006, their calculations identified the direction and the changes in the volume of the trade flow between the seven world continents.
In the mapping procedure, Lepawsky and Mcnabb [44] mentioned a few findings that are important to consider. It is important to note that the global volume estimation of the e-waste is a tricky job and it is due to this main reason that there is still a lack of a proper e-waste definition as a trade category. Because of this issue, the trade systems recognized the old and the new computers under a same trade data category, which makes the tracking hard because of the difficulty found in differentiating them. Therefore, it is because of these issues that a proxy measure is required in order to map the international regions where global trade is found to affect e-waste.
Also Lepawsky and Mcnabb [44] conducted tests incorporating the pollution haven hypothesis in order to provide correct reasoning for their observed trends as shown in e-waste with respect to the international trade. There are two ways in which this is done; one way is through the analysis of each nation’s net trade balance on an annual basis against measures of relative wealth and poverty whereas the second way by means of examining each transaction between trading countries in regards to their GDP per capita.
Lepawsky and Mcnabb [44] conclude from the results of their analysis that there are four major findings. Firstly, the complexity of the e-waste global map is more than just a simple export from industrialized to
developing countries. Secondly, with the help of the intra-regional trade volume, which is accounted for largest part of trade flows, e-waste tracing becomes more recognizable. Thirdly, the analysis of the pollution haven hypothesis as done by this paper provides a partial, yet important, explanation of the noted trade patterns. Lastly, their findings show that it is important to conceptualize this topic as open ended whereby it is a function of the geographic differences and the mobility as well as the accessibility for trade and traffic activities in the domains of waste to occur.
Figure 2-1: Global trade in e-waste, 2001 © John Wiley & Sons, Inc., 2010. Reproduced with permission [44, fig. 1].
Figure 2-2: Global trade in e-waste, 2006 © John Wiley & Sons, Inc., 2010. Reproduced with permission [44, fig. 2].
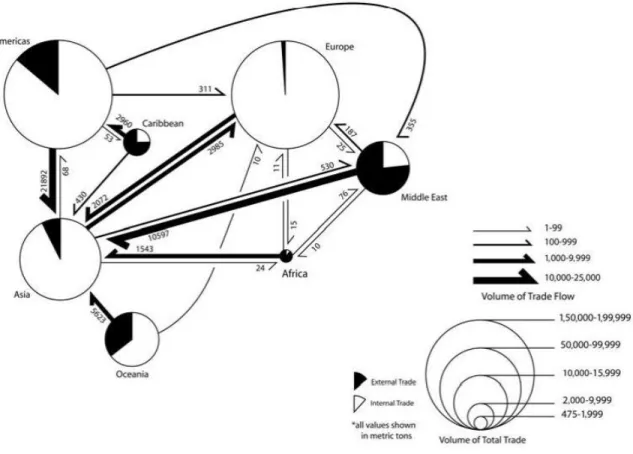
Followed by Lepawsky’s paper in 2010 [44] as well as in another study done entitled “The changing geography of global trade in electronic discards: time to rethink the e-waste problem.” in 2014 [45], Lepawsky continued and expanded his research on the e-waste map at the international level. Lepawsky [45] mapped the global trade flow of e-waste for the two years of 1996 and 2012 in Figure 2-3 by use of UN COMTRADE database for showing the geographical changes of the electronic discards.
This investigation as done by Lepawsky [45] shows that the e-waste direction and magnitude has changed between 206 worldwide territories, from 1996 where the earliest data was retrieved to 2012. Based on the observations, Lepawsky [45] explained two general findings. The first finding was that in 1996, trade flow from developed into developing nations accounted for a little over 35% of total trade at its climax. By 2012, this same trade only represented less than 1% of the total trade. The second finding
was that between the years of 1996 and 2012, these two groups evolved as unique regional trade orientations. What was observed was that developed countries are mostly trading intra-regionally since this accounts for about 73–82% of total trade. This is in direct contrast to what has been observed in developing countries since by 2012, less than one-quarter of these nations have seen their trade being displaced to other developing countries whereas the rest have been transferred to developed countries [45].
Figure 2-3: The changing geography of global trade in electronic discards, inter-regional trade, 1996-2012 © John Wiley & Sons, Inc., 2014. Reproduced with permission [45].
Among similar studies on the regulations and challenges posed by the e-waste issue in different countries involving Canada, research from Sabaa [46] on the “Electronic Waste Governance: Sustainable Solution to a Global Dilemma” should additionally be taken into consideration.
The thesis is a concentration study on the challenges, forms and future sustainable solutions for the e-wastes as human health and the environment become threatened factors in the 21st century, by
stakeholders. In this way, Sabaa [46] studied the institutions as well as the governmental regulations that were formed to confront this global issue by posing different national and international regulations such as banning the export of the electronic wastes towards developing countries and the mandatory recycling policies.
The Sabaa [46] thesis studied in detail parts of the Basel convention, looking at perspectives from its history and creation to its different Annexes. It also investigated the role of the Basel Ban as well as its obligation and impact on different Basel members. Furthermore, the thesis went through the WEEE legislations in different part of the world, including North America (mainly U.S and Canada), Asia (mainly China) and Europe, at the state, provincial and national levels.
It concludes that directives such as the restriction of hazardous substances (RoHS) and programs such as extended producer responsibility (EPR) at the state-level are not the only possible solutions and that the appropriate treatment for solving the e-waste generation problem is to create more improvements and reforms. On the other hand, imposing trade restrictions and instilling clean production cannot truly be the solution for confronting the global environmental crisis concerning e-waste; rather, it needs a more in-depth analysis of the functional and cultural aspects of everyday life among members of these societies in order to better understand their relation with electronic goods and services [46].
By analyzing these similar studies and to the best of the author’s knowledge, there have been limited studies done on the trade flows of Canadian e-waste to the other countries. Therefore, this study can be a light for future studies on this topic. Also, by further investigating this trade flow, the Canadian environment and economy can obtain benefits in the short and the long run.
CHAPTER 3
REGULATIONS AND LEGISLATIONS
3.1 Canada’s Federal E-waste Legislations
This chapter directly relates to the first defined objective of the thesis with respect to identifying the domestic and international trade factors as well as their potential effects on the trade flow of electronic waste in Canada. It will take a specific look at the regulations and legislations as the most important elements of these factors. In this way, Canada’s e-waste domestic regulation at the federal and the provincial basis will be discussed followed by its comparison to the other developed countries including U.S and the European Union countries.
At the federal level, Canada has not defined any specific legislation for e-waste management. Similarly, the United States has also not defined any particular federal legislation for recycling of the e-wastes. Both countries set e-waste legislations at the provincial and state level respectively; however, the Canadian federal government indirectly influences e-waste regulations by way of the laws passed on toxic substance control [47, 48]
Despite this fact, the Canadian government gains from the e-waste strategy involving the reuse and leverage of the existing mechanisms put in place which was introduced in February 2010 by the Public Works and Government Services Canada (PWGSC) for better recycling in an environmentally sound manner for all electronic and electrical equipment. Based on Government of Canada, in just 2011/2012, the federal government spent around $1.2 billion on the disposal of a wide array of electronic and electrical equipment [12].
For better recycling the end-of-life electronic products at the national level, Canada introduced the Electronic Products Recycling Association (EPRA) in 2011, a not-for-profit association created by Canada’s electronics industry, responsible for promoting and managing the e-waste products in the volunteer provinces. Currently, the program is operating in the provinces of Quebec, Saskatchewan, British Columbia, Manitoba, Prince Edward Island, Nova Scotia and Newfoundland and Labrador [49, 50].
Based on EPRA annual report in 2012, there are more than 3,000 stewards registered in the program in the entire country with up to 700 permanent collection sites and over 40 verified processors. Also based on EPRA claims, the program safely collected and recycled over 25,000 tonnes of e-waste in 2012 alone at the national level [50].
Furthermore, with respect to the legislative aspect at the federal level, the governmental approach on the e-waste issue is based on a two-tier approach:
1. Discovering new ways to confront and minimize the issue of toxic materials used in electronic products.
2. Finding methods to promote the minimization of the release of end of life toxins [51].
3.2 Canada’s Provincial E-waste Legislations
In this section, the Canadian provincial legislations on e-waste will be studied by using the latest data and information with respect to their regulations and program performance, going from the largest to the smallest producer. At the moment of conducting this study, nine provinces have passed and use e-waste legislation through extended producer responsibility (EPR) for better management of the issue of end-of-life electronic products.
At the end of this section, comparisons on the policies, used programs and statistics among provinces will be evaluated in order to clearly show the impact of current legislation among these areas.
3.2.1 Ontario
The first WEEE regulation for the issue of waste in general was created in December 2004 under Ontario’s Waste Diversion Act (WDA) which was passed as law in 2002, with aim of decreasing, reusing and recycling of the selected waste products [48, 52]. Following the introduction of this regulation, provincial legislation was established in April 2009 particularly for the collection, reuse and recycling of electronic products while the province launched the WEEE program and the followed the obliged legislations for a limited category of electronic products. As of April 2010, the program expanded to the 44 designated items, categorized under eight major material types, which include
“…Display devices, desktop computers, portable computers, computer peripherals, printing,
copying and multi-function devices, telephones and telephone answering machines, cellular devices and pagers, image, audio and video devices…” [53], for legalizing the obligation of collecting
and recycling the end-of-life Electrical and Electronic Equipment (EEE) under regulation of 393/04 for the entire province [53-55].
The managerial and implementation aspects of the program have been allocated to the Ontario Electronic Stewardship (OES), which is a non-for-profit industrial funding organization developed with the intent of collecting fees from industry stewards in order to better manage the WEEE program. The initiative is done on behalf of the Ontario government as well as the electronics industry. In this initiative, plans have been approved by Waste Diversion Ontario (WDO) and the Ministry of the Environment [52, 54]. Currently, more than 600 collection sites are active throughout the province due to this program [56], which is the highest number among all provinces in the country.
Furthermore, the responsibility of monitoring for tracking the quality performance of the program has been allocated to the Waste Diversion Ontario (WDO), and then gets reported directly to the Ontario ministry of the environment [54]. According to information from December 2012 from the WDO, over 200,000 tonnes of e-waste has been efficiently processed for extracting purposes in order to draw out both valuable and reusable materials due to the implementation of this program from its inception in 2009 onwards [52].
The timing of launching such a program in 2009 does not match the expansion of electronic products and the technology improvements from prior years; it would have been more appropriate to have had the program implemented in the early 2000s. Despite this fact, the program shows proper improvements over the years of operation from its creation time, from collecting 1.31 kg/capita of electronic and electrical equipment in 2009-2010 to 5.61 kg/capita and 5.67 kg/capita in 2012 and 2013 respectively, which is expected to be the highest rate in the EPS program among all provinces throughout the country [57, 58].
It should be noted that Ontario, as the most populated province in Canada, is estimated to own more than 38% of all electronic devices throughout the country. It seems reasonable that Ontario would, therefore, have the largest EPS program with respect to all other Canadian provinces, as Ontarians
produce the largest amount of e-wastes annually. Looking at mobile phones alone, 81% of Ontarians own at least one mobile device which represents 42% of the Canadian population [59].
The use of electronic devices is increasing annually since new technologies are constantly replacing existing ones and that both the Ontarian and Canadian populations are on the rise; therefore, it is reasonable to assume that the growth rate of the e-waste generated in response to these changes would increase each year as well. Additionally, statistics show that 80% of Ontario households were in possession of at least one out-of-use device in 2010 alone. In the year after and in the individual’s electronics rate, this number increased to the 90%, where in other words 1 out of every 10 individuals, had at least one out-of-use electronic device [59]. Based on this data and by considering the potential amount of e-waste that is expected to be produced over the coming years, the future blueprint for improvements towards the WEEE program as well as better management and monitoring of the OES and WDO should be of utmost importance for the Ontario government.
3.2.2 Quebec
Regulation Respecting the Recovery and Reclamation of Products by Enterprises (Q-2, r. 40.1) has been established as the core of e-waste regulation in November 2009 under the Environment Quality Act (EQA) to confront the issue of WEEE in the province. The legislation came into effect in July 2011 through initial mandatory policies for electronic producers to manage to collect and recycle specific electronic product categories in the province [60].
The Société Québécoise de Récupération et de Recyclage (Recyc-Quebec) is the initial responsible organization for implementing e-waste regulations in the province. This is a provincial organization which was founded in 1990 with the intent of controlling, reducing, and recycling waste in general for the province of Quebec [48].
Also to continue with this improvement process, Quebec implemented the EPRA stewardship program which was introduced and established in May 2012 and recognized by Recyc-Quebec. EPRA-Quebec claims it created 270 collection sites throughout the province in 2012, which is considered to be a great number for such a short period of time since its inception [50]. However, despite this large number of collection sites that have been created, the province ranked last among the other provinces with respect