UNIVERSITÉ DE MONTRÉAL
MODELING OF WIND PARKS FOR STEADY STATE SHORT CIRCUIT STUDIES
THOMAS KAUFFMANN
DÉPARTEMENT DE GÉNIE ÉLECTRIQUE ÉCOLE POLYTECHNIQUE DE MONTRÉAL
THÈSE PRÉSENTÉE EN VUE DE L’OBTENTION DU DIPLÔME DE PHILOSOPHIAE DOCTOR
(GÉNIE ÉLECTRIQUE) AOÛT 2018
UNIVERSITÉ DE MONTRÉAL
ÉCOLE POLYTECHNIQUE DE MONTRÉAL
Cette thèse intitulée :
MODELING OF WIND PARKS FOR STEADY STATE SHORT CIRCUIT STUDIES
présentée par : KAUFFMANN Thomas
en vue de l’obtention du diplôme de : Philosophiae Doctor a été dûment acceptée par le jury d’examen constitué de :
M. MAHSEREDJIAN Jean, Ph. D., président
M. KOCAR Ilhan, Ph. D., membre et directeur de recherche
M. KARAAGAC Ulas, Ph. D., membre et codirecteur de recherche M. EMIN Zia, Ph. D., membre
DEDICATION
ACKNOWLEDGEMENTS
I would like to thank my main supervisor Dr. Ilhan Koçar for giving me his trust for this project, for being available and guiding me all along the PhD. And another thanks for letting me the chance to teach one 3rd year bachelor course in Polytechnique Montreal.
I also thank a lot Dr. Ulas Karaagac for his huge support all along this research project, for his advice and corrections for the publications.
A sincere and great thank to Baki and Isabel for the nice atmosphere in the office, and all the ideas and funny moments we shared inside and outside the office, but also for listening during the harder moments.
Another thank to Baki for his help at the beginning of this project.
Another sincere thank to Isabel for her support, encouragements and advices, all the time we shared, and for showing me the richness of the Portuguese culture.
A thank to all other officemates with whom I shared nice time inside and outside Polytechnique: Ming, Haoyan, Aramis, Jesus, Miguel, Anton, Reza, Aboutaleb, Fidji and Pr. Ametani. And again Anton, Reza and Aboutaleb for their help for my project.
All my other international friends of Polytechnique for sharing their culture, for opening my eyes on the cultural richness of the world: Alexis, Leticia, Kim, Sampada, Jesus, Sandra, Rodrigo, Nazli, Xin, and Celso.
To Lingnan who supported me a lot during the last months of the project.
Finally, I thank a lot my parents and my brother for supporting and encouraging me already long time before this project but who have allowed me to reach it.
RÉSUMÉ
La part croissante des énergies renouvelables dans la production d’électricité impose une adaptation des systèmes de protection des réseaux électriques. Ceci est dû au fait que ces énergies renouvelables utilisent majoritairement l’électronique de puissance, et que leurs comportements en conditions transitoires sont différents de ceux des centrales électriques fonctionnant avec des génératrices synchrones. Le comportement de ces énergies renouvelables est dicté par le contrôleur des convertisseurs, et en principe, ce comportement en conditions de court-circuit peut être reproduit de manière précise avec des logiciels de simulation dynamique ou transitoire. Cependant les progiciels de protection et de court-circuit utilisés par les ingénieurs fonctionnent avec des outils d’analyse en régime permanent dans le domaine phaseur.
L’objectif principal de cette thèse est de développer un modèle phaseur de parc photovoltaïque ou éolien qui donne la contribution de courant en conditions permanentes de court-circuit. Le modèle phaseur est développé pour les éoliennes de type-III et type-IV. La répresentation de la séquence inverse et d’un contrôleur de parc sont aussi développés. Le modèle de type-IV peut aussi représenter un parc photovoltaïque comme tous deux transmettent l’ensemble de leur puissance via un onduleur.
Les modèles phaseur sont validés avec des modèles temporels détaillés, construits dans le logiciel EMTP-RV. Ces modèles temporels ont été construits et améliorés grâce à des retours d’un des leaders européens de la fabrication d’éoliennes. Les modèles phaseur prennent en compte le comportement des contrôleurs de convertisseurs et différentes stratégies de contrôle associées. Pour les grands parcs éoliens connectés au réseau haute tension, le point de contrôle est situé au point d’interconnection du parc. Les différentes stratégies de contrôle agissent sur la tension, la puissance réactive ou le facteur de puissance. En plus de ces 3 modes de contrôle, un mode d’alimentation sans panne (Fault Ride Through en anglais) est aussi disponible pour relever la tension pendant les court-circuits. Un limiteur de courant protège les convertisseurs contre les surintensités, et fonctionne en donnant la priorité à la composante active ou réactive du courant. Ce limiteur est indispensable mais ajoute un comportement non linéaire au contrôleur.
Les modèles phaseur présentés donnent le comportement de séquence inverse avec 2 niveaux de precision : simple et détaillé. Ces deux niveaux ne s’appliquent qu’aux contrôleurs qui ne régulent pas directement leur courant de séquence inverse. Une meilleure précision demande plus
de détails des contrôleurs, comme les gains des régulateurs proportionnel-intégral de la boucle de contrôle interne. Ces modèles phaseur représentent les éoliennes avec des sources de courant contrôlées, dont le courant est calculé en fonction des paramètres du contrôleur et de la tension aux bornes de l’éolienne. A cause du comportement non linéaire de ces contrôleurs, les modèles phaseur proposés sont construits avec une structure itérative.
Les modèles d’éolienne sont implémentés dans un solveur phaseur basé sur l’analyse nodale modifiée augmentée. L’étude de court-circuit est initialisée par un écoulement de puissance. Après l’application du court-circuit au réseau initial, le courant produit par les éoliennes est mis à jour selon l’état du réseau et les paramètres des contrôleurs. Le courant produit par les éoliennes dépend des conditions de tension du réseau, mais avec une relation non-linéaire. En retour, les conditions de tension du réseau dépendent des courants des éoliennes. Ainsi, une solution itérative est proposée. La convergence de cette solution se base sur la variation de tension sur le réseau. Les résultats sont validés par comparaison avec des simulations temporelles. Plusieurs conditions de court-circuit, avec différents modes de contrôle sont appliquées à des éoliennes de type-III et -IV, et démontrent la précision des modèles phaseur développés.
Pour certains phénomènes qui touchent les réseaux, la représentation phaseur a des limites comparées au domaine temporel. Ces limites sont aussi brièvement décrites.
ABSTRACT
The increasing share of renewable energy resources in electricity generation requires reassessment of protection systems. This is due to the fact that renewables are often electronically coupled to the grid and their behavior under transient conditions is different from the behavior of power plants generating power using classical synchronous generators. The behavior of electronically coupled generators depends on the controllers of their converters, and in principle, their precise simulation under short-circuit conditions is possible using dynamic or transient tools which allow detailed modeling of controllers. However, protection and short-circuit software packages used by practicing engineers depend on steady-state solution engines built in phasor domain.
The main objective of this thesis is to develop steady-state phasor models of wind and solar parks that provide their current contribution under steady-state short-circuit conditions. The steady-state models are developed for type-III and type-IV wind turbine generators. Negative sequence control and park controller options are also considered. The Type-IV model can also be used for modeling solar plants since both sources are connected via full converters.
The steady-state models are validated using a detailed time-domain model that is developed in EMTP-RV software with the feedback of a leading European manufacturer of wind turbines. The phasor models take into account the behavior of converter conrollers and various control strategies associated with it. For large-scale wind parks connected to high voltage networks, the point of control is located at the point of interconnection of the park. The control strategies act on voltage, reactive power or power factor. In addition to these three control modes, a fault ride through mode is also available to support voltage during fault conditions. A current limiter protects the converters against overcurrent, and operates with P- or Q-priority. This limiter is indispensable but introduces a non-linear behavior.
The phasor models take into account the natural negative sequence response of the wind turbine generator with two levels of precision if the controllers are not set to regulate negative sequence: simplified and detailed. Higher precision requires more details about the controller, such as the gains of the inner loop proportional-integral controller. The proposed steady-state models represent a wind turbine generator with a control-based equivalent current source of which the current is specified according to the response of controller and the three-phase voltages at the
terminals of the wind turbine generator. The models need to be hosted in an iterative short-circuit solver because of the non-linear behavior of controllers.
The models are integrated with a steady-state solver that builds the network equations using modified-augmented-nodal-analysis. The short-circuit analysis is initialized from load flow solution. Following the application of a short-circuit condition to the initial network, the contribution of a wind turbine generator is updated using network conditions and controller settings. The contribution of a wind turbine generator depends on the network voltage conditions but with a nonlinear relation. In return, the network voltage conditions depend on the contribution of wind turbine generators. Therefore, an iterative solution is proposed, of which the convergence is tested based on a tolerance on the variation of network voltages. Final results are validated by comparing them with time-domain simulation results. Various fault conditions with different control strategies are applied to type-III and -IV wind parks, and the accuracy of the proposed phasor models is demonstrated.
Besides comparing steady-state models to time-domain models, their limitations as opposed to time domain models in terms of studying power systems for various phenomena, are also briefly discussed.
TABLE OF CONTENTS
DEDICATION ... III ACKNOWLEDGEMENTS ... IV RÉSUMÉ ... V ABSTRACT ...VII TABLE OF CONTENTS ... IX LIST OF TABLES ... XIII LIST OF FIGURES ... XVI LIST OF SYMBOLS AND ABBREVIATIONS... XIX LIST OF APPENDICES ... XXICHAPTER 1 INTRODUCTION ... 1
1.1 Motivation ... 1
1.2 Literature review ... 3
1.3 General technical aspects regarding modeling of WPs ... 8
1.4 Thesis objective and outline ... 13
1.5 Contributions ... 14
1.6 List of publications ... 15
CHAPTER 2 FULL-SCALE CONVERTER SHORT-CIRCUIT STEADY-STATE MODEL ... 17
2.1 Controller structure and time-domain model of full-scale converter generators ... 17
2.1.1 abc-to-dq transformation ... 20
2.1.2 Outer control loop ... 21
2.1.3 Current limiter ... 23
2.1.5 Decoupled controller ... 28
2.1.6 Inner control loop with decoupled control ... 31
2.1.7 dq-to-abc transformation ... 33
2.2 Phasor model of full-scale converter WTGs ... 35
2.2.1 Outer control loop ... 35
2.2.2 Current limiter ... 37
2.2.3 Coupled control: positive sequence behavior ... 39
2.2.4 Coupled control: negative sequence behavior ... 40
2.2.5 Decoupled control ... 45
2.2.6 Loss of synchronism ... 47
2.3 FSC phasor model algorithm... 49
2.3.1 List and description of the variables of FSC phasor model algorithm ... 54
2.3.2 FSC algorithm: List of inputs ... 56
2.4 Conclusion ... 57
CHAPTER 3 TYPE-III WIND TURBINE GENERATOR SHORT-CIRCUIT STEADY-STATE MODEL ... 58
3.1 Controller structure and time-domain model of type-III WTGs ... 58
3.1.1 abc-to-dq transformation ... 61
3.1.2 RSC outer control loop ... 63
3.1.3 RSC current limiter ... 68
3.1.4 Total GSC controller ... 69
3.1.5 RSC inner control loop ... 70
3.1.6 dq-to-abc transformation ... 75
3.2 Simple steady-state model of the type-III WTG ... 76
3.2.2 Current limiter & calculation of stator reference currents ... 82
3.2.3 GSC currents and negative sequence behavior ... 83
3.2.4 DFIG simple model algorithm ... 86
3.2.5 List and descriptions of the variables of the DFIG phasor model algorithm ... 91
3.2.6 DFIG algorithm: list of inputs ... 94
3.3 Complete steady-state model of the type-III WTG ... 94
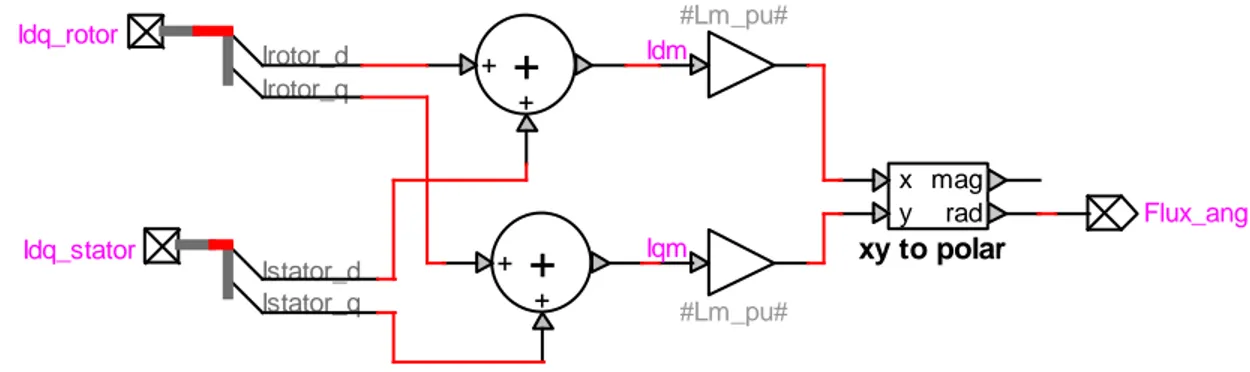
3.3.1 Flux angle, SFR and SVR conversions ... 95
3.3.2 Positive sequence stator currents ... 97
3.3.3 Negative sequence stator currents ... 98
3.3.4 GSC currents ... 105
3.3.5 Flux angle and turbine currents ... 107
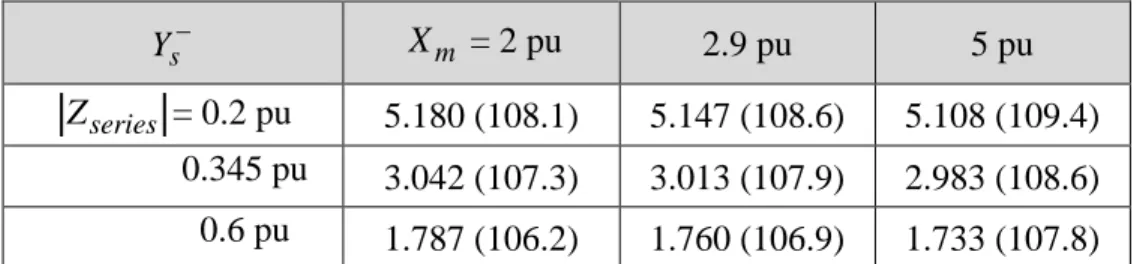
3.4 Negative sequence gain to obtain Is ... 108
3.5 Conclusion ... 113
CHAPTER 4 STEADY-STATE SOLVER, SIMULATIONS AND VALIDATIONS ... 114
4.1 Development of a functional short-circuit solver ... 114
4.1.1 Solver structure ... 114
4.1.2 Functional solver for current contribution of type-III and -IV WTGs ... 117
4.2 Test case 1: single WP ... 121
4.3 Test case 2: multiple WPs ... 124
4.4 FSC generator: simulation and cross-examination with EMTP-RV ... 126
4.4.1 FSC generator in test case 1 ... 127
4.4.2 FSC generator in test case 2 ... 134
4.5 DFIG generator: simulation and cross-examination with EMTP-RV ... 136
4.5.2 DFIG generator in test case 2 ... 143
4.6 FSC and DFIG generators: simulation and cross-examination with EMTP-RV ... 145
4.7 Conclusion ... 148
CHAPTER 5 ACCURACY LIMITATIONS OF THE STEADY-STATE MODELS ... 149
5.1 Limitations of the ECG models ... 149
5.1.1 FSC negative sequence behavior with coupled sequence control ... 149
5.1.2 DFIG positive sequence behavior ... 150
5.1.3 DFIG negative sequence behavior ... 151
5.2 Limitations due to phasor domain solver ... 152
5.3 Limitations due to fundamental frequency representation ... 153
5.4 Conclusion ... 159
CHAPTER 6 CONCLUSION AND RECOMMENDATIONS ... 160
6.1 Thesis summary ... 160
6.2 Future work ... 161
REFERENCES ... 163
LIST OF TABLES
Table 2.1 Control parameters impact Yg. ... 44
Table 3.1 Impact of control parameters on Ys. ... 111
Table 3.2 Impact of machine parameters on Ys. ... 112
Table 4.1 List of the four main steps of the SC solver. ... 114
Table 4.2 Test case 1, electrical parameters of the WP. ... 123
Table 4.3 Current vs voltage relation of the non-linear magnetizing inductance of transformers. ... 123
Table 4.4 Test case 2, electrical parameters of the two WPs. ... 126
Table 4.5 Test case 1, WTG-IV: Controller parameters. ... 128
Table 4.6 Test case 1, comparison between TD and SS solution: WTG-IV with LLG (ABG) fault at Bus 1. ... 128
Table 4.7 Test case 1, comparison between TD and SS solution: WTG-IV with LLG (ABG) fault at Bus 4. ... 129
Table 4.8 Test case 1, comparison between TD and SS solution: WTG-IV with LLG (ABG) fault at Bus 6. ... 129
Table 4.9 Test case 1, comparison between TD and SS solution: WTG-IV with LLG (ABG) fault at Bus 4, and low wind speed. ... 131
Table 4.10 Test case 1, comparison between TD and SS solution: WTG-IV with coupled control and two reactive power references for LLG (ABG) fault at Bus 6. ... 132
Table 4.11 Test case 1, comparison between TD and SS solution: WTG-IV with decoupled control for LLG (ABG) fault at Bus 6... 132
Table 4.12 Control mode impacts the LOS behavior of FSCs. ... 134
Table 4.14 Test case 2, comparison between TD and SS solution: WTG-IV with LL (AB) fault at Bus 27, with decoupled control... 135 Table 4.15 Test case 2, comparison between TD and SS solution: WTG-IV with LG (BG)
fault at Bus 4, with decoupled control... 135 Table 4.16 Test case 2, comparison between TD and SS solution: WTG-IV with LG (BG)
fault at Bus 25, with coupled control. ... 136 Table 4.17 Test case 1, WTG-III: Controller and machine parameters. ... 138 Table 4.18 Test case 1, comparison between TD and SS solution (simple and complete):
WTG-III with LL (AB) fault at Bus 4. ... 139 Table 4.19 Test case 1, comparison between TD and SS solution (simple and complete):
WTG-III with LG (AG) fault at Bus 4. ... 139 Table 4.20 Test case 1, comparison between TD and SS solution (simple and complete):
WTG-III with LL (AB) fault at Bus 1. ... 140 Table 4.21 Test case 1, comparison between TD and SS solution (simple and complete):
WTG-III for LL (AB) fault at Bus 4. ... 140 Table 4.22 Test case 1, comparison between TD and SS solution (simple and complete):
WTG-III for LLG (ABG) fault at Bus 1. ... 141 Table 4.23 Test case 1, comparison between TD and SS solution (simple and complete):
WTG-III for LLG (ABG) fault at Bus 6, with QPOI 0.2 pu. ... 142 Table 4.24 Test case 1, comparison between TD and SS solution (simple and complete):
WTG-III for LLG (ABG) fault at Bus 6, with QPOI 0.2 pu. ... 142 Table 4.25 Test case 2, comparison between TD and SS solution: WTG-III with LL (AB)
fault at Bus 27. ... 144 Table 4.26 Test case 2, comparison between TD and SS solution: WTG-III with LG (AG)
fault at Bus 15. ... 144 Table 4.27 Test case 2, comparison between TD and SS solution: WTG-III with LLG (BCG)
Table 4.28 Test case 2, comparison between TD and SS solution: WTG-III and IV with LLG (ABG) fault at Bus 27. ... 146 Table 4.29 Test case 2, comparison between TD and SS solution: WTG-III and IV with LG
(BG) fault at Bus 15. ... 147 Table 4.30 Test case 2, comparison between TD and SS solution: WTG-III and IV with LL
(AB) fault at Bus 25. ... 147 Table 4.31 Test case 2 with WTG-III and IV, maximum difference between the TD and SS
solution. ... 147 Table 5.1 Test case 1, comparison between TD and SS solution in case of false FRT
LIST OF FIGURES
Figure 1.1 Growth of installed wind power since the year 2001 [1]. ... 1
Figure 1.2 Predicted growth of installed wind power until 2022 [2]. ... 1
Figure 1.3 Limit curves for the voltage pattern at the grid connection for non-synchronous generator [12]. ... 4
Figure 1.4 Single-line diagram of a typical wind park. ... 8
Figure 1.5 Reactive power control at the POI (Q-control). ... 9
Figure 1.6 AVM representation of the VSC. ... 11
Figure 1.7 Electrical circuit of the two shunt filters. ... 11
Figure 2.1 Structure of the type-IV WTG. ... 18
Figure 2.2 Basic structure of a converter controller. ... 19
Figure 2.3 EMTP-RV diagram of the DSRF PLL. ... 21
Figure 2.4 Circuit of the aggregated type-IV based WP. ... 22
Figure 2.5 Example of an FRT curve [50]. ... 23
Figure 2.6 Geometrical representation of current limits. ... 25
Figure 2.7 Current regulation through the choke impedance. ... 26
Figure 2.8 abc-to-dq transformation with coupled control. ... 27
Figure 2.9 Schematic diagram of GSC coupled control. ... 28
Figure 2.10 Schematic diagram of GSC decoupled control. ... 33
Figure 2.11 Difference between control at PGC and control at POI... 39
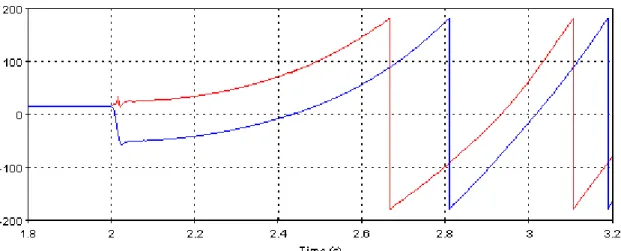
Figure 2.12 Phasor angles of positive sequence voltage (red) and current (blue) do not converge during a 3-phase fault at the POI. ... 47
Figure 2.14 Block diagram of the FSC algorithm (left: coupled, right: decoupled). ... 50
Figure 3.1 Structure of a type-III WTG. ... 59
Figure 3.2 Basic structure of a DFIG controller. ... 60
Figure 3.3 Calculation of flux angle for SFR. ... 62
Figure 3.4 Linear Γ model of an induction machine [37]. ... 63
Figure 3.5 Relation between stator and rotor currents with a simplified Γ model. ... 64
Figure 3.6 Circuit of the aggregated type-III based WP. ... 66
Figure 3.7 A schematic diagram of the converter controllers of a type-III WTG in normal conditions. ... 74
Figure 3.8 Stator dq axes in SFR and SVR. ... 77
Figure 3.9 Block diagram of the simple DFIG algorithm. ... 87
Figure 3.10 Stator flux (SFR) and stator voltage (SVR) reference frames. ... 95
Figure 3.11 How the RSC inner loop PI limiter cuts oscillations. ... 101
Figure 3.12 Inner loop PI limiter: and Vlim definitions. ... 102
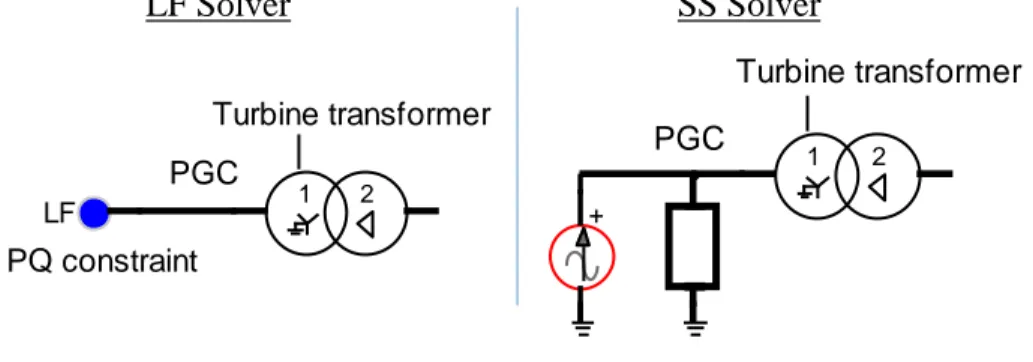
Figure 4.1 ECG representation in the LF and the SS solver. ... 115
Figure 4.2 Currents and voltages exchanged during the SC iterative process. ... 116
Figure 4.3 Block diagram of the solver. ... 118
Figure 4.4 Test case 1: 120 kV system. ... 122
Figure 4.5 Test case 2: IEEE 39bus system with two WPs. ... 124
Figure 4.6 The sequence control has no impact on the reactive power output. ... 130
Figure 4.7 The decoupled control reduces magnitude of active power oscillations. ... 130
Figure 4.8 GSC current contribution for LLG fault on 2 locations. ... 130
Figure 5.1 Slip variation during uninterrupted faults. ... 150
Figure 5.3 Test case 1, EMTP-RV current magnitude waveforms and SS solution: WTG-IV
with decoupled control, with LLG (ABG) fault at Bus 1... 154
Figure 5.4 Test case 1, EMTP-RV voltage magnitude waveforms and SS solution: WTG-IV with decoupled control, with LLG (ABG) fault at Bus 1... 154
Figure 5.5 Test case 1, EMTP-RV current magnitude waveforms and complete SS solution: WTG-III with LL (AB) fault at Bus 1. ... 155
Figure 5.6 Test case 1, EMTP-RV voltage magnitude waveforms and complete SS solution: WTG-III with LL (AB) fault at Bus 1. ... 155
Figure 5.7 Test case 1, EMTP-RV current magnitude waveforms and complete SS solution: WTG-III with LL (AB) fault at Bus 4. ... 156
Figure 5.8 Test case 1, EMTP-RV voltage magnitude waveforms and complete SS solution: WTG-III with LL (AB) fault at Bus 4. ... 156
Figure 5.9 PGC phase voltages when a phase opens at MV level. ... 157
Figure 5.10 GSC recovers after an open phase lasting 6 cycles. ... 158
LIST OF SYMBOLS AND ABBREVIATIONS
AC Alternative CurrentAVM Average Value Model
BtB Back-to-Back
CP Constant Parameters
DC Direct Current
DFIG Doubly Fed Induction Generator DSRF Double Synchronous Reference Frame ECG Electronically Coupled Generator EMT Electromagnetic Transients
EMTP-RV Electromagnetic Transients Program, Revised Version FRT Fault Ride Through
FSC Full-scale Converter GSC Grid-side Converter LF Load-Flow LG Line-to-Ground (fault) LL Line-to-Line (fault) LLG Line-to-Line-to-Ground (fault) LOS Loss Of Synchronism
LPF Low-Pass Filter
MANA Modified Augmented Nodal Analysis MPPT Maximum Power Point Tracking MSC PMSG stator side converter
PGC Point of Generator Connection
PF Power Factor
PI Proportional Integral
PLL Phase Lock Loop
PMSG Permanent Magnet Synchronous Generator POI Point of Interconnection
PQ active and reactive power (constraint for load-flow) PWM Pulse Width Modulation
pu per-unit
RSC Rotor Side Converter
SC Short Circuit
SFR Stator Flux Reference
SS Steady-State
SSR Sub-Synchronous Resonance SVR Stator Volate Reference
TD Time-Domain
VSC Voltage Source Converter WTG Wind Turbine Generator
WP Wind Park
WPC Wind Park Controller WTC Wind Turbine Controller WTG Wind Turbine Generator
LIST OF APPENDICES
APPENDIX A – DETAILED CALCULATIONS OF COMPLETE DFIG MODEL ... 169 APPENDIX B – DFIG COMPLETE MODEL ALGORITHM ... 178 APPENDIX C – TEST CASE 1 DATA: 120 kV SYSTEM ... 189
CHAPTER 1
INTRODUCTION
1.1 Motivation
There have been important technological developments in the field of renewable power plants mainly due to environmental concerns, public support and both state- and private-level initiatives. Accordingly, the integration of renewable power plants into the grid at all voltage levels has increased considerably over the years after 2001 (Figure 1.1). In 2017, the global installed wind power capacity was 539 GW. Figure 1.2 suggests that this growth will continue in the years to come, and it may reach 840 GW by 2022, i.e. an increase of more than 55%.
Figure 1.1 Growth of installed wind power since the year 2001 [1].
As another indication of the level of integration of wind energy, we may consider the example of Denmark where 37.6% of its annual electricity consumption in 2016 was generated by wind [3]. Electronic converters are needed for most if not all renewable energy sources to be safely connected to the electrical power network or even to be connected to local loads. There are several reasons why electronic converters are needed. The first reason is the nature of the renewable enery source itself. For example, photovoltaic panels produce only DC power. As another example, when permanent magnet synchronous generators are used in wind turbines, the generated output power is dirty, and its quality needs to be improved in terms of voltage and frequency. In addition to the above reasons, converters allow wind turbines to operate within a wider range of wind conditions, thus enhancing the overall efficiency of the system. A converter-interfaced source is also called an electronically-coupled generator (ECG). Although this terminology is more common in distribution level applications, in this work it will refer to all generators connected to the grid by means of one or several converters.
The electrical behavior of an ECG depends on the type of the converter controller used. This is one of the differences between ECGs and traditional electromechanical rotating machines.
The behavior of interest here is what happens when there is a fault in the network. For short-circuit (SC) studies, a synchronous generator (SG) is represented as a voltage source behind an impedance (subtransient, transient or synchronous). It generates a high SC current and provides a low impedance path for the negative sequence current, because of the low subtransient and transient impedance. This is the typical generator model in most SC packages, and it is considered to be precise within the requirements of SC studies.
Following the introduction of ECGs into the grid, one of the first methods to model ECGs in SC studies was to treat them as SGs. Considering the small share of the ECGs in total production in the past, the impact of modeling, no matter how inaccurate, did not seem significant. However, in view of the high integration levels of renewable sources today and considering the projection for the trend in the future (Figure 1.2), accurate models are required.
The goal of this thesis is to develop SC models in phasor frame which accurately represent the behavior of certain types of ECGs, namely, type-III and type-IV Wind Turbine Generators (WTGs) during steady-state (SS) SC conditions. These models will improve the protection analysis of networks containing ECGs.
This research project was developed in collaboration with the Electrical Power Research Institute (EPRI) and in partnership with companies manufacturing simulation tools for protection studies in phasor frame.
1.2 Literature review
The behavior and widespread integration of ECGs throughout power networks have affected the detection of faults and the operation of protection devices [4], [5].
There exist well developed standards and commonly accepted models to describe the operation under fault conditions of rotating machines directly connected to the grid [6]–[8]. However, there are no well-established standards or commonly accepted models for the ECGs. Concerning the criteria and the requirements on ECGs interconnected to distribution systems, IEEE 1547 is an evolving standard. In its initial forms, IEEE 1547 stipulated that converters should disconnect when the voltage across their interconnection terminals drops below 0.88 pu [9]. However, amendment 1 allows ECGs to support grid voltage regulation and provide voltage ride through. The distribution grid operators and ECG owners are required to specify voltage and frequency ride through, and coordinate the participation of the ECGs in voltage regulation, which is done by adjusting real and reactive power outputs of the ECGs.
Regarding the interconnection of ECGs at the transmission level, the voltage ride through is stipulated by grid codes specific to grid operators. The ECGs connected to the grid must stay connected until the graph of voltage versus time crosses a certain boundary curve set by the grid operator (see references [10] and [11] for examples in Europe and in Quebec, respectively). Figure 1.3 presents the voltage-time boundary curves used by the German grid operator E.ON. In Figure 1.3, UN is the nominal voltage. Above limit line 1, all non-synchronous generators must stay connected; between limit line 1 and 2, the non-synchronous generators can trip only under conditions set by the grid operator. A brief disconnection (less than 2 seconds) from the grid is always allowed below limit line 2.
Figure 1.3 Limit curves for the voltage pattern at the grid connection for non-synchronous generator [12].
Although voltage ride through is often well characterised in grid codes, the exact behavior of ECGs during low voltage (LV) conditions is not always detailed. For example, Hydro-Québec imposes a power factor higher than 0.95 in normal conditions for ECGs connected to the transmission level, but has no requirements for reactive current during LV conditions [13].
The German [12] and Spanish [10] grid codes give a curve of reactive current injection as a function of the positive sequence voltage. It becomes necessary in this case to introduce accurate models for the ECGs by considering the grid code requirements.
The Electromagnetic Transient Program (EMTP-RV) or Electromagnetic Transient-Type (EMT-type) programs in general provide a modeling and simulation environment that allows reproducing the behavior of power electronics-based devices with high levels of precision. Detailed models of ECGs in EMTP-RV have already been used to demonstrate that the SC behavior of a converter cannot be approximated by a rotating machine model (synchronous or asynchronous) [14].
In [15], a time-domain (TD) model for converters during SC conditions is proposed. The model involves two control loops: one outer loop and one inner loop. The outer loop calculates the current that should be supplied by the converter. The inner loop calculates the output AC voltage of the converter which allows supplying the current defined in the outer loop. Such a two-loop control system is still in use today. Various control types to be used for single converter applications are discussed in [15]. Reference [16] proposes controllers for systems involving several converters; such systems are encountered in, for example, wind parks.
The control of converters can be done in several coordinate systems (dq0, αβ0, phase), however, the dq0 coordinate system is standard [17]. It has the advantage of transforming the three-phase sine-wave signals into two DC signals which are easier to handle. Early models of converters with DC-link assumed the DC-link voltage to be constant, whereas this voltage depends on the power balance on the DC-link [18]. A control system for the DC-link voltage is given in [19]. In [20] and [21], the TD response during SC periods for several control schemes is further improved, and an iterative method is proposed to calculate the non-linear current contribution of converters in a network having several converters. References [19] to [21] present TD models; they discuss problems associated with protection systems that need to be adapted to renewable sources of energy.
Protection engineers working at utilities and independent system operators are still accustomed to SS tools that perform SC analysis in phasor domain [22]. It is emphasized in [14] that there is a lack of phasor models for the SC behavior of converters. In an effort to develop such phasor models, a first suggestion was to define upper and lower limits for the current contribution of an ECG [23] for balanced faults. Of course, the lower limit would be zero because the wind speed can be zero.
There are simple equivalent circuits that can model the complex behavior of a converter under certain special conditions (voltage close to nominal, fixed amount of reactive power, no negative sequence current). These equivalent circuits are usually current sources in parallel with impedances or voltage sources in series with impedances. Such equivalent circuits can be easily included in a multiphase load-flow (LF) solver using modified augmented nodal analysis (MANA) [24]. However, a converter can be represented in this fashion only for certain special cases and not for a wide spectrum of conditions. LF sequence models are developed in [25] for
type-III WTGs, and in [26] for full-scale converter (FSC) type generators. These models maintain the LF constraints while respecting the limits of ECGs and correct the constraints if the limits are violated. The models also perform under unbalanced conditions, by considering the regulation of negative sequence components provided by the converter controller. This type of control, i.e., the regulation of negative and positive sequence components separately, is called decoupled sequence control. The LF models, however, cannot produce the behavior of ECGs accurately under LV conditions, and hence cannot be used for SC studies.
A SC model of FSC generators is developed in [27] under the assumption that only active power is injected by the converter. This is a reasonable assumption for operation under normal conditions. However, for operation under fault conditions, the reactive power injection that can be stipulated to support the system voltage must also be considered.
In [28], the SC current contribution of a converter is fixed at its maximum current value. This current is purely reactive (injection of reactive power), i.e, the current phase angle is 90° lagging relative to the voltage phase angle. The equivalent circuit consists of a voltage source in series with an impedance: the voltage is fixed, and the impedance is modified iteratively to maintain the specified maximum reactive current. Reference [29] uses the same method of adaptive impedance as in [28], but also considers varying the phase angle of the voltage source in the Thevenin equivalent circuit. In addition, [29] retains an active component of the current while giving priority to the reactive component. In MANA, the impedances are in the coefficient matrix A whereas the voltage and current sources are in the right-hand side vector b in the system Ax = b where x is the unknown. From the standpoint of the speed of computation, it is more efficient to keep A fixed. Therefore, methods such as those in [28] and [29] may not be the fastest. Besides, reference [29] does not deal with unbalanced conditions, and the controller in [28] is set to prevent any negative sequence current from flowing through the converter.
Reference [30] presents a SS phasor models reproducing the behavior of a TD model of type-III and type-IV WTGs. These models employ the outer and inner control loops and the current limiter of the converters. For type-IV WTGs, the active part of the current is increased to maintain the active power output, while respecting a maximum, and the reactive part of the current is adjusted to increase the reactive power injection in order to support the voltage. This is the only control mode presented in [30], where priority is given to the active power. This implies
that the reactive current is increased until the total current limit is reached, and that the active current cannot be decreased to give further support to voltage. As in [28], the model in [30] assumes that no negative sequence current flows through the converter. The reason is that the feedforward term in the inner loop makes the output negative sequence voltage of the grid-side converter (GSC) equal to the measured voltage at the PGC (converter side of the turbine transformer).
For the type-III WTG model in [30], the balanced and unbalanced conditions are treated seperately. For balanced fault (presented also in [31]), the GSC and the rotor side converter (RSC) are represented by current sources with their prefault currents. Magnetizing reactance adaptation is employed in the model. Under unbalanced conditions, the GSC has the same behavior (prefault current) and does not allow any negative sequence current to flow. The RSC is represented by a positive sequence current source, and the magnetizing reactance is adapted again. The reactance deals with the saturation of the iron core, and the current source considers the limitation of the RSC voltage. In [30], the crowbar activation during fault conditions is also considered. The crowbar, short-circuiting the rotor, used to be an easy means to protect the two converters. However, a crowbarred type-III WTG will behave as an induction machine [32], and will consequently consume reactive power. The crowbar prevents the turbine from satisfying the reactive current injection requirements imposed by grid codes [10].
The FSC-type generator SC model in [33] works with a voltage controlled current source, updated iteratively because of the non-linear behavior of the limiter of the GSC. The limiter, however, is not based on current quantities. Rather, it uses the reactive and active powers as boundaries. Furthermore, this model has a decoupled sequence controller to act on the negative sequence response or the power quality of the GSC. The concept of an iterative solution process as existing in [33] is also present in [34]. It has been used in this thesis as well.
The algorithm to calculate the current contributions of type-IV WTGs in [34] is closer to the one used in this thesis. Reference [34] presents only the FRT control, however, it does mention that other control modes are implementable.
In addition to implementing different control modes, the present thesis also considers the presence of a WPC in the calculation of current contributions and more importantly applies the
procedure to type-III based WPs which have a significantly more complex controller structure compared to type-IV based WPs.
The SS models built in this thesis are validated using detailed TD models available in the EMTP-RV software [35]. The EMTP-EMTP-RV models are based on [36]; they are fully described in [37].
1.3 General technical aspects regarding modeling of WPs
Wind Parc Controller (WPC)A wind park consists of several WTGs, each connected through a step-up turbine transformer to the medium voltage (MV) collector grid composed of underground cables (Figure 1.4). The collector grid connects all the WTGs to the park transformer (or plant transformer) which connects the collector bus to the high voltage (HV) transmission grid. The HV side of the park transformer is called the point of interconnection (POI) (Figure 1.4).
HV Grid Feeder F1 MV Collector Bus Other MV feeders HV /MV Wind Park Transformer WT +30
X
X
X
X
Figure 1.4 Single-line diagram of a typical wind park.
The active power at the POI depends on the wind conditions at each WTG inside the WP. However, according to customary grid code requirements, the WP should have a central WPC to control the reactive power at POI.
The control mode refers to the specific electrical parameter being regulated: the positive sequence voltage magnitude, positive sequence reactive power or positive sequence power factor
control, Q-control and PF-control, respectively). To simplify the notation, “positive sequence” will not be repeated each time the control mode is mentioned.
In the EMT model used in this thesis, the WP reactive power control is based on the concept of secondary voltage control [38]. At the primary level (turbine level), the wind turbine controller (WTC) monitors and controls its own positive sequence terminal voltage (Vwt) with a proportional voltage regulator. At the secondary level, the WPC monitors the reactive power at the POI (QPOI) and controls it by modifying the WTC reference voltage values (V ) 1 V
via a proportional-integral (PI) reactive power regulator as shown in Figure 1.5. The output of the PI is a voltage correction which is distributed over all the turbines. As the turbines are U
distant from the POI, a communication delay Tcom is introduced. In Figure 1.5 and thereafter, all variables are in pu (per-unit) unless explicitly stated otherwise, and the apostrophe (or the prime) sign is used to indicate the reference values.
Figure 1.5 Reactive power control at the POI (Q-control).
Although not shown in Figure 1.5, the WPC may also contain voltage control (V-control) and power factor control (PF-control) functions. When the WPC is working under the V-control function, the reactive power reference in Figure 1.5 (QPOI) is calculated by an outer proportional voltage control:
POI Vpoi POI POI
Q K V V (1.1)
where VPOI is the magnitude of the positive sequence voltage at the POI and KVpoi is the WPC voltage regulator gain.
When the WPC is working under the PF-control function, QPOI is calculated using the active power at the POI (PPOI) and the desired power factor at POI (PF POI):
21
1
POI POI POI
POI
Q sign PF P
PF
(1.2)
The “sign” function gives 1 if its argument is positive and –1 if its argument is negative. The condition for zero argument is not considered as it corresponds to an unrealistic situation. When
POI
PF is positive, the WP injects reactive power into the grid.
As the response of the PI regulator is very slow, its output ( U ) may be assumed to be constant during faults.
Wind and mechanical model
The active power production of the WTG is calculated by means of an aerodynamical and mechanical model, and a maximum power point tracking (MPPT) controller. The aerodynamical model calculates the mechanical power generated by the wind according to the wind speed, the picth angle and the rotation speed of the blades. The mechanical model is a two-mass system which represents the hub with the blades and the rotor of the machine. A pitch controller ensures that the maximum power point tracking is achieved and prevents excessive rotation speeds. Details about these models are given in [37].
The machine, the converters and their controllers are developed in the next chapters for the type-IV-based and type-III-based WPs.
To reduce the computational burden of representing each WTG of a WP separately, the complete WP is represented by a single aggregated WTG and an equivalent collector grid. In other words, a single WTG generates the power of the complete WP, and an equivalent pi-line model represents the active and reactive losses of the collector grid [39].
Converter model
The EMT models used in this thesis were built with 2-level VSC. The relatively high switching frequencies used in this topology require time steps as low as 10 µs or less. As harmonics are not essential for fundamental phasor representation, average value models (AVM) can be used to represent the 2-level converters. The AVM reproduces the average response of the switching
devices thanks to controlled sources [40] (Figure 1.6). The AVMs were validated for the converters of WTGs [41] [42], and also for HVDC systems [43].
AC N P + cI1 0/1e15 V + - PageVdc DC_side Iac_phA Iac_phB Iac_phC I_dc Vref_phB Vref_phA Vref_phC DCside1 Page Ic Page Ia Page Ib Page Vcref Page Vbref Page Varef AC_side Vac Vdc Vref AC_side_phA + 0/1e15 + 0/1e15 + 0/1e15 Page Vdc AC_side Vac Vdc Vref AC_side_phB AC_side Vac Vdc Vref AC_side_phC + B lo c k _ c o n v 1e15 + B lo c k _ c o n v 1 1e15 + B lo c k _ c o n v 2 1e15 Page Vdc Page Vdc Blocked Page Vcref Page Vbref Page Varef P a g e Ia P a g e Ib P a g e Ic i(t) Iabc a b c
Figure 1.6 AVM representation of the VSC.
Converter’s shunt filters
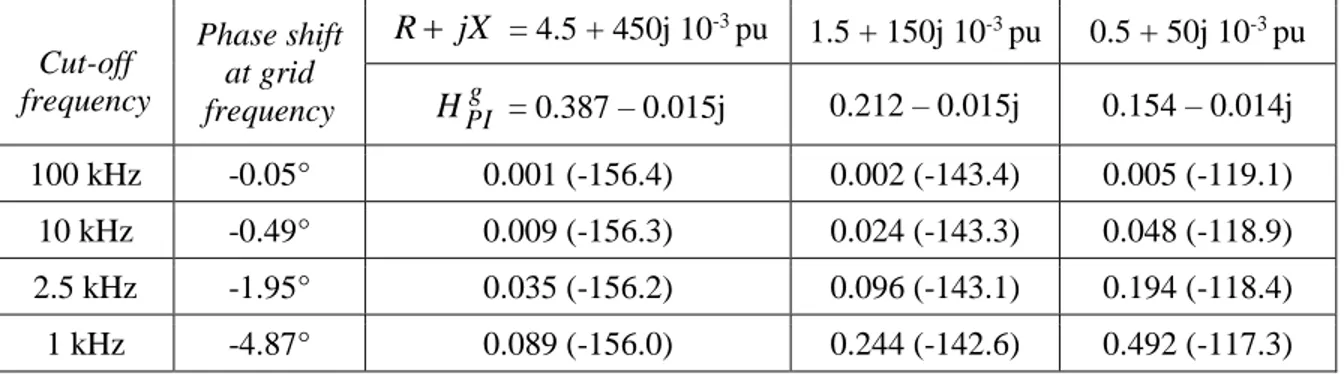
The type-III and type-IV WTGs have a GSC which produces harmonics that propagate into the grid. At the AC terminals of the GSC, those harmonics are filtered by means of a series inductance (choke) and two shunt filters. The shunt filters have a high impedance at nominal grid frequency and a very low impedance at the desired off frequency. One shunt filter has a cut-off frequency that is equal to the switching frequency of the converter, and the cut-cut-off frequency of the other filter is twice this switching frequency.
+ # R f1 # + # L f1 # + #Cf1# + # R f2 # + # L f2 # + #Cf2#
The structure of the two shunt filters is shown in Figure 1.7. For one filter, Cfilter is the capacity in Farad of the capacitor, Lfilter is the inductance in Henry of the inductor, Rfilter is the resistance in Ohm of the resistor. Those three parameters are calculated as follows:
2 2 1 2 2 filter filter base s LL RMS filter filter c filter c filter f Q C V L C f R f L Q (1.3)where f is the cut-off frequency in Hz, c Qfilter is the reactive power in var produced by one filter, VLL RMSbase is the RMS line-to-line voltage base at the GSC’s terminal, and Q is the quality f
factor of the filter.
The reactive power Qfilterand the quality factor Q are the same for both filters. f Measurement filter
The input electrical parameters of the controllers are filtered by the measurement filter before being conveyed. The goal of this filter is to remove the harmonics generated by the converter. In this thesis, the measurement filters are either second-order Butterworth low-pass filters with transfer function HmfButt( )p , or a second-order Bessel low-pass filter with transfer function
( )
Bessel mf
H p . Equation (1.4) shows their transfer functions.
2 2 2 2 , , , , 1 1 ( ) ( ) 2 1.3601 0.6165 1 1 Butt Bessel mf mf c m c m c m c m H p H p p p p p (1.4)
where c m, is the cut-off angular frequency of the measurement filter.
The complex gain at the nominal frequency is obtained by replacing p in (1.4) by js where s is the nominal angular frequency of the grid.
1.4 Thesis objective and outline
The goal of this thesis is to develop flexible, fast and easy to integrate SS phasor models reproducing the SC behavior of type-III and type-IV wind WTGs and WPs. The models are validated using the detailed models available in EMTP-RV. The ECG TD models in EMTP-RV evolved in parallel during the realization of this project in collaboration with different stakeholders including a major European wind turbine manufacturer. The TD models were also validated against field tests on several occasions during this project [44].
This thesis contains 6 chapters and 3 appendices:
- CHAPTER 1 – INTRODUCTION. It explains the motivation of this PhD project, highlights its objectives and contributions, and summarizes the contents of the thesis. - CHAPTER 2 – FULL-SCALE CONVERTER SHORT-CIRCUIT STEADY-STATE
MODEL. It contains the description of the FSC-type generator with its different control strategies. It presents the procedure to calculate the positive and negative sequence current contributions of FSC-type generators depending on the terminal voltage and controller. - CHAPTER 3 – TYPE-III WTG SHORT-CIRCUIT STEADY-STATE MODEL. It
follows the same structure as in CHAPTER 2 but for type-III WTGs (DFIGs). It presents the procedure to calculate the positive and negative sequence current contribution of the DFIGs depending on the terminal voltage and controller.
- CHAPTER 4 – STEADY-STATE SOLVER, SIMULATIONS AND VALIDATIONS. It presents the proposed solver to calculate the current contributions from the WPs based on type-III and type-IV WTGs. It presents comparisons with TD simulations in order to validate the proposed SS models.
- CHAPTER 5 – ACCURACY LIMITATIONS OF THE STEADY-STATE MODELS. It describes the limitations of the proposed SS models. The limitations are related to the accuracy of the WTG models, solver and phasor representation.
- CHAPTER 6 – CONCLUSION AND RECOMMENDATIONS. It gives a summary of this thesis as well as suggested future work related to the SC phasor representation of ECGs.
1.5 Contributions
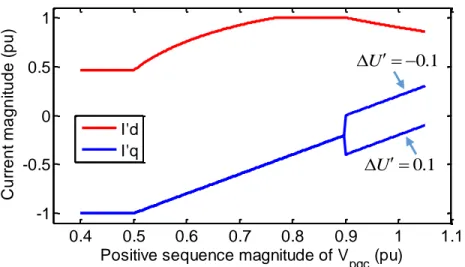
The main contribution of this thesis is the development of SS phasor models giving the current contribution of type-III-based and type-IV-based WPs in faulted networks. These models consider different control strategies for the positive sequence parameters (voltage, reactive power, power-factor control and fault-ride-through). The SS phasor models also give the negative sequence behavior of the WPs. For the type-IV, the current contribution depends only on the GSC controller, and for the type-III, the model considers the impacts of both converters (grid and rotor ones) and of the machine itself. These models are presented in the form of algorithms, which can be integrated into various software platforms in phasor frame (protection and SC). The more detailed a system model is, the more articulated its controller dynamics and parameters are. Both simplified models and detailed models have been developed. Simplified models don’t require detailed controller parameters and allow quick estimates of fault currents.
The type-III and type-IV WTG phasor models have been transferred to the software industry and are being implemented in well known protection packages [45], [46].
A further contribution of this work is the demonstration of the existence of a proportional relation between the negative sequence voltage and current for a type-IV WTG. For a type-III WTG, a similar relation exists if the negative sequence voltage at the terminals is low or if the inner loop limiter is ignored (to exclude the possibility of non-linear behavior). Relations representing various constraints regarding negative sequence quantities can also be included in a sequence or multiphase LF solver for the precise evaluation of the SS conditions under normal but unbalanced conditions. This LF application was tested for type-IV WTG [47].
The models attempt to reproduce the SS SC behavior using phasor domain relations; therefore, they have limitations in capturing the transient behavior accurately. The models also fall short in identifying certain power system phenomena associated with the dynamic behavior of controllers and power electronic converters such as power swing, ferroresonance, stability and subsynchronous resonance as discussed in [48].
1.6 List of publications
The research work associated with this thesis has led to several publications and has served many technical reports for prestigious organizations.
Journal papers
T. Kauffmann, U. Karaagac, I. Kocar, S. Jensen, J. Mahseredjian, E. Farantatos, “An Accurate
Type III Wind Turbine Generator Short Circuit Model for Protection Applications,” IEEE Trans. Power Delivery, vol. 32, no. 6, pp. 2370-2379, December 2017.
T. Kauffmann, U. Karaagac, I. Kocar, J. Mahseredjian, E. Farantatos, “Short-Circuit Model for
Type IV Wind Turbine Generators with Decoupled Sequence Control,” IEEE Trans. Power Delivery, submitted, IEEE Trans. Power Delivery, July 2018.
Conference papers
I. Kocar, T. Kauffmann, U. Karaagac, J. Mahseredjian and E. Farantatos, “Phasor Domain Modelling of Full Scale Frequency Converters for Protection Studies,” Proc. of 4th International
Workshop on Integration of Solar Power into Power Systems, Berlin, Germany, Nov. 2014.
T. Kauffmann, U. Karaagac, I. Kocar, H. Gras, J. Mahseredjian, and F. Farantatos, “Phasor
domain modeling of Type III wind turbine generator for protection studies,” Proc. IEEE Power Eng. Soc. Gen. Meeting, Denver, CO, USA, pp. 1-5, Jul. 2015.
U. Karaagac, T. Kauffmann, I. Kocar, H. Gras, J. Mahseredjian, and F. Farantatos, “Phasor domain modeling of Type IV wind turbine generator for protection studies,” Proc. IEEE Power Eng. Soc. Gen.Meeting, Denver, CO, USA, pp. 1-5, Jul. 2015.
E. Farantatos, T. Kauffmann, U. Karaagac, I. Kocar, and J. Mahseredjian, “Phasor Domain Modelling of Electronically Coupled Generators for System Protection Studies,” Proc. of 5th
International Workshop on Integration of Solar Power into Power Systems, Brussels, Belgium,
Oct. 2015.
B. Cetindag, T. Kauffmann and I. Kocar, “Modeling of wind parks in multiphase load flow solver with augmented Jacobian matrix formulation,” Proc. IEEE Power Eng. Soc. Gen. Meeting, Boston, MA, USA, pp. 1-5, Jul. 2016.
Reports for the Electrical Power Research Institute (EPRI), Palo Alto, CA, USA
Impact of Renewables on System Protection: Frequency Domain Short-Circuit Models of Converter Interfaced Renewables and Guidelines for Protection Studies. EPRI, Palo Alto, CA, 3002002810, 2014.
Impact of Renewables on System Protection: Short-Circuit Phasor Models of Converter Interfaced Renewable Resources and Performance of Transmission Line Distance Protection, EPRI, Palo Alto, CA, USA, 3002005765, 2015.
Impact of Renewables on System Protection: Wind/PV Short-Circuit Phasor Model Library and Guidelines for System Protection Studies. EPRI, Palo Alto, CA, USA, 3002008367, 2016.
Short-Circuit Phasor Models of Converter Based Renewable Energy Resources for Fault Studies, EPRI, Palo Alto, CA, 3002010936, 2017.
System Protection Guidelines for Systems with High Levels of Renewables: Impact of Wind & Solar Generation on Negative Sequence and Power Swing Protection, EPRI, Palo Alto, CA, 3002010937, 2017.
CHAPTER 2
FULL-SCALE CONVERTER SHORT-CIRCUIT
STEADY-STATE MODEL
This chapter presents the type-IV WTG and details a SS phasor model reproducing the behavior of this type of WTG during SCs in the grid. This model can also be used for other types of generators connected to the grid via full-scale converters. Examples of other types of generators include non-wind mechanical sources as well as DC power sources such as photovoltaic panels and fuel cells.
The first step is to describe in detail in section 2.1 the EMT model for type-IV WTG, and to give the basic elements of the structure of the GSC controller. The two different types of control, namely coupled sequence and the decoupled sequence are also described. The negative sequence behavior is not controllable under the coupled sequence control, whereas it is controllable under the decoupled sequence control. Section 2.2 presents the SC phasor model reproducing the SS behavior of the EMT model presented. The phasor model incorporates all of the control possibilities; it is given in the form of an algorithm in section 2.3.
2.1
Controller structure and time-domain model of full-scale converter
generators
The type-IV, i.e. the full-scale converter (FSC) WTG uses a rotating machine connected to the grid through a back-to-back (BtB) DC link. In this thesis, the rotating machine is a permanent-magnet synchronous generator (PMSG). Depending on the size of the WTG, the machine-side converter (MSC) can be either a diode rectifier or a voltage-source converter (VSC). On the other hand, the grid-side converter (GSC) is typically a VSC. The BtB VSC topology is used in this study. Figure 2.1 presents the structure of a type-IV WTG.
The DC voltage part is called the DC-link. The chopper protects the DC-link against over-voltages, and the capacitor smooths the voltage. When activated, the chopper short-circuits the two DC terminals through a resistance to dissipate excessive power. At the AC terminals of the GSC, the harmonics are filtered and hence the power quality is improved by means of a series inductance (choke) and two shunt filters (Figure 1.7). The connection downstream of the filters is
called the PGC (Point of Generator Connection). The turbine transformer connects the PGC to the MV collector grid.
Figure 2.1 Structure of the type-IV WTG.
For such type of WTG, the GSC dictates the behavior of the generator during a fault on the grid. The GSC controller can function in different manners and for different purposes as explained below.
The GSC controller can either separate the positive and negative sequences of voltages and currents (decoupled control), or not (coupled control). A sequence decoupled controller controls both the positive and negative sequences. A sequence coupled controller only regulates the positive sequence.
Structure of converter controllers
The main elements of a converter controller can be seen in Figure 2.2.
The next sections provide more details on the blocks of Figure 2.2. All paramaters are meant to be in pu.
In this chapter, variables follow the following construction rules: ▪ the subscript “pgc” refers to the PGC,
▪ the subscript “g” refers to the AC current of the GSC, or to the PGC voltage in the dq coordinates,
▪ the superscript “+” (plus) and “-” (minus) refer to the positive and negative sequences, respectively, Choke Gearbox Grid Step down transformer Wind turbine iPMSG Stator-Side Converter Grid-Side Converter ig Pg,and Qg Shaft Chopper Vdc Gearbox Grid Step down transformer Wind turbine iPMSG Stator-Side Converter Grid-Side Converter ig Pg,and Qg Shaft Chopper Vdc PGC Shunt Filters DC-link
▪ upper-case letters refer to the DC component of signals, ▪ the overbar refers to nominal frequency phasors,
▪ the subscript “d” and “q” refer, respectively, to the d- and q-components of a variable, ▪ hatted variables indicate the desired values,
▪ primes (apostrophes) indicate the reference values.
Figure 2.2 Basic structure of a converter controller.
Measurement filter
The first element is a measurement low-pass filter (see section 1.3). Its goal is to remove the harmonics generated by the converter. This filter has a gain of unity at the grid frequency. The type of filter and its parameters are detailed in section 4.4 including the simulation results.
Outer control loop
Current limiter Active power production, Control mode (normal/FRT) P/Q-priority
Inner control loop
dq-to-abc transformation Measured parameters in pu Filtered parameters Measurement filter abc-to-dq transformation Desired currents Reference currents
Reference converter voltages
Reference converter voltages in phase domain
2.1.1 abc-to-dq transformation
The goal of the abc-to-dq transformation (direct-quadrature transformation) is to convert a given set of three AC signals under steady, balanced conditions into a set of two DC signals. Most converter controllers use this technique because DC signals are easier to manipulate and regulate. Furthermore, the active and reactive components of the current are independently controllable. The zero sequence current does not exist as the GSC is connected with only 3 wires.
The dq transformation is realized using the transformation matrix T:
0 ( ) dg a qg b c g v v v v v v T (2.1) where
cos( ) cos( 2 / 3) cos( 2 / 3 ) 2
( ) sin( ) sin( 2 / 3) sin( 2 / 3)
3 1/ 2 1/ 2 1/ 2 t T (2.2) a
v , v , b v are the instantaneous measured and filtered phase voltages at the PGC, and c vdg, vqg,
0g
v are the d, q and 0 components of the 3 previous voltages.
The phase angle of the rotating reference frame is derived by the double synchronous reference frame (DSRF) PLL [49] (Figure 2.3). A PI controller adjusts at the synchronous speed to have the q-component of the positive sequence voltage equal to zero, i.e., to have the direct axis aligned with the voltage.
In (2.1) and thereafter, variable names denoted by lower-case letters represent the TD variables.
After this block, all filtered voltages and currents are in dq domain. As the d-axis is aligned with the voltage, the d-axis current corresponds to the active current and q-axis current represents the reactive current.
Figure 2.3 EMTP-RV diagram of the DSRF PLL.
2.1.2 Outer control loop
The third element is the outer control loop which calculates the desired active and reactive currents from the measurements. The reference direction for the currents is from the GSC to the PGC.
A PI controller on the DC-link voltage deviation from 1 pu provides the desired active current ˆ
dg
i . The active power coming from the MSC is determined by a MPPT system in the MSC controller. dneg dpos qneg qpos wt a b c abc to dq Vabc_to_Vdq Va Vb Vc Vdpos Vqpos Vdneg Vqneg Vabc Vdq_pos Vdq_neg f(u) 1
(u[1]) MODULO (2*pi) f f(u) 1 u[1] / (2*pi) wt c #w# PI controller out_ini u out Vabc
DC
teta dn dn_s qn dm qn_s qm DCnDC
teta dn dn_s qn dm qn_s qm DCp 3-ph to dq0 0 a b c d q wt 3-ph to dq0 0 a b c d q wt -1 dneg dpos qneg qpos wt a b c LPF LPF LPF LPFFor the reactive current, the outer loop is a proportional gain on the positive sequence voltage deviation, where the reference voltage depends on the WPC (Figure 1.5). As the WP is represented by an aggregated turbine and collector grid, the circuit becomes:
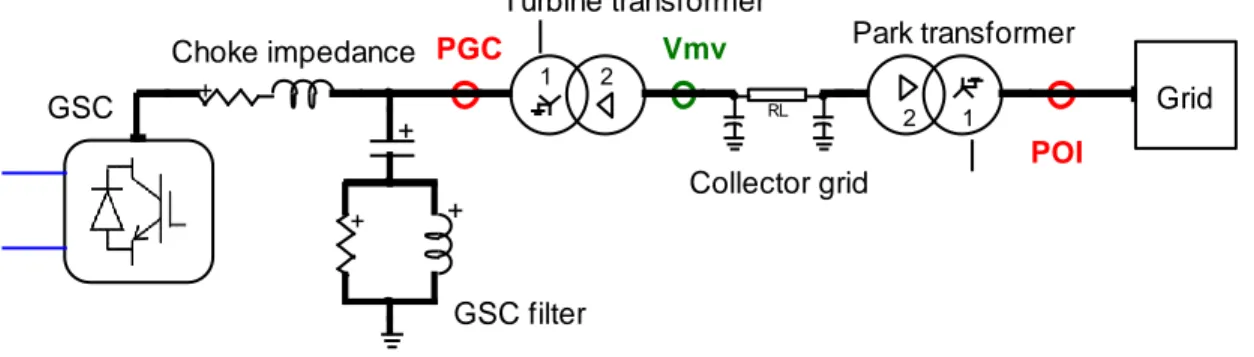
Grid GSC filter Turbine transformer Collector grid Park transformer POI Choke impedance GSC PGC Vmv + + + RL 2 1 1 2 +
Figure 2.4 Circuit of the aggregated type-IV based WP.
To simplify the circuit, only one of the two shunt filters has been displayed in Figure 2.4 (instead of 2).
As the model is aggregated, the output of the park controller U is fed directly to the outer loop of the converter controller. Therefore, V . The outer loop equation for reactive current is: U
ˆqg V 1 ctrl
i K UV (2.3)
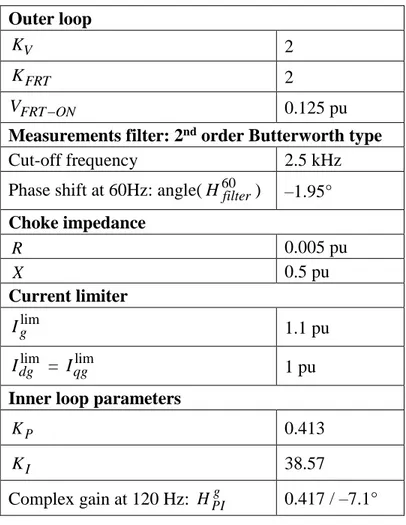
where ˆiqg is the desired reactive current, KV is the proportional gain (KV 0), and Vctrl is the magnitude of the positive sequence controlled voltage. The controlled voltage is either the PGC voltage or the voltage at the MV side of the turbine transformer (Vmv in Figure 2.4). The MV is not measured, but calculated from the turbine transformer series impedance as well as the voltage and current at the PGC. This is the case also in practice, because of the cost of the voltage and current transformers on the MV side.
The controller also has an FRT mode during large voltage sags. In this thesis, this mode generates a reactive current component proportional to voltage deviation from 1pu (Figure 2.5). The FRT mode is essential if the grid code requires voltage support.
The FRT mode is activated only when the controlled positive sequence voltage is off the deadband. In Figure 2.5, the FRT mode is activated for a voltage deviation from 1 pu by at least 0.1 pu, and the FRT gain (the slope) is 2.
Figure 2.5 Example of an FRT curve [50]. The outer loop equation in FRT mode becomes:
ˆ 1
qg FRT ctrl
i K V (2.4)
whereKFRT is the proportional gain (KFRT ). 0
When the controlled voltage falls slightly below the FRT activation limit, the FRT mode can push the voltage above this activation limit. In the TD, when the FRT mode is activated, the controller stays in this mode for a fixed duration to avoid repetitive mode changing.
The deadband represents the usual or normal conditions (positive sequence voltage between 0.9 and 1.1 pu). In this deadband, the park controller regulates the reactive power, voltage or power factor at the POI.
2.1.3 Current limiter
During voltage sags, ˆidgand ˆiqgcan be too large and damage the converter. A first bound is set on each component: Idglimfor the d-axis and Iqglimfor the q-axis. According to those bounds, the total current magnitude can still be too large for the converter. Consequently, a maximum current magnitude Iglimthat the converter can stand due to thermal constraints is set (usually between 1.1 and 1.4 pu). Idglimand Iqglim are equal to or less than Ilimg . The total current magnitude is
-1 deadband 0.5 0.9 FRT gain = 2 1.1 ˆ qg i ctrl V
![Figure 1.3 Limit curves for the voltage pattern at the grid connection for non-synchronous generator [12]](https://thumb-eu.123doks.com/thumbv2/123doknet/2334034.32380/25.918.118.790.124.567/figure-limit-curves-voltage-pattern-connection-synchronous-generator.webp)
![Figure 2.5 Example of an FRT curve [50]. The outer loop equation in FRT mode becomes:](https://thumb-eu.123doks.com/thumbv2/123doknet/2334034.32380/44.918.316.612.122.331/figure-example-frt-curve-outer-loop-equation-frt.webp)