UNIVERSITÉ DE MONTRÉAL
NATURAL PORE PRESSURE FLUCTUATIONS IN A CHAMPLAIN CLAY DEPOSIT
VAHID MAREFAT
DÉPARTEMENT DES GÉNIES CIVIL, GÉOLOGIQUE ET DES MINES ÉCOLE POLYTECHNIQUE DE MONTRÉAL
THÈSE PRÉSENTÉE EN VUE DE L’OBTENTION DU DIPLÔME DE PHILOSOPHIAE DOCTOR
(GÉNIE CIVIL) AVRIL 2016
UNIVERSITÉ DE MONTRÉAL
ÉCOLE POLYTECHNIQUE DE MONTRÉAL
Cette thèse intitulée :
NATURAL PORE PRESSURE FLUCTUATIONS IN A CHAMPLAIN CLAY DEPOSIT
présentée par : MAREFAT Vahid
en vue de l’obtention du diplôme de : Philosophiae Doctor a été dûment acceptée par le jury d’examen constitué de :
M. SILVESTRI Vincenzo, Ph. D., président
M. CHAPUIS Robert P., D. Sc. A., membre et directeur de recherche M. DUHAIME François, Ph. D., membre et codirecteur de recherche M. COURCELLES Benoît, Doctorat, membre
DEDICATION
ACKNOWLEDGEMENTS
First of all, I would like to express my deepest appreciation to my advisor monsieur Dr. Robert P. Chapuis for his excellent supervision and insight, both of which made this dissertation possible. I am also deeply thankful to my co-advisor Dr. Francois Duhaime for his outstanding guidance and support during my research and field work. I am indebted to you for your significant role in my doctoral work.
My thanks to the members of committee, Dr. Vincenzo Silvestri, Dr. Benoit Courcelles, and Dr. Olivier Cuisinier for reading of this dissertation and providing valuable comments that improved the contents of this dissertation. I am very thankful to Dr. Frank A. Spane for his contribution as a co-author in the third paper. My gratitude also goes out to my colleagues in the Laboratoire d'hydrogéologie et environnement minier, specially Noura, Lu, Simon, Karim, Richard, Ando, Saeid, Émilie, Marie-lin, Pierre-Luc and several summer students for their help in field installation, laboratory tests and data collection. I would also like to acknowledge all of my friends who supported me during my studies, especially Dr. Behnam Ferdosi, Dr. Siavash Isazadeh, and Dr. Tohid Alizadeh. Many thanks to all the students of professors Robert P. Chapuis, Michel Aubertin, and Li Li. Thanks for my friends in A351.4 for all the great times that we have shared.
I also express my sincerest recognition to BFI Canada and Natural Sciences and Engineering Research Council of Canada. This thesis would not be completed without the financial support provided by them.
Most importantly, I am deeply thankful to my family for their love, support, and dedication. None of this would have been possible without your love and patience. My beloved parents, my devoted brothers, and my lovely sisters receive my deepest gratitude and love for their continuous love, support, sacrifices, and encouragement from the early phases of my education which that provided the foundation for my PhD. I am indebted to you all for your unconditional love, support, and your significant role in my life. I am also very thankful to my beloved parents-in-law for their support and encouragement. This last word of acknowledgement I have saved for my dear wife Samira for her understanding and love during my doctoral work. I am deeply thankful to you Samira.
RÉSUMÉ
Les argiles Champlain recouvrent les basses terres de la vallée du Saint-Laurent au Québec, dans l’est du Canada. Ces argiles ont été déposées il y a approximativement 12000 à 8500 ans dans la mer Champlain, tard dans la période du Quaternaire. Les argiles Champlain jouent un rôle crucial dans le contrôle des écoulements souterrains. Ces argiles contrôlent et protègent les aquifères sous-jacents des contaminants en provenance de la surface ou des couches plus perméables près de la surface. La conductivité hydraulique (K) est un paramètre fondamental pour estimer la vitesse d’écoulement, la vitesse de migration des contaminants et la consolidation des argiles. Du point de vue de la géotechnique, des valeurs représentatives des paramètres élastiques de l’argile applicables à de très faibles déformations sont nécessaires pour comprendre le comportement de l’argile sous des sollicitations dynamiques.
Les essais standards de laboratoire fournissent des valeurs pour les propriétés élastiques de l’argile qui dépendent du remaniement et des changements d’état de contrainte. Ces essais surestiment la compressibilité et sous-estiment le module élastique des argiles pour de très faibles déformations. Les essais conventionnels réalisés sur le terrain (p.ex. pressiomètre) sous-estiment aussi le module élastique pour les dépôts d’argile. Cette sous-estimation peut être causée par une augmentation des déformations due à l’installation de l’équipement pour la réalisation de l’essai. Des essais dynamiques spécifiques (p.ex. analyse multimodale des ondes de surface) sont utilisés pour mesurer les modules élastiques applicables à de très faibles déformations. La variation de la pression interstitielle causée par les changements de pression atmosphérique est une avenue prometteuse pour la mesure des propriétés élastiques des argiles pour de très faibles déformations.
Les essais de perméabilité in situ sont à privilégier pour la mesure de K dans les argiles. L’obtention de valeurs in situ de K par la réalisation d’essais à niveau variable dans des puits d’observation est une procédure commune. Toutefois, ce type d’essai produit des valeurs de K qui sont des estimations de la perméabilité horizontale autour du massif filtrant, pas de la perméabilité verticale à grande échelle. Cette dernière est plus importante pour l’étude de la protection des aquifères. Quand la perméabilité est anisotrope, les deux composantes, verticale et horizontale (Kh et Kv), doivent être déterminées. L’interprétation d’un essai de pompage réalisé dans un aquifère en tenant compte du débit de fuite en provenance de l’aquitard permet en théorie
de déterminer Kv. Toutefois, ce type d’essai ne s’applique pas toujours aux conditions réelles sur le terrain et il ne peut pas toujours être utilisé sur les sites contaminés. Une analyse combinée, basse et haute fréquences, des variations naturelles des pressions interstitielles dans l’argile, par exemple en raison des cycles annuels d’infiltration et des variations de la pression atmosphérique, peut être utilisée pour mesurer la valeur in situ de K et son anisotropie.
Les variations à long terme de la charge hydraulique dans la couche d’argile sont aussi importantes pour l’estimation de la vitesse de l’eau souterraine dans la couche d’argile. Le suivi à long terme de la pression interstitielle permet d’étudier les variations de la charge hydraulique. Dans un système hydrogéologique où les gradients hydrauliques sont faibles, les variations de la pression interstitielle causées par les changements de pression atmosphérique peuvent mener à des valeurs erronées du gradient. De plus, les changements de pression atmosphérique influencent la charge de pression pour les essais de perméabilité in situ. Par conséquent, les fluctuations de la pression interstitielle causées par les changements de pression atmosphérique devraient être corrigées avant l’interprétation de ces essais.
Les fluctuations naturelles de la pression interstitielle dans les dépôts d’argile peuvent être mesurées avec des piézomètres à corde vibrante (VWP), un type de capteur qui répond rapidement aux changements de pression. Les VWP peuvent être installés dans l’argile selon la méthode conventionnelle avec un massif filtrant, ou selon la méthode avec scellement complet du forage (fully grouted). La méthode de scellement complet reçoit depuis quelques temps plus d’attention. Selon certains, cette méthode a les avantages suivants : coûts plus faibles, pas de risque de rupture du massif filtrant et facilité d’installation. Toutefois, la performance des piézomètres installés selon cette méthode (temps de réponse et précision) n’a pas encore été validée.
Dans cette thèse, une solution analytique a été combinée avec la méthode des éléments finis pour déterminer l’erreur piézométrique en régime permanent pour des piézomètres installés dans l’argile avec la méthode du scellement complet. Les performances des piézomètres installés avec cette méthode dépendent de trois paramètres : le rapport entre la perméabilité du coulis et la perméabilité de l’argile (Kg/Kc), la composante verticale du gradient hydraulique naturel dans l’aquitard, et la profondeur du capteur dans l’aquitard. Pour un gradient hydraulique vertical inférieur à 1, l’erreur piézométrique est négligeable lorsque la perméabilité du coulis est jusqu’à
un ordre de grandeur plus grande que celle de l’argile. Pour un rapport Kg/Kc inférieur à 10, la position du capteur a une influence négligeable sur l’erreur piézométrique. Toutefois, lorsque le rapport Kg/Kc est supérieur à 100, l’erreur augmente avec la profondeur du forage et du capteur. Les paramètres élastiques applicables pour de très faibles déformations ont été calculés à partir de la mesure in situ de l’efficacité de chargement (LE). Le paramètre LE représente la portion de la pression atmosphérique qui est portée par l’eau interstitielle d’un aquitard. Ce paramètre peut être déterminé à partir de plusieurs méthodes. Cette thèse a comparé trois méthodes de calcul : régression linéaire, inspection visuelle et fonction de réponse de la charge hydraulique (BHRF). Des valeurs de LE entre 0.8 et 0.95 ont été obtenues pour le dépôt d’argile de Lachenaie. La méthode de régression linéaire a produit des valeurs de LE plus élevées que les deux autres méthodes. L’analyse des BHRF a révélé que le paramètre LE est influencé par le délai hydraulique ou la fréquence de la sollicitation. Les BHRF ont fourni des valeurs stables de LE. On note que les trois méthodes testées dans la thèse ont fournies des valeurs de LE qui diffèrent par moins de 10 % pour un piézomètre donné.
En se basant sur la mesure in situ du paramètre LE, la compressibilité verticale et l’emmagasinement spécifique de l’argile ont respectivement été évalués à 1×10⁻⁶
kPa-1 et 1×10⁻⁵ m-1. Le module de rigidité pour des déformations latérales empêchées a aussi été calculé et comparé à des valeurs déduites de la littérature en supposant un coefficient de Poisson entre 0.3 et 0.5. Une comparaison des paramètres élastiques obtenus à partir de l’analyse in situ de LE présentée dans cette thèse avec ceux qui ont été obtenus avec le pressiomètre, l’œdomètre et les essais de choc hydraulique confirme que la compressibilité de l’argile dépend des déformations. Le paramètre LE fournit des modules élevés qui sont valides pour de très faibles déformations et pour de l’argile non remaniée, alors que les essais conventionnels sur le terrain et au laboratoire produisent des modules plus faibles.
La valeur de Kh de l’argile a été obtenue à partir de la réponse des pressions interstitielles pour des variations de la pression atmosphérique à haute fréquence. La faible perméabilité de l’argile de Lachenaie produit des BHRF qui montrent une variation exponentielle de la charge semblable à celle qui est observée lors d’un essai de perméabilité à niveau variable. L’allure générale des BHRF correspond au comportement observé pour un aquifère à nappe captive affecté par l’emmagasinement du puits. La méthode des éléments finis a été utilisée pour simuler
l’écoulement autour des massifs filtrants et des capteurs à corde vibrante pour un changement instantané de la pression (essai à charge variable) comme analogue aux BHFR observées. L’ajustement de courbes-types numériques et des BHRF observées sur le terrain a fourni des valeurs de Kh semblables aux valeurs de Kv. Comme pour les essais de perméabilité in situ, l’analyse des BHRF évalue Kh à proximité du massif filtrant.
Les valeurs de Kv et Kh produites par l’analyse temporelle multiéchelle des variations naturelles de la pression d’eau sont à la limite inférieure des valeurs de K obtenues auparavant pour la région couverte par les sites expérimentaux. Ces valeurs de K plus faibles peuvent être expliquées dans une certaine mesure par l’effet de la compressibilité des gaz à l’intérieur de la cavité. À Lachenaie, on observe un dégazage pour certains puits installés dans le roc et on sait que l’argile contient de la matière organique et qu’elle peut produire du gaz.
Une comparaison des valeurs de Kv et Kh obtenues respectivement à partir des variations naturelles de la pression d’eau sur une base annuelle et à partir des variations de la pression atmosphérique ne montrent pas d’anisotropie pour l’argile de Lachenaie. Le rapport d’anisotropie varie entre 0.45 et 1.67. Cette observation est en accord avec les déterminations précédentes de l’anisotropie pour le dépôt de Lachenaie et pour le reste du bassin de la mer Champlain. De plus, les valeurs de Kh et Kv présentées dans cette thèse ont respectivement été obtenues à l’échelle du mètre et à l’échelle de la dizaine de mètres. La similitude des valeurs obtenues pour ces deux échelles montre le haut degré d’intégrité du dépôt d’argile de Lachenaie.
Le gradient hydraulique naturel à l’intérieur de la couche d’argile a présenté des changements significatifs pour certains sites durant la période de suivi. Pendant la période de suivi, le gradient hydraulique est passé de -0.01 à 0.6 sur le site 6 à proximité de la rivière des Mille-Îles, et de 0.01 à 0.1 sur les autres sites. La régression multiple et la méthode par inspection visuelle ont été utilisées pour corriger les données de pression interstitielle pour les changements de pression atmosphérique. Pour la plupart des piézomètres, les deux méthodes ont fourni des résultats presque identiques. Toutefois, pour les piézomètres avec une fonction BHRF montrant une réponse plus lente, la méthode de régression-multiple a fourni des courbes de la pression en fonction du temps qui sont plus lisses que celles de la méthode par inspection visuelle.
ABSTRACT
Champlain clays cover the lowlands of the Saint Lawrence River valley in Quebec, in eastern Canada. The clays were deposited approximately from 12000 to 8500 BP (before present) in the Champlain Sea, during the late Quaternary Period. Champlain clay aquitards play a crucial role in defining groundwater regimes; they control recharge and protect underlying aquifers from surface contamination. The clay K value is a fundamental parameter to estimate flow velocity, the rates of contaminant migration, and time-dependent clay deformation. From a geotechnical standpoint, representative values of the clay elastic parameters for very small-strain are needed to understand the dynamic behaviour of clay deposits.
Standard laboratory tests often yield elastic properties that depend upon sample disturbance and stress changes in clay samples: they are known to overestimate the compressibility and underestimate the elastic moduli for clay deposits. Conventional field tests (e.g., pressuremeter test) also underestimate very small-strain elastic moduli for clay deposits. This may be caused by an increase in strain due to soil disturbance during installation of testing equipment. Specific field dynamic tests (e.g., multi-modal analysis of surface wave) are recommended to estimate very-small strain elastic moduli. Pore pressure response to barometric pressure changes can be envisioned as a very small-strain test which can be used to estimate the elastic properties of the clay deposits.
In-situ permeability tests are preferred to measure K in clay deposits. Variable-head tests conducted in observation wells are common in-situ testing procedure. Nevertheless, the obtained hydraulic conductivity mainly represents the horizontal component around the intake zone (medium-scale) rather than the large-scale vertical one. The vertical hydraulic conductivity is appropriate in aquifer vulnerability assessment. When hydraulic conductivity anisotropy is present, both the vertical and horizontal components (Kv and Kh) must be determined. Aquifer
pumping tests with leakage through the aquitard may yield, in theory, the clay deposit Kv.
However, these tests cannot be adapted to a wide range of field conditions and may not always be used where groundwater is contaminated. A combined analysis of low- and high-frequency natural pore pressure response to in-situ loading, such as barometric pressure changes and annual groundwater recharge cycle, can be used to measure in-situ hydraulic conductivity and its anisotropy.
Long-term variations of hydraulic head within the clay layer are also of importance to estimate flow velocity within the clay layer. Baseline pore pressure monitoring allows the natural hydraulic head variations to be investigated. In an aquifer and aquitard system with a low hydraulic gradient, pore pressure fluctuations associated with barometric pressure changes may lead to erroneous gradient estimates. In addition, barometric pressure changes influence pressure head responses and in-situ permeability tests results. Therefore, pore pressure fluctuations caused by barometric pressure change should be removed from data series prior to test interpretation. Natural pore pressure fluctuations in clay deposits can be measured with a quick response vibrating wire pressure transducer (VWP). The VWP can be installed in a clay deposit with either the conventional sand pack procedure or the fully grouted method. The fully grouted method has recently received more interest and is said to have advantages including reduced cost, no risk of failure for the sand pack, and ease of installation. However, piezometer performance (piezometer response time and measurement accuracy) is still questioned.
In this thesis, an analytical solution was combined with a finite element analysis to determine the piezometric error for fully grouted piezometers installed within clay deposits under steady state conditions. The success of a fully grouted piezometer installed in a clay deposit depends upon three parameters: permeability ratio (ratio of grout permeability Kg to surrounding aquitard permeability Kc), natural vertical hydraulic gradient within the aquitard, and installation depth within the aquitard. For field conditions with a vertical hydraulic gradient of less than 1, the piezometric error is insignificant for a grout permeability by up to one order of magnitude greater than the surroundig soil permeability. For a lower permeability ratio (i.e., Kg/Kc ≤ 10) borehole
geometry has no significant impact on piezometric error. However, for permeability ratios greater than 100, the error increases with borehole depth.
Very small strain elastic parameters were calculated based on in-situ loading efficiency (LE) analysis. LE is a portion of the barometric pressure borne by aquitard pore fluid. It can be calculated with several methods. This thesis examined three methods to determine LE including linear regression, visual inspection, and barometric head response function (BHRF). LE values between 0.8 and 0.95 were obtained for the Lachenaie clay deposit. The linear regression method provided greater LE values than the other two methods. The BHRF analysis revealed that the LE
in clay is time-lag or frequency dependent and delivered stable LE values. Nevertheless, the three methods provided values for LE within a 10% range for a given piezometer.
The vertical compressibility and specific storage were about 1×10⁻⁶ kPa-1 and 1×10⁻⁵ m-1 respectively, based on in-situ LE analysis approach. The constrained modulus was also calculated and compared with values obtained from literature by assuming a Poisson’s ratio between 0.3 and 0.5. A comparison of the clay elastic parameters derived from the in situ LE analysis in this thesis with those obtained with pressuremeter, oedometer, and pulse tests confirmed that the clay compressibility is strain dependent. The LE calculation yields a high modulus for a very small-strain (undisturbed conditions), whereas the field and laboratory tests provide a lower modulus. Values on the order of 1×10⁻⁵ m2/s and 1×10⁻¹⁰ m/s were obtained for vertical hydraulic diffusivity and conductivity respectively, in the Lachenaie clay deposit. The vertical hydraulic diffusivity was determined from spectral frequency analysis of downward low-frequency cyclic groundwater recharge through the clay layer. Analysis of low-frequency pore pressure cycles provides hydraulic properties that are representative of the large-scale field condition. Spectral analysis utilizing Fast Fourier Transform provided the pressure head amplitude associated with an annual cycle which is required for hydraulic diffusivity calculation. Applying direct in-situ values of specific storage in the definition of the vertical hydraulic diffusivity yielded an in-situ Kv for
the clay aquitard.
The clay Kh was obtained from analysis of pore pressure response to high-frequency barometric
pressure fluctuations. For low permeability Lachenaie clay, BHRF shows an exponential pattern similar to a slug test response. The general shape of BHRF conforms to the pressure behaviour of a composite confined aquifer with a wellbore storage model. A finite element model was used to simulate the groundwater seepage around the sealed cavity caused by an instantaneous pressure change (i.e., slug test), as analogue to the observed BHRF. Curve fitting between observed BHRF and numerical simulation, both in type curve format, provided a horizontal hydraulic conductivity close to the vertical one. Similar to in-situ variable-head tests, BHRF analysis measures Kh in the
immediate vicinity of the intake zone.
The Kv and Kh values provided with the multi-timescale analysis of natural pore pressure response (pore pressure responses to short-term barometric pressure change and long-term vertical groundwater recharge cycle) are at the lower bound of previously obtained K values for
the same study area. The low hydraulic conductivity values could be explained to some extent by the effects of gas compressibility within closed piezometer cavity. In Lachenaie, some wells installed in the underlying bedrock are continuously degassing and the clay contains some organic matter known to produce gas.
A comparison between Kv and Kh obtained respectively from natural pore pressure response to
groundwater recharge cycles and barometric pressure changes shows insignificant permeability anisotropy for Lachenaie clay. The anisotropy ratio (Kv/Kh) was between 0.45 and 1.67. This
agrees with previous works at laboratory scale and previous findings for the same study area and for other localities in the former Champlain Sea basin. In addition, Kv and Kh represent clay
hydraulic conductivity for large- and medium-scale respectively. Matching permeability values obtained from analyses conducted at different scales show a high degree of integrity for the Lachenaie clay deposit.
The natural hydraulic gradient within the clay layer changes significantly on some test sites due to their hydrogeological characteristics. During this study, there was a significant change in natural gradient from -0.01 to 0.9 at site 6 next to Mille-Iles River and from 0.01 to 0.1 at the other sites. The multiple-regression and visual inspection methods were applied to correct the pore pressure data series for barometric pressure fluctuations. For most piezometers, both methods provided nearly identical results. However, for piezometers with slow BHRF response, the multiple-regression method provided smoother pore pressure time series than the visual inspection method.
TABLE OF CONTENTS
DEDICATION... III ACKNOWLEDGEMENTS ... IV RÉSUMÉ ...V ABSTRACT ... IX TABLE OF CONTENTS ... XIII LIST OF TABLES ... XVIII LIST OF FIGURES ... XX LIST OF SYMBOLS AND ABBREVIATIONS... XXIV LIST OF APPENDICES ... XXXII
CHAPTER 1 INTRODUCTION ... .1
1.1 Background ... 1
1.2 Objectives ... 5
1.3 Scope and content ... 6
CHAPTER 2 LITERATURE REVIEW ... .10
2.1 In-situ pore pressure measurement ... 10
2.2 Effective stress principle ... 13
2.3 Stress strain relationship ... 14
2.4 Pore pressure response to natural loading in clay layer ... 17
2.5 In-situ estimation of clay aquitard elastic properties ... 19
2.6 Methods for loading efficiency calculation ... 22
2.7 Barometric response function (BRF/BHRF) ... 23
2.7.1 Unconfined aquifer model ... 25
2.8 Mathematical equations to calculate BRF/BHRF ... 26
2.9 Methods to eliminate barometric pressure effect ... 29
2.9.1 Simple linear model ... 29
2.9.2 Visual inspection method ... 30
2.9.3 Multiple regression method ... 30
2.9.4 Frequency-based method ... 30
2.10 Clay hydraulic conductivity ... 31
2.10.1 Prediction of saturated hydraulic conductivity ... 31
2.10.2 Laboratory tests ... 33
2.10.3 Conventional field tests ... 34
2.10.4 Natural pore pressure analysis to estimate clay hydraulic conductivity ... 39
2.11 Simple spectral frequency analysis and filtering ... 41
2.12 Hydraulic conductivity anisotropy ... 44
2.13 Champlain clay ... 44
2.13.1 Preconsolidation pressure ... 45
2.13.2 Clay stiffness parameters ... 46
CHAPTER 3 ARTICLE 1 : FULLY GROUTED PIEZOMETERS: IMPLICATIONS FOR PORE PRESSURE MONITORING IN CLAY LAYERS ... 53
3.1 Introduction ... 54
3.2 Grout properties ... 56
3.3 Development of VWP, error sources, and limitations ... 58
3.4 Methodology ... 61
3.5 Analytical solution ... 64
3.5.1 Downward seepage ... 64
3.6 Numerical simulation ... 68
3.7 Results and discussion ... 70
3.7.1 Piezometric error versus permeability ratio (Kg/Kc) ... 77
3.7.2 Piezometric error versus vertical hydraulic gradient ... 81
3.7.3 Piezometric error versus L/b ratio ... 82
3.8 Conclusion ... 85
3.9 Acknowledgements ... 85
3.10 References ... 85
CHAPTER 4 ARTICLE 2 : PORE PRESSURE RESPONSE TO BAROMETRIC PRESSURE CHANGE IN CHAMPLAIN CLAY : PREDICTION OF THE CLAY ELASTIC PROPERTIES... 89
4.1 Introduction ... 90
4.2 Theoretical undrained response to barometric pressure change ... 93
4.3 Geological setting of the study area ... 95
4.4 Material and methods ... 96
4.4.1 Piezometer installation ... 96
4.4.2 Assessment of loading efficiency ... 100
4.4.3 Correcting pore pressure time series ... 102
4.5 Results and discussion ... 103
4.5.1 Estimation of loading efficiency ... 104
4.5.2 Pore pressure correction ... 112
4.5.3 Estimation of clay elastic parameters ... 114
4.5.4 Hydraulic heads and vertical gradient in the study area ... 120
4.6 Conclusion ... 122
4.8 References ... 123
CHAPTER 5 ARTICLE 3 : ESTIMATES OF IN-SITU VERTICAL AND HORIZONTAL HYDRAULIC DIFFUSIVITY AND CONDUCTIVITY FOR A SHALLOW CLAY AQUITARD, USING A COMBINED NATURAL RECHARGE AND BAROMETRIC PRESSURE RESPONSE APPROACH ... 129
5.1 Introduction ... 130
5.2 Material and methods ... 133
5.2.1 Study site description and piezometer installation ... 133
5.2.2 Estimation of in-situ vertical hydraulic conductivity-diffusivity ... 136
5.2.3 Time-domain barometric head response function (BHRF) ... 138
5.2.4 Estimation of in-situ horizontal hydraulic conductivity ... 139
5.2.5 Numerical modeling ... 141
5.3 Results and discussion ... 144
5.3.1 Vertical hydraulic diffusivity-conductivity of the clay ... 146
5.3.2 Barometric head response function ... 157
5.3.3 Horizontal hydraulic conductivity ... 160
5.4 Conclusion ... 164
5.5 Acknowledgements ... 165
5.6 References ... 166
CHAPTER 6 SUMMARY AND GENERAL DISCUSSION ... 171
CHAPTER 7 CONCLUSION AND RECOMMENDATION ... 184
7.1 Conclusion ... 184
7.2 Recommendation ... 187
LIST OF TABLES
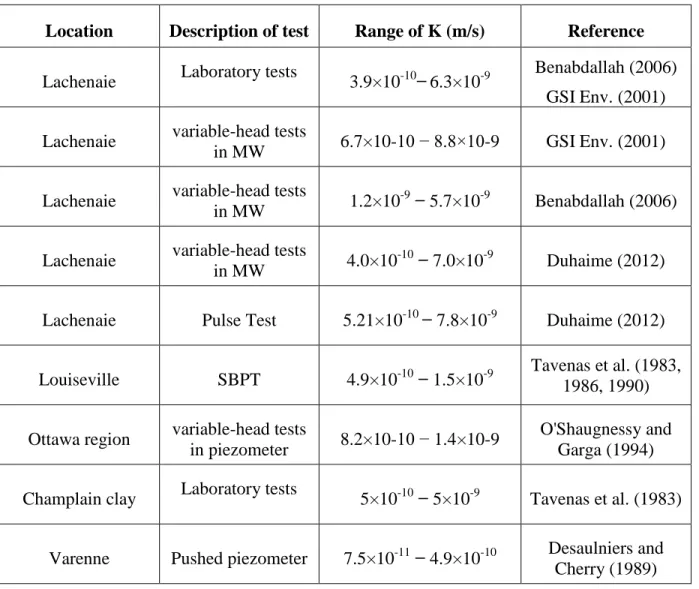
Table 2.1: Typical K values in Champlain clay. Laboratory tests include triaxial and oedometer
tests. ... 39
Table 2.2: Some published mechanical properties for Champlain clay. Where σ′p is preconsolidation pressure, Cc and Cr are virgin compression and recompression indexes, OCR is overconsolidation ratio, GS is specific gravity of solids, G0, Gmax, and G are small strain, very small strain and secant shear modulus respectively, HFT is hydraulic fracture test, SBPT is self-boring pressuremeter test, PMT is prebored pressuremeter test, ISCT is instrumented sharp cone test, FC is fall cone test, PPT is probed pressuremeter test, PMT is pushed ... 51
Table 2.2: Some published mechanical properties for Champlain clay. Where σ′p is preconsolidation pressure, Cc and Cr are virgin compression and recompression indexes, OCR is overconsolidation ratio, GS is specific gravity of solids, G0, Gmax, and G are small strain, very small strain and secant shear modulus respectively, HFT is hydraulic fracture test, SBPT is self-boring pressuremeter test, PMT is prebored pressuremeter test, ISCT is instrumented sharp cone test, FC is fall cone test, PPT is probed pressuremeter test, PMT is pushed (continued). ... 52
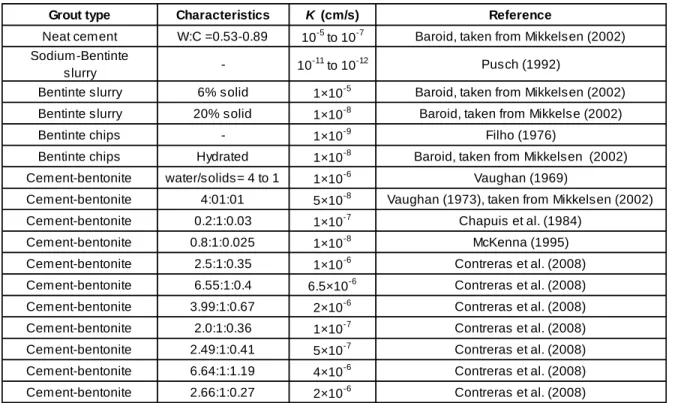
Table 3.1: Some published values of hydraulic conductivity for net cement, bentonite slurry, bentonite chips, and cement-bentonite grout. ... 57
Table 3.2: Dimensionless variables considered in the numerical and analytical calculations. ... 70
Table 4.1: Calculated values for LE with various methods, Lachenaie study area. ... 106
Table 4.2: Estimated values for the elastic properties of Lachenaie clay deposit. ... 119
Table 5.1: Vertical hydraulic diffusivity and conductivity calculation in sites 2 and 4 Lachenaie. where TP is period of the input pore pressure signal, αz/αs is amplitude ratio, z is the distance from top of the aquitard to top of the monitored interval, Dv is vertical hydraulic diffusivity, LE is loading efficiency, n is porosity, Ss is specific storage, and Kv is vertical hydraulic conductivity. ... 156
Table 5.2: Horizontal hydraulic conductivity estimation from curve fitting between BHRF and predicted numerical result. n is porosity, Dcavity is the cavity diameter, Lcavity is the cavity
length, Vcavity is cavity volume, G is shear modulus obtained from in-situ pulse tests by
Duhaime and Chapuis (2014), ΔVcavity is cavity volume change obtained using Eq. (5.7), mv
is clay compressibility obtained from loading efficiency calculation, and Kh is estimated clay
horizontal hydraulic conductivity... 161 Table 5.3: Hydraulic conductivity anisotropy estimation for a shallow clay aquitard in the
Lachenaie area near Montreal, Quebec, Canada. Kh is obtained from curve fitting between
BHRF and predicted numerical result. K*v is the mean vertical hydraulic conductivity for a
period between 410 and 341 days (frequency between 0.00244 and 0.00293 days-1). ... 164 Table 6.1: Comparison between various permeability tests in terms of scale and direction of the
measurement. H = horizontal, V = vertical, S = small, M = medium, L = large, MW = monitoring well, PWP = pore water pressure, BP = barometric pressure, GW = groundwater. ... 177 Table A.1: Raw pore pressure and barometric pressure change data from 01/01/2013 to
02/01/2013, Lachenaie area (2AH).. ... 206
LIST OF FIGURES
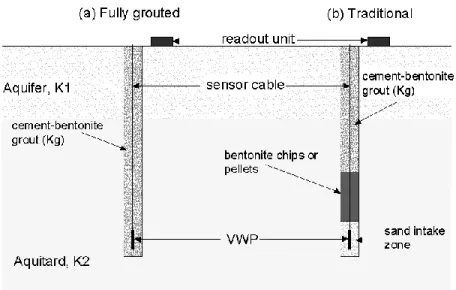
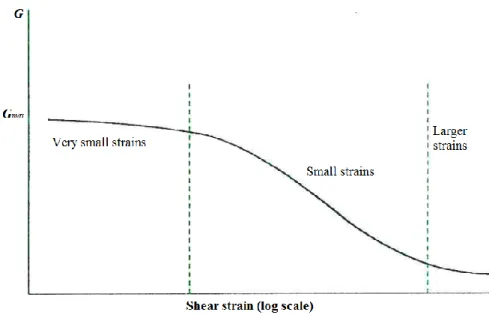
Figure 2.1: Vertical sketch of VWP installation: a) fully grouted method; b) traditional method. 11 Figure 2.2: idealized variation of soil stiffness versus large range of strain, after Viggiani and
Atkinson (1995) ... 16
Figure 2.3: Loading efficiency versus vertical compressibility ... 19
Figure 2.4: Well/aquifer BRF model, adapted from Spane (2002). ... 25
Figure 2.5: Typical e- log(K) relationship for Champlain clay. ... 34
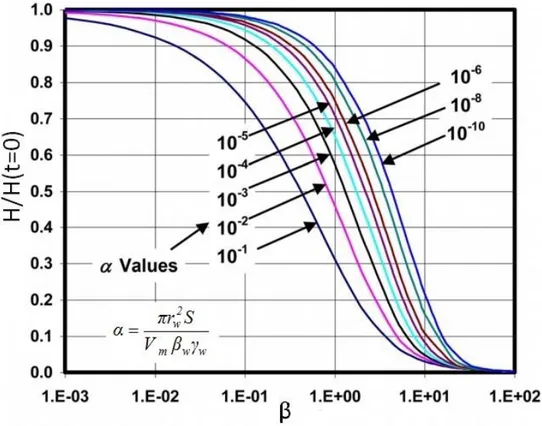
Figure 2.6: Graph of type curves as proposed by Cooper et al. (1967) and Bredehoeft and Papadopulos (1980), adapted from Chapuis (2015). ... 37
Figure 2.7: Schematic representation of Fourier transform ... 42
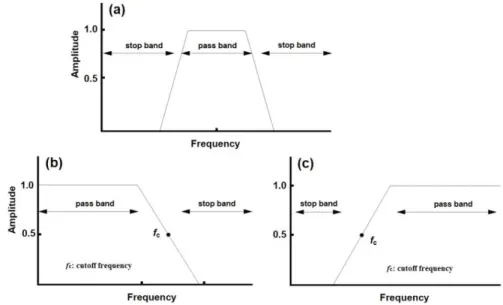
Figure 2.8: Schematic representation data filtering: a) bandpass filter, b) lowpass filter, and c) highpass filter. ... 43
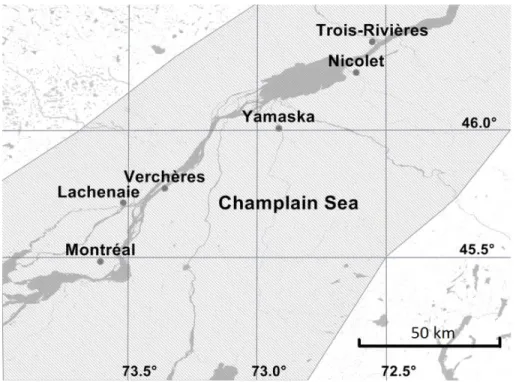
Figure 2.9: Maximum area covered by the Champlain Sea in southern Quebec, adapted from Duhaime (2012) ... 45
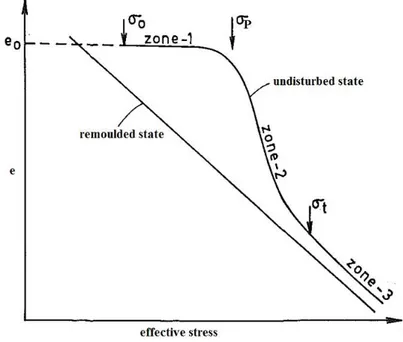
Figure 2.10: Typical stress-strain curve for a sensitive clay, after Nagaraj et al. (1990) ... 47
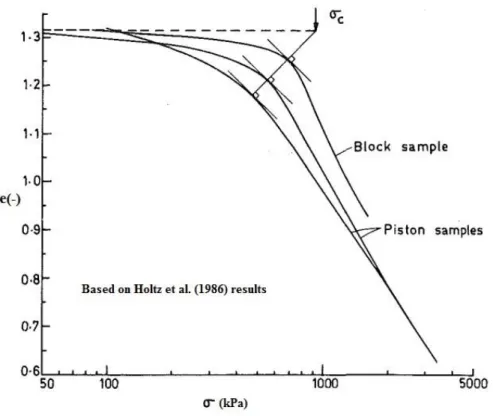
Figure 2.11: Effect of sample disturbance in a sensitive clay, adapted from Nagaraj et al. (1990) ... 48
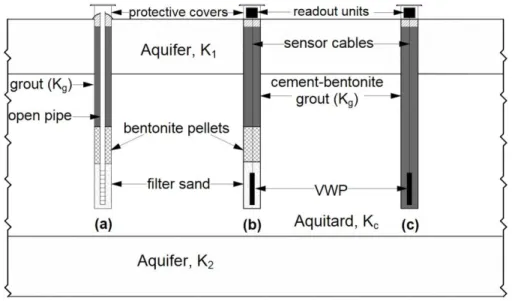
Figure 3.1: Vertical sketch of piezometer installation within a clay deposit: a) standpipe piezometer; b) VWP with sand pocket; and c) fully grouted VWP. ... 59
Figure 3. 2: Hydraulic head profiles within a homogenous clay formation before and after VWP installation with sand pocket: a) downward flow; b) upward flow. ... 62
Figure 3.3: Hydraulic head profile within a clay layer with a fully grouted installation ... 63
Figure 3.4: Schematic representation of the analytical study for a fully grouted borehole within a clay formation with (Kg >> Kc): a) downward flow; b) upward flow. ... 65
Figure 3.6: Equipotential and flow lines around fully grouted borehole for i*= 0.5: a) L/b = 0.5
and Kg/Kc= 10, and b) L/b = 0.5 and Kg/Kc =1000, c) L/b = 0.2 and Kg/Kc = 1000, d) L/b =
0.9 and Kg/Kc= 1000, e) L/b = 0.2 and Kg/Kc= 10, f) L/b = 0.9 and Kg/Kc = 10. ... 71
Figure 3.7: Hydraulic head profile in the radial direction at an elevation corresponding to the bottom of the borehole for L/b = 0.9: a) i*= 0.5 and b) i*=1. ... 73
Figure 3.8: Variation of the radial hydraulic gradient at the borehole sidewall versus elevation for
i*= 0.5: a) L/b = 0.2 and b) L/b = 0.9. ... 75
Figure 3.9: Hydraulic head profile along borehole axis (Seep/W) for i*= 0.5 and L/b =0.9. ... 76
Figure 3.10: Best-fit α1 coefficient for the analytical solution versus the L/b ratio. ... 77
Figure 3.11: Piezometric error versus Kg/Kc: a) L/b = 0.2 downward flow; b) L/b = 0.5 downward
flow; c) L/b = 0.9 downward flow; d) L/b = 0.2 upward flow; e) L/b = 0.5 upward flow; and f) L/b = 0.9 upward flow. ... 78 Figure 3.12: Piezometric error versus vertical hydraulic gradient for L/b = 0.5 (downward flow). ... 82 Figure 3.13: Piezometric error versus L/b ratio for downward flow: a) Kg/Kc = 10; b) Kg/Kc =
100, c) Kg/Kc = 1000. ... 83
Figure 4.1: Maximum area covered by the Champlain Sea in southern Quebec, adapted from Duhaime et al. (2013a). ... 95 Figure 4.2: Locations and identification of the study area, adapted from Duhaime et al. (2013a). ... 96 Figure 4.3: Summarized stratigraphy of study sites (adapted from Duhaime, 2012). ... 97 Figure 4.4: Detail of the VWP installation in MW. ... 99 Figure 4.5: Observed change in barometric stress, site 2 versus site 9 from Jul. 2013 to Nov.
2014. ... 104 Figure 4.6: Observed pore pressure and barometric pressure measurements, Lachenaie: a)
piezometers 2AH and 2AB from Nov. 2012 to Nov. 2014; b) piezometers 6AB and 9AB from Nov. 2013 to Nov. 2014. ... 107
Figure 4.7: Observed pore pressure and barometric pressure changes, Lachenaie from Jan. 2014 to Apr. 2014 (selected period): a) 2AH and 2AB; b) 6AB and 9AB. ... 109 Figure 4.8: Examples of pore pressure variation versus barometric pressure change for Jan. 2014
to Apr. 2014: a) piezometer 2AH; b) piezometer 6AB. ... 110 Figure 4.9: Barometric response functions for Jan. 2014 to Apr. 2014. ... 111 Figure 4.10: Corrected pore pressure time series, piezometer 2AB from Jan. 2014 to Apr. 2014. ... 114 Figure 4.11: Corrected pore pressure time series using multiple regression technique from Nov.
2012 to Nov.2014, Lachenaie, site 2. ... 115 Figure 4.12: Constrained modulus of M obtained from various methods for diverse locations in
the Champlain sea basin. ... 118 Figure 4.13: Variation of vertical hydraulic gradient from Nov. 2013 to Nov.2014, site 6. ... 121 Figure 5.1: Location and identification of the test sites, adapted from Duhaime et al., (2013). .. 134 Figure 5.2: Vertical view of MWs and VWPs installation. ... 135 Figure 5.3: Typical BHRF of absolute pressure head for closed piezometers completed within
Lachenaie clay, modified from Marefat et al. (2015a). ... 140 Figure 5.4: Detail of the refined mesh used for the numerical simulation with SEEP/W. ... 143 Figure 5.5: Change in barometric pressure (B), Lachenaie area, near Montreal, Quebec, Canada. ... 144 Figure 5.6: Observed absolute pressure head (u), Lachenaie site 2 from Nov. 2012 to Apr.2015;
a) 2S; b) 2AH; c) 2AB; and d) 2R. ... 145 Figure 5.7: Well/piezometer band-pass filtered daily head responses from mean values,
Lachenaie site 2, time interval: 11/16/2012 to 04/13/2015. ... 147 Figure 5.8: Spectral frequency analysis comparison: a) Well 2S and Piezometer 2AH; b) Well 2S
and Piezometer 2AB; and c) Well 2S and Well 2R. ... 149 Figure 5.9: Spectral frequency analysis: amplitude ratio comparison. ... 151 Figure 5.10: Vertical hydraulic diffusivity calculated from spectral frequency analysis. ... 152
Figure 5.11: Vertical hydraulic conductivity estimates. ... 154 Figure 5.12: Change in barometric pressure (B), observed pore pressure (u), well-water level, and
corrected pore pressure. Lachenaie site 2 between Jan. 2014 and Apr.2014: a) 2S and 2R; b) 2AH and 2AB. ... 159 Figure 5.13: Sensitivity of the numerical model to: a) clay hydraulic conductivity; b) cavity
volume change; and c) clay compressibility. ... 162 Figure 5.14: Horizontal hydraulic conductivity estimation from fitting observed BHRFs with
numerically predicted type curves for piezometers: a) 2AH, b) 2AB, c) 3AB, and d) 4AH. ... 163 Figure 6.1: Frequency spectrum comparison between Earth tide fluctuations and pore pressure
response, piezometer 2AH (data from January 1st to April 1st 2014). ... 174 Figure 6. 2: Frequency spectrum comparison between barometric loading and pore pressure
response, piezometer 2AH (data from January 1st to April 1st 2014). ... 175 Figure 6. 3: Frequency spectrum comparison between long-term pore pressure cycles in clay and
groundwater cycle in shallow aquifer, data from Nov. 2012 to Jul. 2015 (site 2, Lachenaie). ... 180
LIST OF SYMBOLS AND ABBREVIATIONS
Symbols
αs amplitude of the pore pressure wave at the top of the aquitard αz amplitude of the pore pressure wave at depth (z)
α0 regression intercept (-)
α1 best-fit coefficient (-)
b thickness of the clay layer (m)
Bave average barometric pressure at test site (kPa)
Bsea average barometric pressure head at sea level (kPa) B observed barometric pressure (kPa)
BE barometric efficiency (-)
βw compressibility of the water (kPa-1)
C geometric shape factor (m)
Cc compression index (-) Cr recompression index (-)
Cs swelling index (-)
CU coefficient of uniformity (-)
Dcavity cavity diameter (m)
Dv vertical hydraulic diffusivity (m2/s)
δ0 regression coefficient relating to time lag of 0 (-)
δi coefficients of the multiple linear regression (-)
δˆ least square estimator matrix
ΔBt change in barometric pressure, Bt-Bt-1 (kPa)
(ΔB)t-1 change in pore water pressure for a previous time step (kPa)
(ΔB)t-m change in pore water pressure for m previous time steps (kPa) Δσ change in total stress (kPa)
Δσ’ change in effective stress (kPa)
Δut change in pore water pressure, ut-ut-1 (kPa)
Δp change in cavity pressure (kPa)
Δuw transient pore pressure in excess of the hydrostatic pressure (kPa)
ΔVcavity change in cavity volume (m3)
ΔX explanatory variable matrix ΔY dependent variable matrix
e void ratio (-)
ε error (m)
ԑT earth tide components
ET evapotranspiration
Emax low-strain elastic modulus (kPa)
F complex Fourier component
g gravitational acceleration (m/s2)
G shear modulus (kPa)
Gma very small-strain shear modulus (kPa) G0 low strain shear modulus (kPa)
Gs average specific gravity of solid (-) GXX one-side autospectral density function
H difference in hydraulic head between the soil in natural condition and the borehole bottom (m)
H(t) difference in hydraulic head (m)
H(t=0) initial difference in hydraulic head (m)
h1 hydraulic head in the upper aquifer (m) h3 hydraulic head in the lower aquifer (m)
h* natural hydraulic head in the clay before installation of a piezometer (m)
hp measured hydraulic head in the fully grouted borehole (m) iAB vertical hydraulic gradients between levels A and B (-)
iBC vertical hydraulic gradients between levels B and C (-) i* vertical hydraulic gradient in the clay layer (-)
J fluid source or sink
K hydraulic conductivity matrix
K1 hydraulic conductivity of the upper sandy aquifer (m/s)
Kc hydraulic conductivity of the clay layer (m/s)
K2 hydraulic conductivity of the lower sandy aquifer (m/s)
Kg hydraulic conductivity of the cement-bentonite grout (m/s) Kv vertical hydraulic conductivity (m/s).
Kh horizontal hydraulic conductivity (m/s)
L depth of the fully grouted borehole in the clay layer (m)
Lcavity cavity length (m)
LE loading efficiency (-).
mv compressibility of the formation (kPa-1)
M constrained modulus (MPa)
n porosity of the formation (-)
OCR preconsolidation ratio (-)
ρw unit mass of water (kg/m3)
Q0 flow rate coming from upper sandy layer into the borehole (m3/s)
Q1 flow rate injected to the clay layer from borehole side wall (m3/s) q flow rate for unit length of the borehole (m2/s)
σ total stress (kPa) σ total stress matrix
σ′ effective stress matrix
σ′v vertical effective stress (kPa)
σ′P preconsolidation pressure (kPa)
r0 radius of influence (m) rw radius of the borehole (m)
R runoff
Sinj internal cross section of piezometer (m2)
Ss specific storage (m-1)
SXX two-sided autospectral density function
t time (s)
T transmissivity (m2/s)
TP fluctuation period (s)
Tm temperature (ºC)
u observed pore pressure head (m).
u* corrected relative pore pressure (kPa)
ut observed absolute pore water pressure at time step t (kPa)
ut-1 observed absolute pore water pressure at previous time step (kPa) uw hydrostatic pore water pressure (kPa)
V Darcy’s velocity vector
Vcavity volume of sand cavity (m3) Vs shear wave velocity (m/s)
v Poisson's ratio (-)
wL liquid limit (-) ω cyclical frequency
z elevation (m)
z1 elevation of the top of the clay layer (m) z3 elevation of the bottom of the clay layer (m)
z* elevation of the fully grouted piezometer in the clay layer (m)
Abbreviations
APT Atmospheric Pressure Transducer BHRF barometric head response function BRF barometric response function
BETCO Barometric and earth Tide Response Correction BRF Barometric Response Function
FFT Fast Fourier transformation
KGS-BRF Kansas Geological Survey Barometric Response Function MMASW multi-modal analysis of surface wave
MW Monitoring Well
PT Pressure Transducer
SBPM self-boring pressuremeter tests
SPSS Statistical Package for the Social Sciences VWP Vibrating Wire piezometer
HFT Hydraulic fracture test
PMT Prebored pressuremeter test ISCT instrumented sharp cone test
LIST OF APPENDICES
APPENDIX A MATLAB SCRIPT FOR BRF/BHRF CALCULATION AND REMOVING BAROMETRIC PRESSURE EFFECTS ... 204 APPENDIX B MATLAB SCRIPT FOR FFT CALCULATION AND FILTERING ... 209
CHAPTER 1
INTRODUCTION
1.1 Background
The southern lowlands of the Saint Lawrence River valley in Quebec, in eastern Canada, are covered with sensitive soft marine clay referred to as Champlain clay. The clay layer plays an important role in defining groundwater regimes; it controls recharge and protect underlying groundwater from surface contamination. Champlain clay can also be a safe location for hazardous waste storage. Meanwhile, clay aquitards in general are a poorly understood constituent of groundwater systems (Cherry et al., 2004). In geotechnical engineering, clay layers are often the most challenging components of foundation engineering problems and slope stability analyses. Representative values of their mechanical (e.g., compressibility and shear modulus) and hydraulic properties (e.g., hydraulic conductivity and diffusivity) are required for site hydrogeological characterisation and engineering applications.
The elastic and hydraulic properties of clay layers can be determined from both small core samples and in-situ tests. Laboratory tests are known to overestimate the compressibility of geological materials (Klohn, 1965; Clark, 1998; van der Kamp, 2001b). Due to sample disturbance and stress change in clay samples (Clark, 1998), laboratory tests often yield elastic properties that are questionable. This is often the case for sensitive Champlain clays (e.g., La Rochelle and Lefebvre, 1971; Tavenas et al., 1974; La Rochelle et al., 1981). In addition, when heterogeneities are present within an aquitard, the standard laboratory tests often yield matrix permeability values which are not representative of large-scale in-situ conditions (Bradbury and Muldoon, 1990; Bredehoeft et al., 2008). In-situ tests are recommended to determine clay hydraulic and elastic properties.
There are several standard methods to determine in-situ elastic and hydraulic properties of clay deposits. For example, the in-situ elastic properties of clay can be determined directly from self-boring pressuremeter tests or using correlations with cone penetration test and vane shear test results (e.g., Silvestri and Abou-Samra, 2008). The common in-situ tests that allows clay hydraulic conductivity and diffusivity to be measured include variable-head tests in monitoring wells (MWs), and pulse tests (e.g., van der Kamp, 2001b). These conventional field tests mainly provide values for the horizontal hydraulic conductivity for immediate vicinity of the MW intake
zone (Hussein et al., 2013; Odling et al., 2015). When the hydraulic conductivity is anisotropic in an aquitard, the vertical component of permeability is an important factor in assessing contaminant migration. The vertical hydraulic conductivity of clay aquitards can be obtained in the field by conducting aquifer pumping tests that considers leakage from clay aquitard (Hantush, 1956). Such a test can be costly and time consuming and may not be adaptable for a wide-range of field test conditions.
This thesis propose to use analysis of in-situ natural pore pressure response to barometric pressure change and vertical groundwater recharge cycle to calculate clay aquitard horizontal and vertical hydraulic conductivity and its anisotropy. Pore pressure in clay layers reacts to various natural phenomena including barometric pressure change, Earth and ocean tide fluctuations, precipitations, ground water recharge and discharge events (Timms and Acworth, 2005; Anochikwa et al., 2012; Hussein et al., 2013; Smith et al., 2013; Smerdon et al., 2014). Among the variety of natural stress sources, pore pressure response to barometric stress changes deserves more attention. Atmospheric pressure changes are continuous and ubiquitous and the solicitation and response data can be obtained with relative ease (Seo, 1999). Hydrogeologists taken advantage of these naturally occurring pore pressure fluctuations to estimate aquitard properties (e.g., Timms and Acworth, 2005; Anochikwa et al., 2012; Hussein et al., 2013; Smith et al., 2013). This approach is useful for example where groundwater is contaminated and conventional in-situ tests are limited (Furbish, 1991).
Long-term low-frequency vertical groundwater recharge cycles can be used to estimate large-scale clay vertical hydraulic properties (Keller et al., 1989; Neuman and Gardner, 1989). The amplitude of the groundwater recharge cycle imposed by the surficial aquifer is attenuated and lagged while propagating downward within the clay aquitard. The amplitude attenuation for a given signal period is required for vertical hydraulic diffusivity calculation. Previous studies performed by Keller et al. (1989) and Timms and Acworth (2005) simply subtracted the associated well hydrographs to calculate the attenuation in the groundwater recharge amplitude. This graphical method is inaccurate because it depends upon scale and visual appreciations. However, a more accurate method is needed to calculate pressure head amplitude corresponding to a given signal frequency.
geotechnical, mining, and groundwater engineering. Due to the appreciable response time of open standpipe piezometers, faster diaphragm-type transducers (e.g., vibrating wire piezometers) are preferred to monitor pore pressures within clay formations. The conventional sand pack procedure for standpipe piezometer has been adapted and used with fast diaphragm-type piezometers by the geotechnical and mining industry for decades (Hvorslev, 1951; Dunnicliff, 1988). Some practitioners have proposed to eliminate the sand filter around the piezometer, and to grout completely the borehole after having positioned the sensor. This method is referred to as the fully grouted installation method. Nevertheless, the performance of fully grouted piezometers is still questioned by some practitioners in hydrogeology and geotechnique. Previous investigators have noted that the success of fully grouted piezometers depends only on grout permeability and a few authors have tried to prove that a grout more permeable than the target formation induces a small error (e.g., Vaughan, 1969; Mikkelsen and Green, 2003; Contreras et al., 2008). However, from field results, McKenna (1995) concluded that the grout permeability should be lower than surrounding soil permeability in order to reduce piezometric error. One can see that there are inconsistencies in the grout criteria.
Clay elastic parameters associated with very small strain deformations are required to understand the dynamic behaviour of clay deposits (e.g., Lefebvre et al., 1994; Youd et al., 2001). For example, the very small strain shear modulus allows sites to be classified according to their response to earthquakes (Canadian Geotechnical Society, 2006). In this context, the need to study very-small strain parameters for clay deposits is becoming more significant. These parameters can be determined by in-situ geophysical methods (e.g., multi-modal analysis of surface wave) and laboratory methods (e.g., resonant column tests). Loading efficiency measurements from the analysis of the natural pore pressure response to barometric pressure changes can be envisioned as a very small-strain test. Loading efficiency is the ratio of change in aquifer total head to the change in barometric pressure (i.e., that portion of the barometric pressure borne by aquitard pore fluid). Loading efficiency analysis provides clay elastic parameters that are associated with very small strains and very low clay disturbance.
Most of the previous studies dealing with the analysis of loading efficiency and the natural pore pressure response in clay aquitards were limited to simple linear regression models or visual inspection methods (Timms and Acworth, 2005; Smith et al., 2013; Smerdon et al., 2014). However, for cases involving a time lag between barometric pressure change and piezometer
response, these methods do not model the complex relationship between pressure head response and barometric pressure change (Weeks, 1979; Furbish, 1991; Rasmussen and Crawford, 1997). For such cases, barometric response functions, BRF, or barometric head response functions, BHRF can be used to analyze the time-dependent pore pressure response to barometric pressure change (Furbish, 1991; Rasmussen and Crawford, 1997).
In time domain, BRF and BHRF are impulse functions which represent well water-level/aquifer total head response for a unit change in barometric pressure (Spane, 2002). The BRF and BHRF can be determined from slug and pulse test solutions (Rasmussen and Crawford, 1997). The obtained model can be used to estimate the permeability of geological units (Spane, 2002). In time domain, BRF is calculated by performing a multiple regression. BRF has been presented in a type-curve format to determine hydraulic properties for a few aquifer/aquitard systems. Previous studies performed by Butler et al. (2011) and Hussein et al. (2013) fitted BRF from an underlying confined aquifer response with an analytical model to determine the vertical hydraulic diffusivity for the overlying confining layer. None of the previous studies utilized actual aquitard pressure responses obtained from partially penetrating wells within clay aquitards as a basis for estimating in-situ aquitard hydraulic properties.
The influence of barometric pressure changes on well water-level/pore pressure have been used to monitor contaminated aquifer and aquitard systems (Hare and Morse, 1997; Hare and Morse, 1999), and as an indicator of underlying aquifer vulnerability (Hussein et al., 2013; Odling et al., 2015). Major fluctuations in well water-level associated with barometric stress changes lead to hydraulic gradients and flow velocities that are inaccurate (Rasmussen and Crawford, 1997; Seo, 1999; Spane, 2002). In addition, barometric pressure change can disguise the results of in-situ permeability tests (Supardi, 1993; Rasmussen and Crawford, 1997; Spane, 2002). An appropriate technique should be selected for various field conditions in order to eliminate the influence of such fluctuations on pore pressure response.
Natural, even homogenous, soils are known to develop some hydraulic conductivity anisotropy during deposition and the densification process (Chan and Kenney, 1973; Olson and Daniel, 1981; Al-Tabbaa and Wood, 1987; Chapuis and Gill, 1989; Chapuis et al., 1989; Scholes et al., 2007). Permeability anisotropy is an important parameter for the analysis of seepage through earth dams and dykes, contaminant migration, settlement rates for clays, design of drainage
systems, and optimum design of oil or water well fields (e.g., Chapuis and Gill, 1989). In clay-rich sediments, the permeability anisotropy is caused by changes in particle orientation, size and shape of pores (Neuzil, 1994). The in-situ anisotropy of clay aquitards can be assessed based on conventional slug tests in partially penetrating wells of different aspect ratios (Hvorslev, 1951) and from aquifer pumping tests with leakage from clay aquitards (Hantush, 1956). These field tests however, may not be adaptable for a wide-range of field conditions and can be cost intensive. The assessment of permeability anisotropy for Champlain clay has been limited to laboratory work (Tavenas et al., 1983a; Leroueil et al., 1990; Duhaime, 2012) which may not be representative of field conditions.
Despite previous research efforts regarding the analysis of the natural pore pressure response in clay aquitards, some gaps remain. They can be summarized as follows:
The capacity and limitations of fully grouted piezometers for pore pressure measurements in clay aquitards are not fully understood.
For clay aquitards, time lag is not taken into account when evaluating the loading efficiency and when correcting raw pore pressure data for barometric effect. The impact of the time lag on these estimates is not well understood.
The factors impacting the BHRF shape for clay aquitards and the link between this shape and the in-situ horizontal hydraulic conductivity remains unclear.
For low-frequency groundwater cycle, the spectral frequency analysis was not used when calculating hydraulic diffusivity and conductivity. The isolated groundwater recharge for a period of year was not clearly analyzed.
The link between natural pore pressure response and hydraulic conductivity anisotropy in large-scale remains unclear.
1.2 Objectives
The main and specific objectives of this thesis can be summarized as follows:
1. Determining the limitations of the fully grouted installation method when it is deployed for pore pressures measurement within clay layers (Paper 1).
2. Estimating the in-situ elastic parameters of Lachenaie clay for very small strains from the natural pore pressure response to barometric pressure changes (Paper 2).
The specific objectives of paper 2 were:
2.1. Calculating the loading efficiency for the Lachenaie clay aquitard using three methods of linear regression, visual inspection and BHRF.
2.2. Investigating the capability of BHRF to remove barometric pressure effects on pore pressure response in a soft clay aquitard.
2.3. Monitoring long-term variations of vertical hydraulic gradient within a Champlain clay layer.
3. Estimating the in-situ vertical and horizontal hydraulic diffusivity and conductivity from multi-timescale analysis of a combined low- to high-frequency natural pore pressure response (Paper 3).
The specific objectives of paper 3 were:
3.1. Determining the in-situ vertical hydraulic diffusivity and conductivity for Lachenaie clay aquitard from analysis of long-term pore pressure response to low-frequency vertical groundwater recharge cycle.
3.2. Determining the in-situ horizontal hydraulic conductivity for Lachenaie clay aquitard from analysis of short-term pore pressure response to high-frequency barometric pressure change (BHRF analysis).
3.3. Assessing the in-situ hydraulic conductivity anisotropy for Lachenaie clay based on a multi-timescale analysis of the natural pore pressure response (i.e., pore pressure responses to short-term barometric loading and long-term groundwater recharge cycle).
1.3 Scope and content
It is proposed in this study that the in-situ elastic and hydraulic properties of soft and sensitive Champlain clay can be determined by a combined analysis of low- and high-frequency pore
pressure response to barometric pressure change and groundwater recharge cycle. This dissertation includes seven chapters: Chapter 1 presents the background, gaps in knowledge, and objectives of the study. Chapter 2 of this dissertation presents a state of art and practice literature review on the following themes:
In-situ pore pressure measurement, Effective stress principle,
Stress-strain relationship,
Pore pressure response to natural loading in clay layer, In-situ estimation of clay aquitard elastic properties, Methods for loading efficiency calculation,
Barometric response function,
Mathematical equations for multiple-regression, BRF/BHRF and groundwater vulnerability,
Methods for eliminating the effects of barometric pressure fluctuations, Clay hydraulic conductivity,
Hydraulic conductivity anisotropy,
Simple spectral frequency analysis and filtering, Champlain clay and its mechanical properties.
Chapters 3 through 5 are the main part of this dissertation which includes three manuscripts. One of them was published and the others two were submitted to peer-reviewed journals:
Chapter 3: “Fully grouted piezometers: Implications for pore pressure monitoring in clay layers,” submitted to Engineering Geology on September, 2015.
Chapter 4: “Pore pressure response to barometric pressure change in Champlain clay: Prediction of the clay elastic properties,” published in Engineering Geology on November, 2015.
Chapter 5: “Estimates of in-situ vertical and horizontal hydraulic diffusivity and conductivity for a shallow clay aquitard, using a combined natural recharge and barometric pressure response approach,” submitted to Journal of Hydrology on January, 2016.
Four conference papers (Marefat et al. 2013, 2014, 2015a, and 2015b) were also published in the course of this doctoral work.
In summary, the main chapters (chapters 3 through 5) of this thesis include the followings:
Chapter 3 present presents analytical and numerical models to predict piezometric error for fully grouted piezometers installed within clay layer under steady state condition. With the fully grouted installation method, there is no sand filter around the piezometer. This method is said to have the following advantages: reduced cost, no risk of failure for the sand pack, and ease of installation, especially for nested piezometers. A closed-form equation for the piezometric error was derived and verified with the finite element code of SEEP/W. More than 300 numerical simulations were completed to assess the piezometric error equations. For a steady state flow, the piezometer performance is controlled by three factors: a) the permeability ratio, ratio of grout permeability to surrounding aquitard permeability, b) the natural vertical hydraulic gradient, and c) the borehole geometry. This paper is an introduction to the fully grouted installation method for a steady state groundwater flow condition. The piezometer performance under transient flow condition was not addressed in this paper. The problem was introduced in Marefat et al. (2015c) and orally presented in the 68th Canadian Geotechnical Conference, Quebec, Canada.
Chapter 4 discusses a detailed baseline natural pore pressure monitoring program on 5 study sites with a combined area of 50 km2 near Montreal in Quebec, Canada. This chapter provides very small-strain elastic properties for Lachenaie clay based on analysis of natural pore pressure response to barometric pressure changes. The compressibility values obtained in this thesis are up to two orders of magnitude smaller than those given by previous results of oedometer and pulse tests. This indicates strain dependency of clay elastic properties. This chapter also provides long-term variation for the natural vertical hydraulic gradient in the clay layer. The methods to extract the influence of barometric pressure changes on pore pressure response are discussed.
Chapter 5 presents a numerical and analytical model to assess in-situ vertical and horizontal hydraulic diffusivities-conductivities for clay deposits. A combined multi-timescale analysis of
groundwater recharge cycles and barometric pressure responses was used. Analysis of pore pressure response to the downward low-frequency (annual term) groundwater recharge cycles yielded large-scale values for the vertical hydraulic diffusivity. Applying direct in-situ values of specific storage in the definition of the vertical hydraulic diffusivity yielded a large-scale vertical hydraulic conductivity for the clay deposit. The clay horizontal hydraulic conductivity was determined from pore pressure response to short-term (high-frequency) barometric pressure change in terms of BHRF. In time domain, BHRF is an impulse response that describes pore pressure imbalance between borehole and surrounding clay associated with a unit change in barometric pressure. The pore pressure imbalance creates a transient flow between borehole and clay aquitard which is essentially horizontal for a partially penetrating well in the clay aquitard. The finite element code of SEEP/W was used to simulate the transient flow around the borehole as an analogue to BHRF. The horizontal hydraulic conductivity was estimated by curve matching between BHRF and predicted numerical model results. The obtained horizontal hydraulic conductivity from BHRF represents the value for the clay adjacent to the piezometer cavity zone, thus a local value, similar to in-situ variable head test results. However, the vertical hydraulic conductivity determined from analysis of low-frequency pore pressure cycles is a large-scale value for a multiple depth intervals along vertical direction. Analysis of low- and high-frequency pore pressure responses also provided a basis to assess hydraulic conductivity anisotropy in field scale without conducting extensive conventional tests.
It should be noted that the two manuscripts included in the Chapters 3 and 5 are based on those initially submitted to the journals. Subsequent corrections and reviews (as demanded by the Reviewers and Editors, and others), before publication in the Journals, are not included here. Thus, the final published papers may differ from the versions appearing in the dissertation. Chapter 6 gives a summary and discussion for the obtained results, and Chapter 7 presents main results and recommendations for future works.
CHAPTER 2
LITERATURE REVIEW
Pore pressures in aquifer/aquitard systems often respond to natural stresses such as atmospheric pressure fluctuations, Earth and ocean tides, groundwater recharge events, seismic waves, soil moisture storage, and human activities at ground surface. This natural pore pressure response results from the interaction between change in total stress, pore pressure and deformation in a porous medium. This interaction is governed by the mechanical and hydraulic properties of the porous medium. Hydrogeologists have long been interested in taking advantage of these natural pore pressure responses to determine aquifer/aquitard properties (Jacob, 1940; Jacob, 1950; van der Kamp and Gale, 1983; Rojstaczer, 1988a; Timms and Acworth, 2005; Hussein et al., 2013; Smith et al., 2013; Smerdon et al., 2014). However, measuring pore pressures within a clay layer is rarely a straightforward task in both hydrogeology and geotechnical engineering. An appropriate procedure should be selected for piezometer installation in order to measure in-situ pore pressures that are representative of the real clay aquitard condition.
2.1 In-situ pore pressure measurement
Open standpipe piezometers with a sand filter around the piezometer screen have traditionally been used for pore pressure measurement. A smaller inner diameter is essential to have a quick piezometer response (Hvorslev, 1951). In a low permeability formation (e.g., clay layer), the standpipe piezometer response is very slow due to slow pore pressure equalization between the piezometer screen and the formation. This results in a time lag between pressure change within the clay layer and piezometer response. Due to the appreciable response time of open standpipe piezometers, faster diaphragm-type transducers are needed to monitor pore pressures within clay formations (e.g., Hvorslev, 1951). Diaphragm-type piezometers only need a very small volume of water for full scale equalization (McKenna, 1995). A vibrating wire piezometer, VWP, is a kind of quick response diaphragm transducer that needs only 10-5 to 10-2 cm3 volume of water for full scale pore pressure equalization. The traditional sand-pack installation method of standpipe piezometers has been adapted for the installation of VWPs by the geotechnical industry (Dunnicliff, 1988). Although the fully grouted or grouted-in method for installation of faster diaphragm-type piezometers was first suggested by Vaughan (1969), the performance of this