INDICES MICROPALÉONTOLOGIQUES ET GÉOCHIMIQUES DE CHANGEMENTS RÉCENTS DE L'OXYGÉNATION ET LA TEMPÉRATURE
DES EAUX PROFONDES DU GOLFE DU ST-LAURENT
MÉMOIRE PRÉSENTÉ
COMME EXIGENCE PARTIELLE
DE LA MAÎTRISE EN SCIENCES DE LA TERRE
PAR
LINDA GENOVESI
RECENT CHANGES OF BOTTOM WATER OXYGENATION AND TEMPERATURE IN
THE
GULF OF ST. LAWRENCE:MICROPALEONTOLOGICAL AND GEOCHEMICAL EVIDENCES.
THESIS PRESENTED
AS PARTIAL REQUlREMENT FOR A MSc. IN EARTH AND ATMOSPHERIC SCIENCES
BY
LINDA GENOVESI
Service des bibliothèques
Avertissement
La diffusion de ce mémoire se fait dans le respect des droits de son auteur, qui a signé le formulaire Autorisation de reproduire et de diffuser un travail de recherche de cycles supérieurs (SDU-522 - Rév.01-2006). Cette autorisation stipule que (,conformément à
l'article 11 du Règlement no 8 des études de cycles supérieurs, [l'auteur] concède à
l'Université du Québec à Montréal une licence non exclusive d'utilisation et de publication de la totalité ou d'une partie importante de [son] travail de recherche pour des fins pédagogiques et non commerciales. Plus précisément, [l'auteur] autorise l'Université du Québec à Montréal à reproduire, diffuser, prêter, distribuer ou vendre des copies de [son] travail de recherche à des fins non commerciales sur quelque support que ce soit, y compris l'Internet. Cette licence et cette autorisation n'entraînent pas une renonciation de [la] part [de l'auteur] à [ses] droits moraux ni à [ses] droits de propriété intellectuelle. Sauf entente contraire, [l'auteur] conserve la liberté de diffuser et de commercialiser ou non ce travail dont [il] possède un exemplaire.»
Ce mémoire de maîtrise prend la forme d'un article scientifique, lequel sera soumis à la revue Limnology and Oceanography. Le texte répond aux exigences de cette revue, c'est pourquoi la langue anglaise a été utilisée et la forme diffère de celle recommandée par l'Université du Québec à Montréal. D'autres auteurs de l'Université du Québec à Montréal ont participé à la réalisation de cet article, soit Anne de Vernal et Benoît Thibodeau à la rédaction, Claude Hillaire-Marcel à
l'interprétation des données géochimiques et Taoufik Radi à la production et interprétation des résultats de fonctions de transfeli.
REMERCIEMENTS
En premier lieu, je tiens à remercier ma directrice de maîtrise, Mme Anne de Vernal, pour sa disponibilité, son orientation et ses conseils lors de la réalisation de mon projet de maîtrise. Je dois également la remercier sincèrement pour les nombreuses opportunités qu'elle m'a offelies lors de ces deux années, ce fût lm réel plaisir de travailler avec une directrice aussi enthousiaste et généreuse.
Je remercie également Benoît Thibodeau, Claude Hillaire-Marcel et Taoufik Radi pour leur impoliante contribution à ce travail, ainsi que pour leur patience et le temps qu'ils ont investi pour m'aider à réaliser ce projet. Un très grand merci à Bassam Ghaleb et Christelle Not pour leur énorme aide avec la chronologie. Merci aussi à tout le personnel du Geotop pour leur aide et leur support, ils ont rendu cette expérience d'autant plus agréable. Merci à Audrey Limoges et Isabelle Delainey pour leur aide avec les comptages de dinokystes et de foraminifères.
De plus, je tiens à remercier le Conseil de recherche en sciences naturelles et en génie du Canada (CRSNG) pour son soutien financier.
Et finalement, je veux remercier pour leur soutien, leurs encouragements et leur amour, ma famille et mes amis.
LISTE DES FIGURES vi
RÉSUMÉ viii
INTRODUCTION GÉNÉRALE 1
CHAPITRE I
RECENT CHANGES OF BOTTOM WATER OXYGENATION AND TEMPERATURE IN THE GULF OF ST. LAWRENCE:
MICROPALEONTOLOGICAL AND GEOCHEMICAL EVIDENCES .4
Abstract 5
1. Introduction 6
2. Oceanographie context 7
3. Material and methods 9
4. Results 13
4.1 Excess 210Pb, 137Cs and sedimentation rates .13
4.2 Dinocyst assemblages 14
4.3 Transfer functions 15
4.4 Geochemistry of organic matter in sediments 15
4.5 Benthic foraminifer assemblages 16
4.6 Isotopie composition ofbenthic foraminifera shells 17
5. Discussion 18
6. Conclusion 21
7. References 23
BIBLIOGRAPHIE GÉNÉRALE 36
APPENDICE A:
Dénombrement et concentrations des dinokystes, grains de pollen, spores, autres palynomorphes et foraminifères benthiques dans la carotte COROS03-CLOS-37BC ...40
APPENDICE B :
Reconstructions paléocéanographiques des paramètres de surface par la technique des analogues modernes dans la carotte COROS03-CLOS-37BC .49
APPENDICE C :
Résultats d'analyses géochimiques et isotopiques dans la carotte COROS03-CLOS
37BC S6
APPENDICE D:
Chronologie de la carotte COROS03-CLOS-37BC : modèles d'âges calculés à partir de l'excès de 210Pb après soustraction des différentes valeurs de 2l0Pb soutenu
possibles 60
APPENDICE E:
Planches photographiques de foraminifères benthiques pnses au mIcroscope
Figure 1. Map of the study area showing location of co ring sites. The circle corresponds to core COROS03-CLOS-37BC from the Gulf of St. Lawrence (48°20'N, 61°30'W; at 409 m water depth). The square and triangle respectively correspond to cores CR02-23 (48°42'N, 68°38'W; at 34S m water depth) and AHOO-2220 (48°38'N, 68°37'W; at 324 m water depth) collected in the Lower St. Lawrence Estuary and analysed by Thibodeau et al. (2006). The bathymetric contour represents 200 m ...28 Figme 2. In core COROS03-CLOS-37BC, A) 210Pb activity profile (dpm gO') as a function of depth; B-C) excess 210P b (ln) of maximal (2.34
±
0.36 dpm g-I) and minimal (1.89±
O.OS dpm g-l) supported fraction as a function of depth, the dotted lines represent the linear regressions used to calculate sedimentation rates; D) l37Cs activity profile (dpm g-l) as a function of depth; E) chronology (years) as a function of depth, the dot represents the 137 Cs peak which corresponds to approximately 1963. The upper 2 cm of the core (in grey) represent a layer of biological mixing. These upper samples were not taken into account in the calculation of sedimentation rates. Note that y-axis, although ail representing depth (cm), have different scales ...29 Figme 3. In core COROS03-CLOS-37BC, data as a function of depth A) dinocyst concentration (cysts g-l); B) relative abundance of the most abundant dinocyst taxa ... 30 Figme 4. Reconstruction of primary production based on the best analogue method, using A) the CZCS reference productvity data (Antoine et al., 1996); and B) the MODIS reference productivity data (Berhenfeld and Falkowski, 1997). The bold linesrepresent S-point running means .31
Figure S. In core COROS03-CLOS-37BC, data as a function of depth A) organic carbon (%); B) organic carbon to nitrogen ratio; C) Ôl3C (%0) of organic carbon; D)
Ô15N (%0). The bold curves represent S-point running means 32
Figure 6. In core COROS03-CLüS-37BC, data as a function of depth A) concentration of benthic foraminifera (tests gol), the bold curve represents calcareous taxa only, whereas the dotted curve corresponds to total concentrations including calcareous and agglutinated taxa. Agglutinated taxa were treated separately due to uncertainties linked to their preservation in sediments. In B), relative abundance of the main calcareous benthic foraminifer taxa (%) and the relative abundance of agglutinated taxa is shown in the last column to the right. The upper 8 cm of the core have been highlighted in grey as they show important changes in the benthic
foraminifera assemblages, according to our age models these changes started between
the 1940s and the 1960s 33
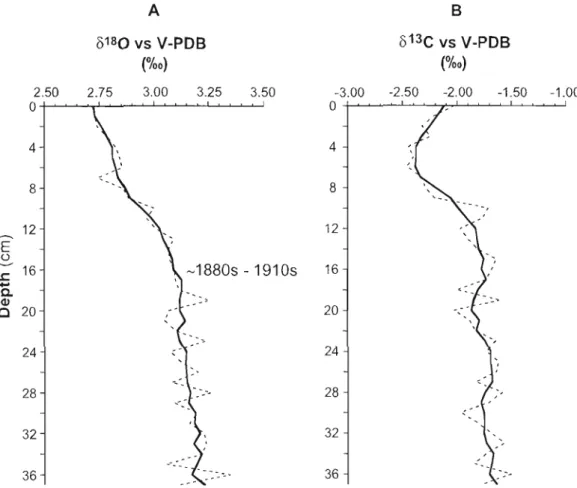
Figure 7. In core COROS03-CLOS-37BC, isotopie analysis of shells of benthic foraminifera Bulimina exilis as a function of depth A) 0180 (%0); B) 013C (%0). The bold curves represent S-point running means. According to our age models, the important 0180 decrease occurring from 16 to 0 cm depth started between the 1880s
L'analyse du contenu micropaléontologique et géochimique d'une carotte sédimentaire (48°20'N, 61°30'W, à 409 m de profondeur) prélevée dans le Chenal Laurentien du Golfe du St-Laurent a été effectuée dans le but de reconstruire les variations de productivité pélagique et de conditions benthiques au cours des derniers siècles. L'objectif de cette étude est de vérifier l'extension régionale de la tendance récente vers l'eutrophisation et l'hypoxie benthique récemment signalée dans l'Estuaire Maritime du St-Laurent. Les assemblages de dinokystes révèlent des conditions pélagiques relativement uniformes. Les données géochimiques (C organique, C/N) et isotopiques (8IJCorg, 815N) suggèrent également des flux organiques uniformes durant les derniers siècles. Cependant, des changements significatifs sont enregistrés dans les assemblages de foraminifères benthiques. L'augmentation de l'abondance relative des espèces Cassidulina laevigata et Brizalina subaenariensis dans les 8 cm supérieurs de la carotte suggère que les eaux profondes ont subi une diminution des concentrations en oxygène dissous durant les ~65 à 45 dernières années. De plus, la diminution de l'abondance relative de Nonionellina labradorica simultanée à l'augmentation de Oridorsalis umbonatus suggère une diminution de l'influence des eaux du Courant du Labrador par rapport à celles des eaux de l'Atlantique Nord dans le Chenal Laurentien. Une diminution de
~0,4 %0 de la composition isotopique (8\80 ) des tests carbonatés du foraminifère benthique Bulimina exilis indique un réchauffement des eaux profondes de près de l,4°C depuis environ un siècle. Ces résultats démontrent que le développement de l'hypoxie des eaux profondes est un phénomène régional à l'échelle de l'Estuaire et du Golfe du St-Laurent. Ils indiquent également que la cause de la diminution récente en oxygène dissous dans le Golfe du St-Laurent n'est pas principalement liée à une augmentation de productivité primaire, tel qu'en avait été l'hypothèse dans des études réalisées dans l'Estuaire du St-Laurent, mais plutôt à une augmentation de la température de la couche d'eau profonde.
Mots clés: hypoxie, dinokystes, foraminifères benthiques, géochimie, Golfe du St Laurent
Objectifs de J'étude
L'eutrophisation le long des marges continentales est souvent une source de préoccupation car il peut en résulter une hypoxie des eaux profondes (e.g. Cloem, 2001). Dans l'Estuaire du St-Laurent, sur la côte est du Canada, une diminution récente des concentrations en oxygène dissous a été démontrée par mesures directes (Gilbert et al., 2005) ainsi que par l'analyse de séquences sédimentaires (Thibodeau et al., 2006). Les mesures directes ont montré une réduction de 125 à 65 !lmol L-I entre les armées 1930 et le début du 21 e siècle (Gilbert et al., 2005), tandis que les
dormées sédimentaires suggèrent une tendance ayant débuté dans les années 1960 (Thibodeau et al., 2006). La teneur en oxygène dissous étant un paramètre essentiel
pour les communautés aquatiques, cette tendance récente vers l'hypoxie aura un impact capital sur l'écologie de l'Estuaire et du Golfe du St-Laurent (Gilbert et al.,
2007).
L'une des hypothèses est que l'hypoxie dans l'Estuaire maritime du St Laurent (EMSL) serait le résultat d'une augmentation des flux de carbone vers les fonds marins, conséquence d'une eutrophisation anthropique (Thibodeau et al.,
2006). Tel que démontré par Thibodeau et al. (2006) et Gilbert et al. (2005), l'utilisation croissante des fertilisants en agriculture est concomitante avec la réduction des teneurs en oxygène dissous dans l'EMSL. Cependant, une augmentation de la température des eaux profondes pourrait aussi partiellement expliquer la diminution récente des concentrations en oxygène dissous (Gilbert et al.,
2005).
Dans le but de vérifier l'étendue spatiale de la zone affectée par le développement de l'hypoxie ainsi que pour évaluer les changements de flux de carbone à une échelle de temps centenaire, nous avons analysé une carotte sédimentaire recueillie dans la partie centrale du Golfe du St-Laurent (48°20'N, 61°30W, à 409 m de profondeur) (Fig.!). La carotte a été prélevée dans le chenal
Laurentien, à une profondeur de 409 m, où les eaux profondes proviennent de l'Atlantique nord. Bien que la position de la carotte soit éloignée de l'EMSL, les eaux profondes dans le chenal y ont la même origine et des caractéristiques similaires en ce qui a trait à la température et la salinité, ces dernières se situant autour de 4-6°C et ~34,6 respectivement (Dickie et Trites, 1983). Ainsi, en ce qui concerne les conditions benthiques, la carotte COR0503-CL05-37BC du Golfe du St-Laurent (GSL) permet une comparaison directe avec les carottes AHOO-2220 et CR02-23 (Thibodeau et al., 2006) prélevées dans l'EMSL.
Des approches micropaléontologiques et géochimiques ont été utilisées afin d'estimer les changements de productivité primaire et de conditions benthiques dans le GSL durant les derniers siècles. Les assemblages de dinokystes ont été utilisés pour reconstruire la productivité de surface, car leur distribution est liée à la production planctonique et à la disponibilité des nutriments (e.g., Devillers et de Vernal, 2000;
Pospelova et al., 2002; Radi et al., 2007). Les flux biogéniques ont été évalués
à
l'aide de mesures géochimiques (Corg, C/N) et isotopiques (i513C, i5,sN) (e.g., Bratton et al., 2003; Meyers, 1997). Les foraminifères benthiques ont été utilisés comme
traceurs de changements environnementaux dans les eaux profondes du GSL, car ils sont sensibles aux concentrations en oxygène dissous, aux flux de matière organique et aux propriétés physiques des masses d'eau (e.g., Barmawidjaja et al., 1995; Kaiho,
1994; Platon et al., 2005). La composition isotopique (i5180, i5 13C) des tests de foraminifères benthiques, laquelle dépend de la salinité et de la température des eaux ambiantes, a été utilisée afin d'évaluer les changements de propriétés des eaux profondes du GSL (e.g., Ravelo et Hillaire-Marcel, 2007).
Contexte océanographique
Le GSL est une mer semi-fermée de l'est du Canada, il possède un volume d'eau de 34500 km3 et une profondeur moyenne de 152 m (Dickie et Tri tes, 1983). Le chenal Laurentien traverse le GSL sur une distance de 1240 km, du plateau
continental jusqu'à Tadoussac (Gilbert et al., 2005), à des profondeurs pouvant atteindre 480 m dans la région de Cabot Strait (Dickie et Trites, 1983).
La productivité primaire annuelle intégrée dans le GSL était d'en moyenne 210 gC m-2 an-1 dans les années 1950-1960 (Steven, 1974). Les données satellitaires
2 2 I
ont permis d'évaluer une productivité de l'ordre de 186 gC m- an-I à 293 gC m- an dans les années 1990-2000 (Radi et de Vernal, 2008). De telles valeurs de productivité sont élevées puisque la saison de production est réduite par un couvert de glace de mer s'étendant de Janvier à Avril (Dickie et Trites, 1983).
En été, la colonne d'eau est divisée en trois couches. La couche de surface est de 10 à 15 m d'épaisseur et est caractérisée par une eau relativement chaude et de salinité faible (27 à 32). Une couche intermédiaire froide (-0,5 à 1,0°C) et de salinité modérément faible (31,5 à 33) se forme durant l'hiver et s'étend sur une profondeur variant de 80 à 150 m. La couche profonde, remplissant le chenal Laurentien, est caractérisée par des eaux chaudes (4 à 6°C) et salines (-34,6) (Dickie et Trites, 1983). Les eaux profondes sont le résultat d'un mélange, en propo11ions variées, d'eaux froides et riches en oxygène du Courant du Labrador avec des eaux chaudes et pauvres en oxygène de l'Atlantique Nord central (Gilbert et al., 2005). Ces eaux pénètrent dans le GSL principalement par le Détroit de Cabot, et progressent vers la tête du chenal Laurentien en environ 3-4 ans (Gilbert, 2004). Une pycnocline permanente sépare les eaux profondes et intermédiaires des eaux de surface, et ainsi les isole de l'atmosphère. Cet isolement influence le contenu en oxygène dissous, lequel décroît graduellement au fur et à mesure que la masse d'eau se dirige vers le continent, à cause de l'oxydation et de la minéralisation de matière organique (Gilbert et al., 2005). Les eaux profondes du Golfe et de l'Estuaire du St-Laurent sont donc particulièrement sensibles aux variations des teneurs en oxygène dissous, lesquelles sont influencées par les flux organiques et la température.
RECENT CHANGES OF BOTTOM WATER OXYGENATION AND
TEMPERATURE IN THE GULF OF ST. LAWRENCE:
MICROPALEONTOLOGICAL AND GEOCHEMICAL EVIDENCES.
Linda Genovesi 1*, Anne de Vernal', Benoît Thibodeau ', Claude Hillaire-Marcel', Taoufik Radi 1
IGEOTOP UQÀM-McGill, Université du Québec à Montréal, Case Postale 8888, Succursale Centre-Ville, Montréal, Québec, Canada, H3C 3P8
Tel: +1-514-987-4080; Fax: +1-514-987-3635
Abstract
The analysis of the micropaleontological and geochemical content of a sediment core collected in the Laurentian trough of the Gulf of St. Lawrence was conducted in order to reconstruct variations in pelagie productivity and benthic conditions during the last centuries and to verify the regional extent of the recent trend towards benthic hypoxia that was previously reported from the Lower St. Lawrence Estuary. Dinoflagellate cyst assemblages reveal relatively uniform pelagie conditions. Geochemical (organic C, C/N) and isotopie (b I3Corg,
5
5N) data also suggest uniforrn organic fluxes during the last centuries. However, significant changes are recorded in the benthic foraminiferal assemblages. The increased percentage of Cassidulina laevigata and Brizalina subaenariensis in the upper coresuggests that bottom waters experienced a lowering of dissolved oxygen concentration during the last ~65-45 years. Moreover, the decreased percentage of
Nonionellina labradorica concomitant with the increased percentage of Oridorsalis umbonatus suggests a decrease in the inluence of Labrador CUITent water relative to
North Atlantic central water penetrating in the Laurentian Channel. The lowering of isotopie
(5
80) composition of Bulimina exilis by 0.4%0 indicates a warrning ofapproximately l.4°C in the bottom waters during the last century. These results demonstrate that the development of hypoxia in bottom waters is a regional phenomenon throughout the Estuary and Gulf of St. Lawrence. They also show that the cause of recent oxygen decrease in the Gulf of St. Lawrence is not primarily related to an increase in primary productivity, but rather to increased temperatures in the bottom water layer.
1.1 Introduction
Eutrophication along continental margms IS often a source of concem, especially because it may result in bottom water hypoxia (e.g., Cloem, 2001). In the Lower St. Lawrence Estuary (LSLE), eastem Canada, a recent decrease of oxygen concentrations in bottom waters has been demonstrated both fi.-om direct measurements (Gilbert et al., 200S) and analyses of sedimentary sequences (Thibodeau et al., 2006). Direct measurements have shown a reduction from 12S to 6S f!mol L-I from the 1930s to the beginning of the 21 st century (Gilbert et al., 200S),
whereas the sedimentary data suggests the trend started around the 1960s (Thibodeau et al., 2006).
It has been hypothesized that the hypoxia in the LSLE originates from increased carbon fluxes to the sea floor due to eutrophication related to human activity (Thibodeau et al., 2006). As shown by Thibodeau et al. (2006) and Gilbert et al. (2007), the enhanced use of fertilizers for agricultural purposes is concomitant to the bottom water oxygen decrease in the LSLE. However, an increase in bottom water temperatures can also partially explain the recent decrease of dissolved oxygen concentrations (Gilbert et al., 200S).
In order to verify the downstream extent of the trend towards hypoxia and changes in carbon fluxes at centennial scale, we analyzed a core collected in the central part of the Gulf of St. Lawrence (GSL) (Fig. 1). The core is from the deep Laurentian trough at 409 m depth, where bottom waters originate from the North Atlantic. Although the core location is distant fi.-om the LSLE, bottom waters in the trough have the same origin and similar characteristics with respect to temperature and salinity, which establish at about 4-6°C and -34.6 respectively (Dickie and Trites, 1983). Thus, core COROS03-CLOS-37BC (48~0'N, 61°30'W; 409 m water depth) allows direct comparison with cores AHOO-2220 (48°38'N, 68°37'W; 324 m water
depth) and CR02-23 (48°42'N, 68°38'W; 345 m water depth) collected in the LSLE (Thibodeau et al., 2006) as far as bottom water conditions are concerned.
Micropaleontological and geochemical proxies have been used to estimate changes in primary productivity and bottom water conditions of the GSL during the last centuries. The assemblages of dinoflagellate cysts were used to reconstruct the primary productivity of surface waters, as their distribution is related to planktonic production and nutrient availability (e.g., Devillers and de Vernal, 2000; Radi et al., 2007). Biogenic fluxes have also been evaluated using geochemical (organic carbon, C/N) and isotopie (bl3C, b15N) measurements (e.g., Meyers, 1997; Bratton et al., 2003). Benthic foraminifer assemblages have been used as tracers of environmental changes in the bottom waters of the GSL, as they are very sensitive to oxygen concentration, organic matter fluxes and physical properties of the water masses (e.g., Kaiho, 1994; Barmawidjaja et al., 1995). The isotopie composition
(8
80) of benthic foraminifer shells, which is primarily dependant upon salinity and temperature, was used to evaluate changes in bottom water conditions (e.g., Ravelo and Hillaire Marcel, 2007).1.2 Oceanographie context
The Gulf of St. Lawrence is a semi-enclosed sea on the eastern coast of Canada, having a water volume of 34 500 km3 and an average depth of 152 m (Dickie and Trites, 1983). The Laurentian Channel runs across the GSL on a distance of 1240 km, from the continental shelf to Tadoussac (Gilbert et al. 2005), with depths reaching 480 m in the region of Cabot Strait (Dickie and Trites, 1983).
Integrated annual plimary production in the GSL was averaged at 210 gC m-2 yr-I (Steven, 1974) in the 1950-1960s. The satellite data set led to evaluate
2 2
productivity in the order of 186 gC m- yr-l to 293 gC m- yr-1 in the 1990-2000s (Radi and de Vernal, 2008). Such productivity is high, especially taking into account the shortened production season because of sea-ice coyer extending from January to April (Dickie and Trites, 1983).
In summer, the water column is divided into three layers. The upper layer is 10 to 15 m thick and is characterized by relatively warrn water and low salinity (27 to 32). A cold interrnediate layer (-0.5 to 1.0 OC) with moderately low salinity (31.5 to 33) forrns during winter and extends to depths varying from 80 to 150 m. The deepest layer, which fills the Laurentian Channel, is characterized by warrn temperatures (4 to 6°C) and high salinities (~ 34.6) (Dickie and Tlites, 1983). The bottom waters result from a mix in various proportions of cold and oxygen rich waters from the Labrador Current (LCW) with warrn and oxygen poor North Atlantic central water (NACW) (Gilbert et al., 2005). They enter the Gulf at the edge of the continental shelf, in Cabot Strait principally, and progress landward to the head of the Laurentian Channel in about 3 to 4 years (Gilbert, 2004). A permanent pycnocline separates the bottom intermediate waters from the surface layers, thus isolating them from the atmosphere and influencing the oxygen content which decreases gradual1y with respiration and organic matter mineralization as the water flows landward (Gilbert et al., 2005). The deep waters of the Gulf and Estuary of St. Lawrence are thus particularly sensitive with respect to dissolved oxygen concentration, which may be affected by any changes in organic fluxes or bottom temperature variations.
1.3 Materiai and methods
1.3.1 Sampling
Undisturbed sediment core COROS03-CLOS-37BC was recovered in 200S at 409 m water depth in the Laurentian Channel, south of Anticosti Island (48°20'N, 61°30'W) on board the R1V Coriolis II. The sediment was collected using an Ocean Instrument Mark II box corer in which was inserted a push-core. The 38 cm long core was subsampled at O.S cm intervals in the upper lS cm, and at 1 cm intervals for the lower part of the core. Subsampling was performed using a custom-made holding device, which enabled to push the sediment through the plastic liner at pre determined intervals.
1.3.2 Core chronology
Lead-210 activities of dried and crushed samples were obtained indirectly by measuring the decay rate of its daughter isotope 2l0po (tll2 = 138.4 days; 0. = S.30 MeV) by alpha spectrometry. A Polonium-209 spike was added to the samples to determine the extraction and counting efficiency. Polonium was extracted and purified by chemical treatments (reacted sequential1y with HCl, HN03, HF and H20 2) and deposited on a sil ver disk (Flynn, 1968). The 209-210pO activities were measured in a silicon surface-banier o.-spectrometer (EGG&ORTEC type S76A).
The 210Pb activity profile of core COROS03-CLOS-37BC (fig. 2) was used to evaluate the values for the supported 210Pb fraction. Supported activity values ranging from 2.34
±
0.36 dpm g-l to 2.04±
0.12 dpm g-l have been calculated from the asymptotic trend, as shown by Zhang (2000) and Jennane (1992) in the Gulf of St. Lawrence. The lowest 210Pb activity value of 1.89±
O.OS dpm g-l has also been used as a supported fraction possibility (Zhang, 2000).On these bases, range of excess 210Pb activities were obtained by subtracting the supported activity values from the 210Pb activity profile. Different sedimentation rates (considering constant rate supply) were thus calculated using the radioactive decay constant (À) of 210Pb and the linear regression slope of the logarithmic function of excess 210Pb below the mixed layer (Fig.2) (Zhang, 2000; Sorgente et al. 1999; Jennane, 1992).
Cesium-l37 was measured by r-ray spectrometry at 661.6 keV with a Canberra low-background high-purity Ge well-detector. The reproductibility of l37Cs activities was estimated to ~
±
1% by replicate analyses (n=6) of the standardreference material IAEA-300 (Baltic Sea sediment).
1.3.3 Micropaleontological analysis
Sediment samples were treated according to the procedure described by de Vernal et al. (1999). A known volume of humid sediments was weighed, dried at room temperature, and weighed once more to determine the water content of the samples. Dried sediments were sieved through 106 J.1m and 10 J.1m mesh sieves. The fraction greater than 106 /lm was dried and weighed. It was used for the examination of the benthic foraminiferal tests with a binocular microscope (x40). Calcareous and agglutinated species were hand-picked, counted and identified using the nomenclature of Rodrigues (1980). In this paper we report the total concentration of benthic foraminifer shells, as well as the relative abundance of the most abundant taxa.
The 10 /lm to 106 /lm fraction was submitted to a series of treatments, with hydrochloric acid (HCI 10%) and hydrofluoric acid (HF 49%) to dissolve carbonate and silica particles (for details see de Vernal et al., 1999). The residue was then sieved through a 10 /lm mesh sieve, and finally mounted between a slide and a cover slide in glycerine gel. The slides were examined under an optical microscope at 400x
magnification, aH palynomorphs were counted. Tablets of Lycopodium spores were
previously added to the samples to calculate the palynomorph concentrations. Here we present the dinocyst concentration, as they provide indication on fluxes of organic matter from terrestrial source or related to pelagie production. Details concerning other palynomorphs (pollen grains, spores, organic linings of foraminifera) are reported
in
Annexe A. The nomenclature used for the identification of dinocysts is that of Rochon et al. (1999). Percentages of the main taxa are reported here, and we have applied the best analogue method for reconstructing primary paleoproductivity. The methodology for this approach is described by Radi and de Vernal (2008). The reference productivity data used are CZCS (Antoine et al., 1996) and MODIS (Berhenfeld and Falkowski, 1997). The validation exercises indicate that the accuracyl l
of reconstruction is
±
34.16 gC m- using CZCS, and±
54.97 gC m- using MODIS (Radi and de Vernal, 2008).1.3.4 Sediment Carbon and Nitrogen analyses (%Corg, b
13
Ç CIN,o'5
N)Total carbon (TC) and total nitrogen (TN) contents of the dried and crushed samples were determined with a Carlo Erba™ NC 2500 elementa1 analyzer. Inorganic carbon (lC) was analyzed independently using a UIC Coulometries™ coulometer foHowing acidification of the sampies and COl extraction. The organic
carbon (OC) content was obtained from difference between total carbon and inorganic carbon. Precision, as determined from replicate measurements of Organic Analytieal Standard substances (Aeetanilide, Atropine, Cyclohexanone-2.4 Dinitrophenyl-Hydrazone and Urea), is estimated at ± 0.1 % for OC and ± 0.3% for N contents. The analytical reproducibility is
±
5%.For the isotopie analyses, samples were acidified with liquid HCI (1 N), dried and crushed. The isotopie composition of the OC was measured with a Carlo Erba™ elemental analyzer online with a Micromass Isoprime™ mass spectrometer. Data are
reported in (5 (%0) with reference to V-PDB (Coplen, 1995). The analytical uncertainty is ± 0.1 %0 for the bDC and 0.2 %0 for the
8
5N values, as detennined from replicate measurements of standard materials during analytical runs. The international standards IAEA-C6 sucrose and IAEA-N2 were measured several times during the isotopie analyses and yielded respectively an average value of8
3c
= -10.73 ± 0.02 %0 for n=4 whereas the reported value is -10.8 ± 0.1 %0 and
8
5N
=
20.20 ± 0.24 %0 for n=4 whereas the reported value is 20.41 ± 0.12 %0.1.3.5 Oxygen and carbon isotopes analyses zn benthic foraminifera shells ((PO,
b
l3 e)In each sample, approximately a dozen benthic foraminifer shells of Bulimina exilis were hand picked from the 150-250 !lm fraction. The calcareous shells were
roasted at ~200°C under vacuum for about 2 hours, and then analyzed with a Micromass Isoprime™ isotope ratio mass spectrometer in dual inlet mode coupled to a MultiCarb™ preparation system. C02 was extracted at 90°C by acidification with 100% concentration H3P04. Measurements were made with internai reference carbonate material calibrated against the V-PDB scale. The analytical reproducibility detennined by replicate measurements of the internaI standard material is routinely better than 0.05 %.
1.4 Results
2/oPb /37C " d d' .
J..4 J Excess , s actlvlty an se lmentatlOn rate
The 210Pb profile depicts a fairly large departure from the theoretical negative exponential behaviour (Fig. 2a). The upper 2 cm could possibly respond to sorne benthic mixing, they were therefore excluded from the calculation of sedimentation rates. Changes in trends suggest variable 210Pb excess fluxes and/or sediment fluxes and supported 210Pb fraction, likely related to grain-size variability and mineralogical composition of sediments (i.e., reworked Paleozoic clays, eroded Paleozoic carbonates, Goldthwait Sea sediments, etc.).
A range of estimated sedimentation rates can however be obtained. As suggested by Zhang (2000) and Jennane (1992) for nearby sites, we have used the asymptotic trend of the 210Pb activity profile to calculate a range of supported 210Pb fractions. The average values of the sub-asymptotic part of the curve below 13 cm, 16 cm, 20 cm and 26 cm yielded supported fraction values of2.34
±
0.36 dpm g-I, 2.24±
0.28 dpm g"1, 2.16±
0.21 dpm g-I and 2.04±
0.12 dpm g-I, respectively. Zhang (2000) also suggests the use of the lowest most 210Pb activity value as a first order estimate for the supported fraction, in this case 1.89±
0.05 dpm g-I. Therefore, in order to establish age models for core COR0503-CL05-37BC and estimate minimal and maximal sedimentation rates, we have used a range of supported 210Pb values, from 2.34±
0.36 to 1.89±
0.05 dpm g-l, respectively yielding minimal (Fig. 2b) and maximal (Fig.2c) age models (cf. Annexe D for details). In Figure 2b, the excess 210Pb values of the minimal age model expressed on a logarithmic scale are fit to a simple linear regression with a slope of -0.24 (R2=0.97), and suggest a minimum sedimentation rate of 0.13 cm y(l. In Figure 2c, the linear regression from the maximal age model shows a slope of -0.17 (R2=0.97), thus suggesting a maximum sedimentation rate of 0.18 cm y(l. Assuming reasonably constant 210Pb excess fluxes and supported fractions, we estimate sedimentation rates to range between 0.13 and0.18 cm yr-I. Core COR0503-CL05-37BC would therefore represent between 290 and 210 years of sedimentation (Fig. 2e).
Measurement of I37Cs activity shows a peak at ~4.25 cm (Fig. 2d), which corresponds to the maximum activity of artificial radionuclides originating from atmospheric nuclear testing during the period 1952-1972, the maximum intensity of which is estimated to be around 1963 (Jouanneau et al., 1999). The 137Cs activity peak is consistent with the age models obtained by excess 210Pb activity data, and tends to support the hypothesis of minimal sedimentation rate of 0.13 cm yrol. Furthermore, the analysis of sedimentary sequences from nearby sites in the Gulf of St. Lawrence also suggest sedimentation rates closer to our minimal value of 0.13 cm y(1 (Silverberg et al., 1986; Jennane, 1992; Zhang, 2000). Taking into account such sedimentation rates, the micropaleontological and geochemical analyses which were performed at 1 cm interval, permit to achieve temporal resolution at a decadal scale.
1.4.2 Dinocyst assemblages
The dinocyst concentrations (Fig. 3a) show high frequency oscillations but no clear trend. The values vary between 30000 cysts gol and 90000 cysts g-I and average at 51 770 cysts gO'. The dinocyst assemblage (Fig. 3b) is dominated by two taxa, Pentapharsodinium dalei and Islandinium minutum, which respectively
represent approximately ~34% and ~30% of the assemblage. Other important species include Operculodinium centrocarpum (~13%), Nematosphaeropsis la byrinthus
(~12%) and Brigantedinium spp. (5%). The following taxa were also present but only
represented 2% or less of the assemblage: Spiniferiles elongatus, Spiniferiles
ramosus, lslandinium ? cezare, Selenopemphix quanta, Spiniferites spp.,
Ataxiodinium choane, Alexandrium tamarense. The relative abundances of each taxa
It a1so suggests that the pelagie productivity in the Gulf of St. Lawrence has remained stable for the past few centuries.
In
the upper centimeter of the core, however, we note a decrease in the abundance of heterotrophic taxa, from ~30% to ~8% for Islandinium minutum andfrom ~5% to ~0.6% for Brigantedinium spp. This could result from a very recent
change in trophic and/or hydrographie conditions (e.g., Radi and de Vernal, 2008).
1.4.3 Transfer functions
Transfer functions based on the modern analogue technique and using the productivity databases of Antoine et al. (1996) and MüDIS (Behrenfeld et al., 1997) were applied to reconstruct primary production. The results using the data from Antoine et al. (1996) average around 182 gC m-2 y(1 (Fig. 4a). These values are approximately 100 gC m-2 yr-[ lower than results obtained by using the database of MODIS (Behrenfeld et al., 1997), which average around 283 gC m-2 yr-I (Fig. 4b)_ Regional discrepancies between the two reference data sets are recorded in many areas of the northern hemisphere (Radi and de Vernal, 2008). These differences may be due to the use of different algorithms, different data acquisition processes or different productivity values between the 1980s and 2000s (Radi and de Vernal, 2008).
In
any case, the reconstructions made from both databases show relatively uniform values of annual primary production, with high frequency oscillations and no clear trend, suggesting a unifOlm primary productivity throughout the core.1.4.4 Geochemistry of organic matter in sediments
Geochemical content of the sediment remain constant throughout the core, with few variations and no significant trend (Fig. 5). Corg oscillates between 0.9 % and 1.2 %, C/N ratio between 5.68 and 6.66. The b13C average is ~ 22.3 %0, and the
8
5N is ~ 6.1 %0. These values are typical of marine organic matter (Meyers, 1997) and lie in the lower most range of values reported for the Laurentian Channel (Muzuka and Hillaire-Marcel, 1999). Nevertheless, we note slight trends towards higher Corg contents, and lower C/N and
8
5
N values towards the core top. These changes could be attributed to a selective degradation of the carbon and/or nitrogen from the organic matter in the sediment during early diagenesis (Meyers, 1997; Muzuka and Hillaire-Marcel, 1999).
J. 4. 5 Benthic foraminifer assemblages
The total benthic foraminifer concentrations (Fig. 6a) vary from 4 to 21 tests g-l, and average at ~ 9.6 tests il. They oscillate but show no trend. Among calcareous taxa, the dominant species are Bulimina exilis, Bulimina marginata, Elphidium excavatum, Nonionella labradorica and Oridorsalis umbonatus.
Secondary species include Globobulimina auriculata, Quinqueloculina seminulum, Lagena sp., Brizalina subaenariensis, Cassidulina laevigata and Glandulina sp.
The benthic foraminifer assemblages are dominated by calcareous taxa (Fig. 6b), except in the upper part of the core, where agglutinated species are more abundant. The presence of agglutinated taxa in the upper portion of the core is difficult to interpret. This is why they are treated separately from the calcareous species in the calculation of concentration and relative abundance. The agglutinated foraminifer tests are fragile because the particles forming the tests are cemented together by organic matter, and their resistance to diagenetic effects, although difficult to quantify, seems generally low (Murray, 1991). However, one cannot totally discard other processes leading to such a distribution. For example, the progression of hypoxia may also have contributed to a reduction of the oxidizing properties of the bottom waters of the GSL, thus increasing the preservation potential
of these fragile taxa (Balmawidjadja et aL, 1995). However, their presence could also relate to the establishment of new species due to changing bottom water conditions.
Many changes occur in the calcareous foraminiferal assemblage of the upper 8 cm of the core. An important decrease can be observed in the relative abundance of Bulimina marginata, Lagena sp., Quinqueloeulina seminulum, Glandulina sp. and Elphidium exeavatum. The progressive increase in relative abundance of Brizalina subaenariensis and Cassidulina laevigata is consistent with the development of hypoxia in the GSL, as these taxa are generally associated with oxygen depleted environments (e.g., Mendes et aL, 2004; Murray, 1991; Sen Gupta and Machain Castillo, 1993). We also note a decrease from ~30 % to 0 % in the relative abundance of Nonionellina labradoriea, a species occurring under the cold waters of the Labrador shelf (Bilodeau et aL, 1994). This can simultaneously be observed with an increase from ~5 % to 30 % of Oridorsalis umbonatus, a species cornmon in surface sediments bathed by wann waters of the North Atlantic (Bilodeau et aL, 1994; Murray, 1991).
1.4.6 Isotopie composition ofbenthie foraminifèra shells
8
80 isotopie analysis of the ealcareous shells of Bulimina exilis (Fig. 7a) yielded values slightly decreasing from core bottom to core top, with two distinct trends. Between 37 and 16 cm,
8
80 values decrease from ~3.23 %0 to ~3.09 %0upward. From 16 cm to the top, a more important change is recorded with
8
80values decreasing from ~3.09 %0 to ~2.72 %0.
Entering these values in the following paleotemperature equation of Shackleton (1974), the 8 80 shifts may correspond to a temperature increase of ~0.53°C (37-16 cm) and ~ 1.36°C (16-0 cm), and/or a change in the isotopie composition of the ambient seawater.
Where t represents the temperature (in oC) during the precipitation of calcite,
0'8
0c is the isotopie composition of calcite (versus the V-PDB standard), and bl80w is theisotopie composition of the ambient water (versus the SMOW standard). The value used for the isotopie composition of ambient water
(0'8
0w) is 0.07 %0, which represents an average of0'8
0 measurements made at depths between 350 and 450 m in the region of the Gulf of St. Lawrence (data from the Global Seawater8
80 Database; cf. Schmidt et al., 1999).0'3C
isotopie analysis of Bulirnina exilis (Fig.7b) shows a trend different fromthat of
0'8
0 . The lower part of the core, from 37 tola
cm, shows a progressive decrease from ~ -1.63 %0 to ~ -1.99 %0. In the upper palt of the core,0'3C
values decrease rapidly from ~ -1.99 %0 to ~ -2.37 %0 betweenla
to 5 cm, and then increase from ~ -2.37 %0 to ~ -2.12 %0 between 5 cm and the core top. Because Bulirnina exilisis an endobenthic species, the
0'3C
values are influenced by the CO2 produced by thedecay of buried organic matter (Muzuka and Hillaire-Marcel, 1999). Therefore the
0'
3C cannot be used to support any of the above mentioned pro cesses or combinationof pro cesses invoked for explaining the change in oxygen isotope composition (i.e., an increase in temperature or a change in isotopie composition of ambient water).
1.5 Discussion
The recent trend towards hypoxia in the bottom waters of the Gulf of St. Lawrence could be related to increased biogenic production and organic carbon fluxes. In order to verify this hypothesis, we have examined several proxies of productivity, including the organic carbon content, its isotopie composition, the C/N ratio, and organic walled microfossils. In the study sequence, organic carbon (Corg)
records a subtle ~0.2% increase towards the surface, which may correspond to an early diagenetic profile (Meyers, 1997). It may also reflect better preservation of the organic matter brought on by the progression of hypoxia in the GSL, as the decrease of dissolved oxygen concentrations in the water results in a shorter penetration depth of O2 into sediments, and thus in a shorter exposition period of the organic matter to O2 (Meyers, 1997). The isotopic composition of organic carbon
(8
3C) and nitrogen(8
5N) and the C/N ratio of organic matter indicate a steady source with fluxes predominantly from marine origin (e.g., Meyers, 1997). Complementary to these measurements, the palynological data also suggest relatively uniform pelagic fluxes. The dinoflageUate cyst assemblages and concentrations do not record important variations, and the reconstruction of primary productivity suggests relatively uniform production through time. Thus, none of the tracers indicate a major change in productivity and organic carbon fluxes at the scale of the last 2 or 3 centuries. This contrasts with the findings of Thibodeau et al. (2006) who provided evidence for a recent pelagic productivity increase in the LSLE based on the same proxies. Clearly, if pelagie fluxes and enhanced degradation of organic matter can be invoked to explain the trend towards hypoxia in the LSLE, such is not the case in the GSL. Therefore, the change in bottom water conditions, independent from surface parameters, necessarily plays a determinant role on the regional development of hypoxia.Benthic foraminifera are indicators of benthic conditions including temperature, sali nity, productivity, oxygenation, etc. (e.g., Barmawidjaja et al., 1995; Kaiho, 1994). They have also often been used as tracers of hypoxia (e.g., Osterman, 2003; Tsujimoto et al., 2006). Important changes occured in the foraminiferal assemblage of the upper 8 cm of core COR0503-CL05-37BC. Certain species, such as Bulimina marginata, Elphidium excavatum, Nonionellina labradorica, Lagena sp., Glandulina sp., decrease strongly in abundance and disappear in sorne cases. The
cannot be assessed unequivocally since the tolerance limits of these species to the physical and chemical properties of water masses are poorly known (Sen Gupta and Machain-Castillo, 1993). Nevertheless, the general decrease in species diversity reflects an increased stress in the environment. This is consistent with the increased relative abundance of Brizalina subaenariensis and Cassidulina laevigata in the
upper part of the core, as these two species are tolerant to low-oxygen concentrations (e.g., Mendes et al., 2004; Murray, 1991; Sen Gupta and Machain-Castillo, 1993). Therefore, the overall foraminifer assemblages suggest an increased environmental stress as a response to the decreasing dissolved oxygen content in bottom waters. According to our age models, these changes may have started between the 1940s and 1960s, which is in accordance with the development of hypoxia described by Gilbert et al. (200S).
Gilbert et al. (200S, 2007) interpret the oxygen depletion in the LSLE as being possibly caused by two factors: an increase in fluxes of organic matter from the surface to the seafloor, and a modification of the proportion of LCW and NACW entering the Laurentian Channel. Using temperature and salinity measurements of the LCW and NACW, they have calculated that in the 1930s the waters filling the Laurentian Channel were composed of approximately 72% LCW and 28% NACW, but since the 1980s these proportions have changed to S3% LCW and 47% NACW. These waters would therefore be 1.6SoC warmer (Gilbert et aL, 200S). Such a change in the relative proportion of cold and oxygen rich LCW to warm and oxygen poor NACW is recorded both by the benthic foraminifer assemblages and the stable isotope composition of benthic foraminifers. The relative abundance of Nonionellina labradorica, a species abundant in the Labrador Sea (Bilodeau et al., 1994), decreases
by -30% while Oridorsalis umbonatus, a species common under North Atlantic
waters (Bilodeau et al., 1994; Murray, 1991), increases by -2S%. Furthermore, the
8
80 of benthic foraminifer shells indicates a shift in bottom water temperature. An increase of temperature of about O.soC is recorded from -1730/1810 to -1880/1910,
followed by a wanning ofat least 1.4°C from the turning of the century (~1880/1910)
to 2005. According to Gilbert et al. (2005, 2007), this increased bottom water
temperature is accompanied by an increase in salinity, and since the isotopie composition of the ambient water is dependant upon salinity (Ravelo and Hillaire Marcel, 2007), the temperature change we calculated from
8
80 measurements may be underestimated. As suggested by Gilbert et al. (2005, 2007), this observed wanning of bottom waters may be the consequence of changing proportions of LCW and NACW entering the Le. An increase of temperature in sub-surface waters of the North Atlantic and Labrador Sea during the last decades could also be invoked (Levitus et al., 2000).1.6 Conclusion
Micropaleontological and geochemical analysis of sediment core COROS03 CLOS-37BC collected in the Gulf of St. Lawrence shows no evidence of an increase in primary production to explain the recent hypoxia. They rather seem to demonstrate that the recent oxygen depletion in the GSL is due to changes of the proportions of LCW and NACW entering the Laurentian Channel, and thus of an increase ofbottom water temperature. This is supported by the benthic foraminifer assemblages, particularly by the decrease of Nonionellina labradorica concomitant to the increase of Oridorsalis umbonatus, and by the isotopie composition of benthic foraminifera shells, which indicate ~ 1.9°C warming of the bottom waters in the Gulf of St. Lawrence.
Our srudy demonstrates that the bottom water conditions in the Laurentian channel are not only sensitive to eutrophication, but also to temperature which is a
parameter that depends on ocean circulation and global thermal balance. The recent trend toward increasing temperature in the LSLE and GSL can be a manifestation of the recent climate warming or can be part of natural variability. In order to determine the respective influence of the natural variability and anthropogenic forcing, the study oflonger time series is needed.
References
Antoine, D., André, J-M., Morel, A. 1996. Estimation at global scale from satellite (coastal zone color scanner) chlorophyll. Global Biochem. Cy. 10:57-69
Barmawidjaja, D.M., Van der Zwaan, G.J., Jorissen, F.J., Puskaric, S., 1995. 150 years of eutrophication in the northern Adriatic sea: Evidence from a benthic foraminiferal record. Mar. Geol. 122: 367-384
Berhenfeld, M.J., Fa1kowski, P.G., 1997. Photosynthetic rates derived from satellite based chlorophyll concentration. Limnol. Oceanogr. 42: 1-20
Bilodeau, G., de Vernal, A., Hillaire-Marcel,
c.,
1994. Benthic foraminiferal assemblages in Labrador Sea sediments: relations with deep-water mass changes since deglaciation. Cano J. Earth Sei. 31: 128-138.Bratton, J.F., Colman, S.M., Seal, R.R., 2003. Eutrophication and carbon sources in Chesapeake Bay over the last 2700 yr: Human impacts in context. Geochim. Cosmochim. Ac. 67: 3385-3402
Cloern, lE., 2001. Our evolving conceptual model of the costal eutrophication problem. Mar. Ecol. Prog. Ser. 210: 223-253
Coplen, T.B., 1995. Discontinuance of SMOW and Pdb. Nature 375: 285
de Vernal, A., Henry, M., Bilodeau, G., 1999. Thechniques de préparation et d'analyse en micropaléontologie. Les cahiers du GEOTOP.
Devillers, R., de Vernal, A., 2000. Distribution of dinoflagellate cysts in surface sediments of the northem North Atlantic in relation to nutrient content and productivity in surface waters. Mar. GeoI. 166: 103-124
Dickie, L.M., Trites, R.W., 1983. The Gulf of St. Lawrence. p. 403-425 ln Ketchum,
H. (Ed), Estuaries and enclosed seas. Elsevier Scientific Publishing company, Amsterdam-Oxford-New York
Flynn, W.W. 1968. The deterrnination of low levels of polonium-21 0 ln environmental materials. Anal. Chim. Acta 43: 221-227
Gilbert, D. 2004. Propagation of temperature signaIs from the northwest Atlantic continental shelf edge into the Laurentian Channel. ICES CM 2004/N :07
Gilbert, D., Sundby, B., Gobeil,
c.,
Mucci, A., Tremblay, G-H., 2005. A seventy-two year record of diminishing deep-water oxygen in the St. Lawrence estuary: The northwest Atlantic connection. Limnol. Oceanogr. 50: 1654-1666Gilbert, D., Chabot, D., Archambault, P., Rondeau, B., Hébert, S. 2007. Appauvrissement en oxygène dans les eaux profondes du St-Laurent marin: causes possibles et impacts écologiques. Le Naturaliste Canadien, 131: 67-75
Jennane, A. 1992. Application de la méthode du plomb-21 0 dans l'Estuaire maritime et le Golfe du St-Laurent. Taux de sédimentation, flux et modes d'ablation. Mémoire de maîtrise, Université du Québec à Montréal.
Jouanneau, J.M., Castaing, P., Grousset, F., Buat-Menard, P., Pedemay, P., 1999. Recording and chronology of a cadmium contamination by Cs-137 in the Gironde estuary (SW France). C.R. Acad. Sci. Sér. II, Sci. Terre Planètes 329: 265-270
Kaiho, K., 1994. Benthic foraminiferal dissolved-oxygen index and dissolved-oxygen levels in the modem ocean. Geology 22: 719-722
Levitus, S., Antonov, J. L, Boyer, TP., Stephens, C. 2000. Warming of the world oceans. Science 287: 2225-2229.
Mendes, L, Gonzalez, R., Dias, lM.A, Lobo F., Martins V., 2004. Factors influencing recent benthic foraminifera distribution on the Guadiana shelf (Southwestern Iberia). Mar. Micropaleontol. 51:171-192
Meyers, P .A, 1997. Organic geochemical proxles of paleoceanographic, paleolimnologic, and paleoclimatic processes. Org. Geochem. 27: 213-250
Murray, J.W., 1991. Ecology and palaeoecology of benthic foraminifera. Longman Scientific & Teclmical
Muzuka, AN.N., Hillaire-Marcel, C. 1999. Burial rates of organic matter along the eastern Canadian margin and stable isotope constraints on its origin and diagenetic evolution. Mar. Geol. 160: 251-270
Osterman, L.E., 2003. Benthic foraminifers from the continental shelf and slope of the Gulf of Mexico: an indicator of shelf hypoxia. Estuar. Coast. Shelf S. 58: 17-35
Radi, T, de Vernal, A., 2008. Dinocysts as proxy of primary productivity in mid-high latitudes of the Northern Hemisphere. Mar. Micropaleontol. 68: 84-114
Radi, T, Pospelova, V., de Vernal, A., Barrie, lV., 2007. Dinoflagellate cysts as indicators of water quality and productivity in British Columbia estuarine environments. Mar. Micropaleontol. 62: 269-297
Ravelo, A.C., Hillaire-Marcel, C. 2007. The use of oxygen and carbon isotopes of foraminifera in paleoceanography. p. 735-760. ln C. Hillaire-Marcel and A. de Vernal [eds], Develpments in marine geology Volume 1: Proxies in late Cenozoic paleoceanography.
Rochon, A., de Vernal, A., Turon, J-L., Matthiessen, 1., Head, M.J., 1999. Distribution of recent dinoflagellate cysts in surface sediments from the North Atlantic ocean and adjacent seas in relation to sea-surface parameters. Am. Assoc. Stratigr. Palynol. Found. 35
Rodrigues, c.G., 1980. Holocene microfauna and paleoceanography of the Gulf of St. Lawrence. Ph.D. Thesis. Carleton University
Schmidt, G.A., Bigg, G. R., Rohling, E. J. 1999. Global Seawater Oxygen-18 Database. http://data. giss.nasa. gov/o18datal
Sen Gupta B.K., Machain-Castillo, M.L. 1993. Benthic foraminifera in oxygen-poor habitats. Mar. Micropaleontol. 20: 183-201
Shackleton, N.J., 1974. p.203-2Ü9. ln J. Labeyrie [ed], Méthodes quantitatives d'études des variations du climat au cours du Pléistocène, Éditions du CNRS
Silverberg, N., Nguyen, H.V., Delibrias, G., Koide, M., Sundby, B., Yokoyama, Y., Chesselet, R., 1986. Radionuclide profiles, sedimentation rates, and bioturbation in modem sediments of the Laurentian through, Gulf of St. Lawrence. Oceanol. Acta, 9:
Sorgente, D., Frignani, M., Langone, L., Ravaioli, M., 1999. Chronology of marine sediments: interpretation of activity-depth profiles of 210Pb and other radioactive 285-290
tracers, Part 1. Technical Report n.54, Consiglio nazionale delle ricerche istituto per la geologia marina, Bologna.
Steven, D.M., 1974. Primary and secondary production in the Gulf of St. Lawrence. Mar. Sei. Centre, McGill Univ., Rep. 26
Thibodeau, B., de Vernal, A., Mucci, A., 2006. Recent eutrophication and consequent hypoxia JO the bottom waters of the Lower St. Lawrence Estuary:
Micropaleontological and geochemical evidence. Mar. Geol. 231: 37-50
Tsujimoto, A., Nomura, R., Yasuhara, M., Yamazaki, H., Yoshikawa, S. 2006. Impact of eutrophication on shallow marine benthic foraminifers over the last 150 years in Osaka Bay, Japan. Mar. Micropaleontol. 60: 258-268
Zhang, D. 2000. Fluxes of short-lived radioisotopes in the marginal basins of eastern Canada. Ph.D. Thesis, Université du Québec à Montréal.
Cl
Figure 1. Map of the study area showing location of coring sites. The circle corresponds to core COR0503-CL05-37BC from the Gulf of St. Lawrence (48°20'N, 61°30'W; at 409 m water depth). The square and t1iang1e respectively correspond to cores CR02-23 (48°42'N, 68°38'W; at 345 m water depth) and AHOO-2220 (48°38'N, 68°37'W; al 324 m water depth) collected in the Lower St. Lawrence Estuary and analysed by Thibodeau et al. (2006). The bathymetric contour represents 200 fi.
210pb activity ln 210pb excess 137CS Activity Chronology
(dpm 9-1) (dpm g-1) (year)
Maximal supporled fraction
o
4 , , 8, , 12, , 16 20...
24 -2 -1 0 1 2 3 0.1 0.2 0.3 0.4 0.5 1700 1800 1900 2000,o
BiologieaJ mixing ...
o
~ BioiJgieai ~ixing.~./o
1 BiOkg;C~Imi;ing---./4 )1'/ Biologieal mixing ,:'
.
.,..... 4 4 mes peak (-1963) ->"f'
8...
, . ( - 1 2~.
~. 1 ~.= 8 12 ...-->--+-'-< 8 1.
1 1 E 12.
16~ ~ 12 1--.. "y =3,2138 - 0,24212x .... 1'; ~·
·
4i
~
<: Il>, R2 =0,96886 .:.;-E
16·
·
168, /5
a. ICO Q) ::? 1 ....Minimal supporled fraction
Cl 20 20 e:::;," 1f2.· '.:. 1 .... -4 -3 -2 -1 0 1 2 3 4 q;. If! 24
o
~, , , , ,
',1'- ' 24 ;y 10 Biologieal mixing t 1"/' Q)l::, 1'<.>I~ 8 28 $ '".
",'
:l
r
28 rtlo" li?> 1.... 16 ib" .§. I.g1 10 32 32 24 ~~~ 10i
/$'
I~ I~ ~.~ 36 32 36 y=
2,8254 - 0, 16962x R2 =0,97051 CFigure2. In core COROS03-CLOS-37BC, A) 210Pb activity profile (dpm go!) as a function ofdepth; B-C) excess 210Pb (In) ofmaximal
(2.34 ±0.36 dpm g-!) and minimal (1.89± 0.05 dpm go!) supported fraction as a function of depth, the dotted lines represent the linear
regressions used to calculate sedimentation rates; 0) lJ7Cs activity profile (dpm g'!) as a function of depth; E) chronology (years) as a
function of depth, the dot represents the lJ7Cs peak which corresponds to approximately 1963. The upper 2 cm of the core (in grey) represent a layer ofbiological mixing. These upper samples were not taken into account in the calculation ofsedimentation rates. Note
that y-axis, although ail representing depth (cm), have different scales. N
'0
ç
.~A'"
'0\ ~0 ;Q Ci0'0
f:'
\'0 ~,o ~S 0\''0f:'
'0 S \S0
Q' ~ ~S '0 00.
~ ~~R
Q R>'O oS o..~ ,~" .~ 0f:'
f:'
S0
~':\
0"
~ 0\ .~ ,~ 0:--.0 '0 ~\ A ~sof:'
~'O 6\~" \~" S S ' <S'~~'O
.0\VoS~
~o
~0?S
~~0
~~0
R
0Dinocyst concentration ~'O'<
00"
<S'ri}0{J 'O~ .0~0 . 0~0 0~0 ~ ~'O
R
\~ ~ ~ ~ (cysts g-1) «0 \S ~0 0 ~\ S'< S'< S0 0 100000 0 60 0 60 0 20 0 30 0 20 0 10 0 10 0 10 4:~
0 8 ..--. E ~ 121
r--
12 .s::....
c. 16-1 ~ 16 CIl Cl 20 20 24 24 28 28 32 32 36 36Relative abundance of main taxa (%)
B
Figure 3. In core COROS03-CLOS-37BC, data as a function ofdepth A) dinocyst concentration (cysts g-I); B) relative
abundance of the most abundant d inocyst taxa. w
A B
Annual CZCS Primary Production Annual MODIS Primary Production
(gC
m-
2 yr1) (gCm-
2 yr1) 125 150 175 200 225 125 175 225 275 325 375 425 O+----'---'-:r---'---'o
", 2 2 4 4 , . ' 6 6 8 8 10 10 12 12 14 14 E ü ~ 16 16 J::ë..
18 18 Q) Cl 20 20 22 22 24 24 26 26 28 28 30 30 32 32 34 34 36 36Figure 4. Reconstruction of primary production based on the best analogue method, using A) the CZCS reference productvity data (Antoine et aL, 1996); and B) the MODIS reference productivity data (Berhenfe1d and Falkowski, 1997). The bold lines represent S-point running means.
Corg C/N b13C vs V-PDB b 15N vs Air (%) (%0) (%0) 0.8 , 1.0 , 1.2 , 1.4 5.4 5.8 6.2 6.6 7.0 -22.6 -22.4 -22.2 5.5 6.0 6.5 7.0 7.5 J ' " 0 0 0 ;1:
:
~
4,
4 41
...~ 8 ". 8 8 8----
E 12~
)
12 12 12 ~ J:: 16 16 16 16-
a. al -r"::: :. ' . Cl 20 20 20 20 1 24 24 24 24 28 28 28 -'-. 28 32 -1 ;Z" 32 32 ::~'.'- 32~
~ ..~ 36 -1 36 ~-'-' .'.r'
- 36 36Figure S. In core COROS03-CLOS-37BC, data as a function of depth A) crganic carbon (%); B) organic carbon to nitrogen ratio;
C) b!JC (%0) of organic carbon; D) b 15N (%0). The bold curves represent S-point runn ing means.
W
.,(\.
~"J ,~'O ;.\0 ,,'" (:-",\ n..A) ,,\' ,,0 'eY \' ~\J '0 ~v
~'O t}\J 'Ou ,,\~ ",0 (:-'0 ~~, ~'O
, (:-'0 ~ ;ç,\ 'Ov ' O ; ç , 0 (:- ~~
Ben"t~ic
'~\'"
l$j
éG'O, 'è\'0,~(:-'O
J\(:-
\j<$' ;ç,'00 \'00 e.;,<:<"forammlfera '0
é
'è~ ,~
0~\(:-
j.\<$'~oG
?t'"
e.;,<:<' 'è,?v
~(:-'O ~\(:-'O
, ~0°
~<;:: e.;,
concentration;'\(:- ~\(:- ,Ç}v 'O~ 0'0
"v
o~'" (:-'0 'S.,.\0 \Ô\) Ô\}' \ ' ' \ ' ~~ ~~ ~ ,~v. è} 0 '0 ":i ~' ~v (}0
(tests g-1) 0.}~ 0.s:-
0'<
~o 0\0 oS' d~ v'OCfJ0Z
V; C?'" 0\'0 ( '?-Q) e.;,<:<0o
50 0 80 0 40 0 40 0 40 0 30 0 30 0 40 0 20 0 10 0 30 0 10o
80o
l ',' ! , ! 4 ~.V
R
~
~
i
f1
h
P
~
L .}
_: I
-1940s - 1960s 8 E ~ 12 ~-
g
16 C 20 24 28 32 36B) Relative abundance of main taxa (%)
Figure 6, ln core COROS03-CLOS-37BC, data as a function of depth A) concentration ofbenthic foraminifera (tests g-I), the bold curve represents calcareous taxa only, whereas the dotted curve corresponds to total concentrations including calcareous and agglutinated taxa, Agglutinated taxa were treated separately due to uncertainties linked to their preservation in sediments. In B), relative abundance of the main calcareous benthic foraminifer taxa (%) and the relative abundance of agglutinated taxa is shown
in the last column to the right. The upper 8 cm of the core have been highlighted in grey as they show important changes in the
benthic foraminifera assemblages, according to our age models these changes started between the 1940s and the 1960s,
w w
-
a. C QI 20 20 24 24 28 28 32 32 .... ...._. .'. 36 36Figure 7. In core COROS03-CLOS-37BC, isotopie analysis of shel1s of benthic foramin ifera Bulimina exilis as a function of depth A) () 180 (%0); B) ol3C (%0). The bold curves
8 180 represent S-point running means. According to our age models, the important decrease occuning from 16 to 0 cm depth started between the 1880s and the 191 Os.