HAL Id: tel-01744747
https://pastel.archives-ouvertes.fr/tel-01744747
Submitted on 27 Mar 2018HAL is a multi-disciplinary open access archive for the deposit and dissemination of sci-entific research documents, whether they are pub-lished or not. The documents may come from teaching and research institutions in France or abroad, or from public or private research centers.
L’archive ouverte pluridisciplinaire HAL, est destinée au dépôt et à la diffusion de documents scientifiques de niveau recherche, publiés ou non, émanant des établissements d’enseignement et de recherche français ou étrangers, des laboratoires publics ou privés.
Biomarker Discovery for Breast Cancer
Yunlong Jiao
To cite this version:
Yunlong Jiao. Rank-based Molecular Prognosis and Network-guided Biomarker Discovery for Breast Cancer. Cancer. Université Paris sciences et lettres, 2017. English. �NNT : 2017PSLEM027�. �tel-01744747�
de l’Université de recherche Paris Sciences et Lettres
PSL Research University
Préparée à MINES ParisTech
Rank-based Molecular Prognosis and Network-guided Biomarker
Discovery for Breast Cancer
Pronostic moléculaire basé sur l’ordre des gènes et découverte de biomarqueurs guidé par des réseaux pour le cancer du sein
École doctorale n
o432
SCIENCES DES MÉTIERS DE L’INGÉNIEUR
Spécialité
BIO-INFORMATIQUESoutenue par
Yunlong JIAO
le 11 septembre 2017
Dirigée par
Jean-Philippe VERT
COMPOSITION DU JURY :
M. Francis BACH INRIA, Président
M. Stéphan CLEMENCON Télécom ParisTech, Rapporteur M. Risi KONDOR
University of Chicago, Rapporteur Mme Chloé-Agathe AZENCOTT MINES ParisTech, Examinateur M. Joaquin DOPAZO
Fundación Progreso y Salud, Examinateur M. Jean-Philippe VERT
Abstract
Breast cancer is the second most common cancer worldwide and the leading cause of women’s death from cancer. Improving cancer prognosis has been one of the problems of primary interest towards better clinical management and treatment decision making for cancer patients. With the rapid advancement of genomic profiling technologies in the past decades, easy availability of a substantial amount of genomic data for medical research has been motivating the currently popular trend of using computational tools, especially machine learning in the era of data science, to discover molecular biomarkers regard-ing prognosis improvement. This thesis is conceived followregard-ing two lines of approaches intended to address two major challenges arising in genomic data analysis for breast cancer prognosis from a methodological standpoint of ma-chine learning: rank-based approaches for improved molecular prognosis and network-guided approaches for enhanced biomarker discovery. Furthermore, the methodologies developed and investigated in this thesis, pertaining respec-tively to learning with rank data and learning on graphs, have a significant contribution to several branches of machine learning, concerning applications across but not limited to cancer biology and social choice theory.
Résumé
Le cancer du sein est le deuxième cancer le plus répandu dans le monde et la principale cause de décès due à un cancer chez les femmes. L’amélioration du pronostic du cancer a été l’une des principales préoccupations afin de per-mettre une meilleure gestion et un meilleur traitement clinique des patients. Avec l’avancement rapide des technologies de profilage génomique durant ces dernières décennies, la disponibilité aisée d’une grande quantité de données génomiques pour la recherche médicale a motivé la tendance actuelle qui con-siste à utiliser des outils informatiques tels que l’apprentissage statistique dans le domaine de la science des données afin de découvrir les biomarqueurs moléculaires en lien avec l’amélioration du pronostic. Cette thèse est conçue suivant deux directions d’approches destinées à répondre à deux défis ma-jeurs dans l’analyse de données génomiques pour le pronostic du cancer du sein d’un point de vue méthodologique de l’apprentissage statistique : les ap-proches basées sur le classement pour améliorer le pronostic moléculaire et les approches guidées par un réseau donné pour améliorer la découverte de biomarqueurs. D’autre part, les méthodologies développées et étudiées dans cette thèse, qui concernent respectivement l’apprentissage à partir de données de classements et l’apprentissage sur un graphe, apportent une contribution significative à plusieurs branches de l’apprentissage statistique, concernant au moins les applications à la biologie du cancer et la théorie du choix social.
Acknowledgments
First and foremost, I would like to thank Jean-Philippe Vert for being an inspiring advisor and a supportive supervisor, for having welcomed me into CBIO with an amazing funding opportunity, for sharing his experience and ideas with me that have both consciously and unconsciously shaped my academic and communication skills, for setting an excellent example of a re-searcher with contagious enthusiasm and a group leader with motivational leadership, without whom I would simply never have completed this thesis.
During my PhD, I was fortunately offered the opportunity to work with Joaquin Dopazo, who proposed and led one of my doctoral projects and men-tored me with encouragement and inspiration during my stay at CIPF, and Stefan Kobel, who patiently trained my presentation skills and enriched my background knowledge in biochemistry during my stay at Roche; both mentors have been huge influences to me, for which I cannot express enough gratitude. Many other people have contributed, directly or indirectly, to the work presented in this thesis, and I would like to thank: Elsa Bernard, Erwan Scor-net, Véronique Stoven and Thomas Walter, for participating in the DREAM challenge as a team; Fabian Heinemann and Sven Dahlmanns, for the dis-cussion on the project of analyzer failure prediction; Eric Sibony and Anna Korba, for suggesting and collaborating on the project of rank aggregation; Marta Hidalgo, Cankut Çubuk, Alicia Amadoz, José Carbonell-Caballero and Rubén Sánchez, for the comments and help on the project of network analysis; last but not least, Vincent Brunet, for always being so responsive and helpful whenever I had an embarrassingly trivial problem with the server.
I would also like to thank my thesis reviewers, Risi Kondor and Stéphan Clémençon, for their time, interest and helpful comments, and other members on my defense jury, Chloé-Agathe Azencott, Francis Bach, Joaquin Dopazo and Jean-Philippe Vert, for their time and insightful questions.
The few people who have been an immensely significant part of my pro-fessional and personal life during my PhD must be specially mentioned, in that my unexpected encounter with them and their involvement in my life afterwards can only be described by no better words than kizuna (a special bond of friendship).
MeiMei channn, thank you for being the first person who ever talked to me at our first ITN summer school in Tübingen and then becoming one of my closest friends two years later at the fourth time we met, for those countless times of selflessly helping and teaching me with programming, biology and everything you know, for always being there for me caring every little thing happening around me, for listening to my joys and misery and also sharing happiness and frustration in life, for having never complained about my con-stant complaints and never been bored of my tedious stories, for every moment
during the very few times we could meet that I cherish for the rest of my life, or simply for agreeing instantaneously to have more than two dinners until we got totally bloated every time we hang out.
Puppy Peeter, thank you for showing up in CBIO since when the lab just seemed to me a much different place to be in, for helping Google translate all the abstracts in this thesis into French together with lovely Lucile, for having the best taste in food, except for cheese, and sharing as much interest in burgers as I do, for being the first one and the only one in the lab for a long time who would think calling me by a different name was not an inappropriate thing, or simply for being so adorable to talk to, to be around with or just to look at.
Cankut, thank you for being such a great labmate, flatmate and frrriend during my stay in Valencia, for showing me around so many times that had made me fall in love with every bit of the city, for being one of the most truly selfless and genuinely sympathetic people I know, for having the cutest beagle in the world, MoMo, who would lick me every morning until I woke up, or simply for being one of the most important reasons that my stay in Spain was such an unforgettable experience that I keep going around telling everyone how much it means to me.
MI LOBE SEÑORITO, shank you for being Shpanish first of all, then for teaching me sho much matsch, including eigenvaluesh in particular, and in-fluenshing me with your shrewd wishdom in life, for trushting me blindfolded and opening up to me sho easily that makesh me feel sho very shpecial, for making me shunny in a gloomy placshe without even having to try, for putting up with my shilliness and grumpiness and even being shilly and grumpy to-gether, or shimply for running down with me to my favorite reshtaurant in Parish every Tueshday, but the one shing I am not at all shankful for is how late you came in my life when I will have to leave shoon.
jacoPoo, thank you for having made my last year in Paris so wOndErfUl, for bringing up the Italian soul in me by giving me an Italian name now everyone knows me by and teaching me how to speak with a hand, for showing me the aesthetic side of you that enlightens my capacity for art, for always understanding me and sticking with me under any circumstances, or simply for being my brother from another mother who made me leaving Paris so much harder than it should have been.
Ana! Thank you too for having made my last year in Paris so special, for having the unique personality of being the meanest on the outside and sweetest on the inside, for bringing the competition of being shameless to another level for me, for not only enduring but treasuring the superficiality and stupidity of me, or simply for being my sister from another mother who too made me leaving Paris so much harder than it should have been.
Nelle, for having helped me a lot during and especially at the beginning of my PhD as an admirable senpai (a senior colleague) to me, for giving me plenty of valuable advice on building a professional career, and for co-founding the CBOG (CBIO Beer Organizing Group); Véronique, for being one of the most optimistic and delightful people I know who tells the funniest stories non-stop while being a respectable professor; Thomas, for being a determined researcher and a motivating character to me; Chloé, for giving a lot of helpful comments and advice on learning with networks, and for setting up an outstanding example for me as a researcher with a successful career established at my age; Victor, for being the only other person in the lab who did not speak French for three years; Nino, for being so kind and encouraging all the time with whom I could talk about science, even comfortably in French; Marine, for having to sit in the same office with me with whom I could “professionally” and casually talk to from time to time at work; Beyrem, for being a funny guy; Xiwei, for so many pieces of important information that I managed to not have myself evicted by the French prefectures; Benoît, for accomplishing the mission impossible that you had single-handedly changed what Paris and France meant to me; Joe, for being such an adorable human being I like to hang out a lot with but at the same time such an annoying yet weirdly charming one I can never really get mad at; and many others from CBIO I will apologetically skip naming, for the enjoyable moments and pleasant
conversations over a cup of coffee or a pint of beer occasionally. Besides
the regulars, Ramona, Ilaria and several other visitors brought appreciable dynamic to CBIO, for which I am very grateful.
During my secondments in Germany and in Spain, many people came across that made my short stay abroad much less lonely, and I would deeply thank: Kathrin, Miaolin and others colleagues from Roche, for their ami-able company in Penzberg; Edgar, Carol, Pau, Kinza, Sema, Julen and other colleagues from CIPF, for their delightful friendship in Valencia, especially outside of the lab, and Javi, for hosting me in his apartment with enormous generosity and warm-heartedness when I went to Madrid for visa affairs.
Finally, this thesis is dedicated to the most important people in my life even though they would never have read this, my parents, for always believing in me since I was born, for having supported every decision I made, for raising me up and providing everything I needed but never asking anything in return. Funding-wise, my PhD was supported by the European Union 7th Frame-work Program through the Marie Curie Initial Training NetFrame-work (ITN) Ma-chine Learning for Personalized Medicine (MLPM) grant No. 316861, and by the European Research Council grant ERC-SMAC-280032.
Paris, July 2017 Yunlong
Abstract i
Résumé iii
Acknowledgments v
List of Figures xi
List of Tables xv
List of Symbols xvii
List of Thesis Deliverables xix
1 Introduction 1
1.1 General Background of Breast Cancer . . . 2
1.2 Towards Molecular Prognosis . . . 4
1.3 Genomic Data Analysis: Topics, Prospects and Challenges . . . 7
1.4 Contribution of the Thesis . . . 12
2 The Kendall and Mallows Kernels for Permutations 17 2.1 Introduction. . . 18
2.2 The Kendall and Mallows Kernels for Permutations. . . 19
2.3 Extensions of the Kendall Kernel to Rank Data . . . 21
2.3.1 Extension to Partial Rankings . . . 21
2.3.2 Extension to Multivariate Rankings . . . 29
2.3.3 Extension to Uncertain Rankings . . . 29
2.4 Relation of the Mallows Kernel and the Diffusion Kernel on Sn . . . 35
2.5 Application: Clustering and Modeling Rank Data. . . 36
2.5.1 Clustering with Kernel k-means. . . 37
2.5.2 Mallows Mixture Model with Kernel Trick . . . 38
2.5.3 Experiments . . . 40
2.6 Application: Supervised Classification of Biomedical Data . . . 44
2.7 Discussion . . . 50
3 Network-based Wavelet Smoothing for Analysis of Genomic Data 53 3.1 Introduction. . . 54
3.2 Methods . . . 56
3.2.1 Feature Selection Under Predictive Modeling Framework. . . 56
3.2.2 Network-guided Feature Selection: A Review of Related Work 58 3.2.3 Network-based Wavelet Smoothing for Feature Selection . . . 61
3.2.4 Implementation . . . 63
3.3 Results. . . 66
3.3.1 Experiment Set-ups: Data, Network and Methods . . . 66
3.3.2 Simulation Studies . . . 68
3.3.3 Breast Cancer Survival Analysis . . . 72
3.4 Discussion . . . 79
4 Signaling Pathway Activities Improve Prognosis for Breast Cancer 83 4.1 Introduction. . . 84
4.2 Methods . . . 86
4.2.1 Data Source and Processing . . . 86
4.2.2 Modeling Framework for Signaling Pathways . . . 89
4.2.3 Cancer Prognosis with Inferred Signaling Pathway Activity . 91 4.3 Results. . . 93
4.3.1 Signaling Pathway Activities Lead to Improved Prognosis for Breast Tumor Samples . . . 93
4.3.2 Signaling Circuits Selected as Features Relevant for Cancer Prognosis Account for Cancer Hallmarks. . . 96
4.3.3 The Classification Algorithm Suggests Additional Prognostic Genes That Do Not Code for Signaling Proteins . . . 97
4.4 Discussion . . . 99
5 Conclusion and Perspectives 103 A A Tractable Bound on Approximating Kemeny Aggregation 109 A.1 Introduction. . . 110
A.2 Kemeny Aggregation Problem. . . 111
A.3 Geometric Analysis of Kemeny Aggregation . . . 112
A.4 Controlling the Distance to Kemeny Consensus . . . 114
A.5 Geometric Interpretation Revisit and Proof of Theorem A.1 . . . 115
A.5.1 Interpretation of the Condition in Theorem A.1 . . . 117
A.5.2 Proof of Theorem A.1 . . . 119
A.6 Numerical Experiments . . . 120
A.6.1 Tightness of the Bound . . . 121
A.6.2 Applicability of The Method . . . 123
A.7 Discussion . . . 124
1.1 This image from [Commons 2017] illustrates an example of gene ex-pression values from microarray experiments represented as a heatmap of two color dyes, with patients in rows and probes in columns, to visualize results of data analysis. . . 5 1.2 This figure from [Bilal 2013, Figure 2] illustrates that the best
per-former among submissions to the pilot competition uses a combina-tion of clinical and molecular features that are deliberately selected subject to prior knowledge (the MPC category). Models submit-ted are categorized by the type of features they use: only clinical features (C), only molecular features (M), molecular and clinical fea-tures (MC), molecular feafea-tures selected using prior knowledge (MP), molecular features selected using prior knowledge and clinical fea-tures (MPC). . . 11 1.3 This figure from [Rapaport 2007, Figure 3] illustrates an example
of metabolic pathways, mapped by coefficients of the decision func-tion obtained by applying a free model (left) and a network-guided model (right) in color, positive in red and negative in green with intensities reflecting absolute values, where some large highly connected functional parts of the network with annotations such as proteinkinases and DNA and RNA polymerase subunits were identi-fied by the network-guided model, rendering readily available inter-pretability of the involvement of the selected genes in cancer. . . 13 2.1 Smooth approximation (in red) of the Heaviside function (in black)
used to define the mapping (2.14) for a = 1. . . . 31 2.2 Cayley graph of S4, generated by the transpositions (1 2) in blue, (2
3) in green, and (3 4) in red. . . 36 2.3 Computational time (in seconds) of k-means algorithms per run across
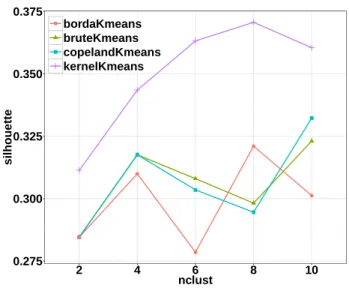
different number of clusters. . . 41 2.4 Average silhouette scores of k-means methods across different number
of clusters.. . . 42 2.5 Across different number of clusters, Rand index between clustering
assignments by running k-means algorithm on bootstrap replicas of the 1980 APA election data. For each fixed number of clusters, the boxplot represents the variance over 100 repeated runs. . . 43 2.6 Average silhouette scores of Mallows mixture modeling methods across
different number of clusters. . . 43 2.7 Clustering results of participating countries to the ESC according to
their voting behavior illustrated by geographic map and silhouette plot. . . 45
2.8 Model performance comparison (ordered by decreasing average ac-curacy across datasets). . . 48 2.9 Sensitivity of kernel SVMs to C parameter on the Breast Cancer 1
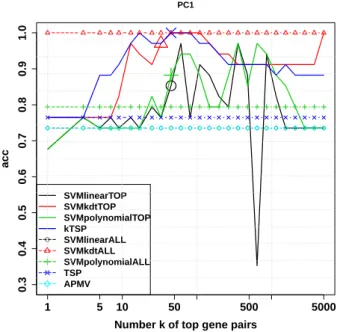
dataset. (Special marks on SVM lines denote the parameter returned by cross-validation.) . . . 49 2.10 Impact of TSP feature selection on the Prostate Cancer 1 dataset.
(Special marks on SVM lines denote the parameter returned by cross-validation.) . . . 49 2.11 Empirical performance of smoothed alternative to Kendall kernel on
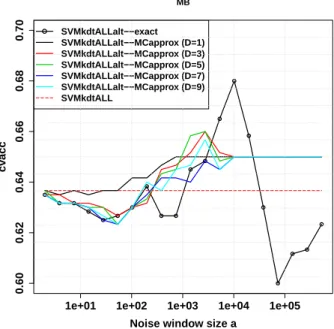
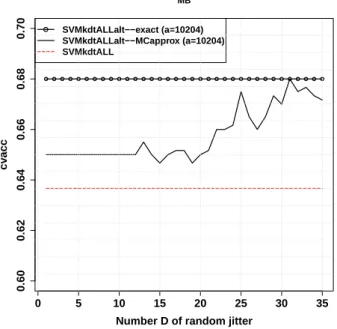
the Medulloblastoma dataset. . . . 50 2.12 Empirical convergence of Monte Carlo approximate at the fixed
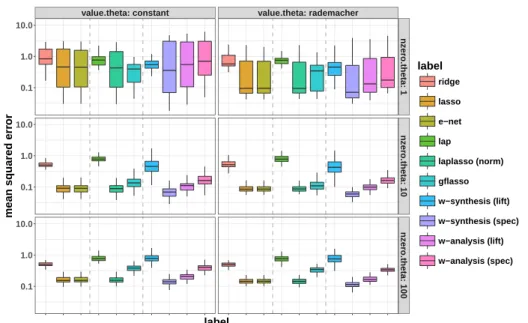
win-dow size attaining maximum underlying accuracy from the left plot. 51 3.1 Boxplots on regression performance evaluated by prediction mean
squared error over the 100 training and test splits of the simulated data. . . 70 3.2 Precision-recall plots on the recovery of simulated support of the
coefficient vector β and the connecting edges over the network. . . . 71 3.3 Boxplots on survival risk prediction performance evaluated by
con-cordance index scores over 5-fold cross-validation repeated 10 times of the METABRIC data.. . . 73 3.4 Stability performance of gene selection related to breast cancer
sur-vival, estimated over 100 random experiments. The black dotted curve denotes random selection. . . 75 3.5 Connectivity performance of gene selection related to breast cancer
survival, where special marks correspond to the number tuned by cross-validation. The black dotted curve denotes random selection. . 76 3.6 Gene subnetworks related to breast cancer survival identified by
reg-ularization methods using the METABRIC data and HPRD PPI network. . . 77 4.1 An illustration of cell signaling process. Typically the signal
trans-duction begins at receptor proteins that receive molecular stimuli from cell microenvironment and ends at effector proteins that exe-cute specific actions in response to the stimulation. . . 85 4.2 The different levels of abstraction within pathways: A) Circuits that
communicate one receptor to one effector; B) Effector circuits that communicate all the receptors that signal a specific effector; C) Func-tion circuits that collect the signal from all the effectors that trigger a specific function (according to UniProt or GO keywords); D) Cancer hallmarks, a sub-selection of only those functions related to cancer hallmarks. . . 89
4.3 An example of computing the activity value of an artificial circuit by the hiPathia method. In Step 1, node values are derived from the normalized mRNA measurements. In Step 2, signal is propagated along the path while its intensity value gets updated according to the rule of the hiPathia method. Finally, The signal value attained after the last protein is visited accounts for the signaling activity of the circuit. . . 91 4.4 The AUROC performance of using different types of profiles as
pre-dictive features to classify survival outcome for breast cancer pa-tients. Boxplot represents the variance of the performance on 50 cross-validation splits. Dotted vertical lines separate profiles by the underlying analysis levels. . . 96 A.1 Kemeny aggregation for n = 3. . . . 114 A.2 Level sets of the extended cost function CN over S for n = 3. . . . . 117 A.3 Geometric illustration of the bound in Lemma A.2 with x = φ(σ) and
k = r42 taking integer values (representing possible Kendall’s tau dis-tance). The smallest integer value for k such that these inequalities hold is k = 2. . . . 119 A.4 Boxplots of s (r, DN, n) over sampling collections of datasets shows
the effect from different voting rules r with 500 bootstrapped pseudo-samples of the APA dataset (n = 5, N = 5738). . . . 122 A.5 Boxplots of s (r, DN, n) over sampling collections of datasets shows
the effect from datasets DN. 100 Netflix datasets with the presence of Condorcet winner and 100 datasets with no Condorcet winner (n = 4 and N varies for each sample). . . . 123 A.6 Boxplots of s (r, DN, n) over sampling collections of datasets shows
the effect from different size of alternative set n with restricted sushi datasets (n = 3; 4; 5, N = 5000). . . . 124 A.7 Boxplots of kmin over 500 bootstrapped pseudo-samples of the sushi
2.1 Summary of biomedial datasets.. . . 46 2.2 Prediction accuracy (%) of different methods across biomedical datasets
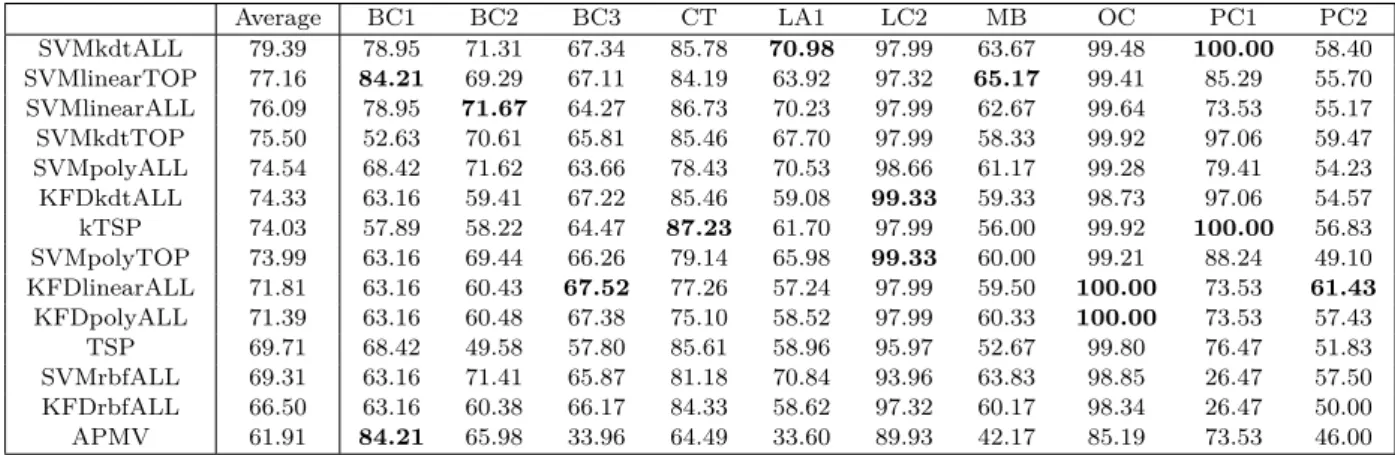
(ordered by decreasing average accuracy across datasets). Models are named after candiate methods (SVM or KFD) and candiate kernels, namely linear kernel (linear), 2nd-order homogeneous polynomial kernel (poly), Gaussian RBF kernel (rbf) or Kendall kernel (kdt), and whether feature selection is combined (TOP) or not (ALL). Pre-diction accuracy of the best-performing models for each dataset is in boldface.. . . 48 3.1 Summary of different regularization methods in our numerical
exper-iments. . . 68 3.2 Mean concordance index (CI) scores (± standard deviation) of
sur-vival risk prediction over 5-fold cross-validation repeated 10 times of the METABRIC data. Methods are ordered by decreasing mean CI scores. . . 73 4.1 Summary of survival outcome of the breast cancer patients in the
TCGA dataset. . . 86 4.2 The 60 KEGG pathways for which signaling activity is modeled. . . 87 4.3 Summary of 9 different types of profiles used as predictive features
for breast cancer prognosis. . . 92 4.4 The 12 candidate classifiers used to discriminate prognosis classes for
breast tumor samples. . . 94 4.5 Mean AUROC scores with standard deviation (SD) and the top 2
most frequently selected classifiers by internal cross-validation for each type of prognostic profile in classifying breast cancer prognosis. 94 4.6 FDR-adjusted p-values comparing the difference between the
corre-sponding AUROC scores of profiles in columns and profiles in rows over 50 cross-validation splits. See Table 4.5 for the mean scores of each profile individually. Significant p-values are boldfaced and marked with asterisks. . . 95 4.7 Top 5 circuits with the highest feature importance measure by fitting
Random Forests with path.vals in classifying breast cancer prognosis, along their functions as annotated in Gene Ontology (GO). . . 98 4.8 Top 5 effector circuits with the highest feature importance measure
by fitting Random Forests with eff.vals in classifying breast cancer prognosis, along their functions as annotated in Gene Ontology (GO). 98
4.9 Top 5 other-genes (genes unrelated to cell signaling) with the highest
feature importance measure by fitting Random Forests with path.and.other.genes.vals in classifying breast cancer prognosis, along their functions as
anno-tated in Gene Ontology (GO).. . . 100 A.1 Summary of a case-study on the applicability of The Method with the
sushi dataset (N = 5000, n = 10). Rows are ordered by increasing
Learning Setup X Input Space
x Input Vector or Uncertain Rank-ing
Y Output Space
y Output Response of Interest
D Dataset
m, N Number of Observations
n Dimensionality
Permutation and Ranking JnK Item Set or {1, 2, . . . , n} Sn Symmetric Group onJnK
nc Number of Concordant Pairs
nd, d Number of Discordant Pairs or Kendall Tau Distance
σ, π, τ Permutation or Total Ranking R Partial Ranking
R Multivariate Ranking Kernel Learning
F Feature Space
K Positive Definite Kernel
Kτ Kendall Kernel KM Mallows Kernel Φ, φ Kendall Embedding Learning on Graphs G Graph V Vertex Set E Edge Set L Graph Laplacian Ψ Graph Wavelets Ω Graph Dual Wavelets
P Regularization or Penalty Func-tion
β Linear Prediction Coefficients Kemeny Aggregation
σ∗ Kemeny Consensus
K Set of Kemeny Consensuses
θ Euclidean Angle
r Approximate Voting Rule Other Notations
R Set of Real Numbers P Probability
Working Papers and Preprints
• Y. Jiao and J.-P. Vert. Network-based Wavelet Smoothing for Analysis of
Genomic Data. Technical report, École nationale supérieure des mines de
Paris, 2017.
• Y. Jiao, M. R. Hidalgo, C. Çubuk, A. Amadoz, J. Carbonell-Caballero, J.-P. Vert and J. Dopazo. Signaling Pathway Activities Improve Prognosis for
Breast Cancer. 2017. Submitted. bioRxiv preprint bioRxiv-132357.
• Y. Jiao and J.-P. Vert. The Kendall and Mallows Kernels for Permutations. IEEE Transactions on Pattern Analysis and Machine Intelligence (TPAMI), 2017. In press. HAL preprint HAL-01279273.
• E. Bernard, Y. Jiao, E. Scornet, V. Stoven, T. Walter and J.-P. Vert. Kernel
Multitask Regression for Toxicogenetics. Molecular Informatics, 2017. In press.
bioRxiv preprint bioRxiv-171298. Published Papers
• Y. Jiao, A. Korba and E. Sibony. Controlling the Distance to a Kemeny
Consensus without Computing It. In Proceedings of the 33rd International
Conference on Machine Learning (ICML-16), pages 2971–2980, 2016.
• F. Eduati, L. Mangravite, T. Wang, H. Tang, J. Bare et al. Prediction of
human population responses to toxic compounds by a collaborative competition.
Nature Biotechnology, vol. 33, no. 9, pages 933–940, 2015.
• Y. Jiao and J.-P. Vert. The Kendall and Mallows Kernels for Permutations. In D. Blei and F. Bach, editors, Proceedings of the 32nd International Conference on Machine Learning (ICML-15), pages 1935–1944, 2015.
Patents and Patent Applications
• Y. Jiao, J.-P. Vert, F. Heinemann, S. Dahlmanns and S. Kobel. Failure State
Prediction for Automated Analyzers for Analyzing a Biological Sample, 2016.
Pending European patent filed by Roche Diagnostics GmbH, F. Hoffmann–La Roche AG, December 2016.
Software
• Y. Jiao. kernrank, version 1.0.2.https://github.com/YunlongJiao/kernrank, 2016. Online; accessed April 2016. Open-source R package publicly available on GitHub.
Introduction
Abstract: Breast cancer is the second most common cancer worldwide and the leading cause of women’s death from cancer. Improving cancer prognosis has been one of the problems of
primary interest towards better clinical management and treatment decision making for cancer patients. With the rapid advancement of genomic profiling technologies in the past decades, easy
availability of a substantial amount of genomic data for medical research has been motivating the currently popular trend of using computational tools, especially machine learning in the era of data science, to discover molecular biomarkers regarding prognosis improvement. This chapter briefly summarizes the general
background of breast cancer with a particular focus on breast cancer prognosis, reviews the prospects and challenges in genomic data analysis, and overviews the methodologies and contribution of the thesis work in this research area.
Résumé : Le cancer du sein est le deuxième cancer le plus répandu dans le monde et la principale cause de décès due à un cancer chez les femmes. L’amélioration du pronostic du cancer a été l’une des principales préoccupations afin de permettre une meilleure gestion et un meilleur traitement clinique des patients. Avec l’avancement rapide des technologies de profilage génomique durant ces dernières décennies, la disponibilité aisée d’une grande quantité de données génomiques pour la recherche médicale a motivé la tendance actuelle qui consiste à utiliser des outils informatiques tels que l’apprentissage statistique dans le domaine de la science des données afin de découvrir les biomarqueurs moléculaires en lien avec l’amélioration du pronostic. Ce chapitre résume brièvement le contexte général du cancer du sein avec un point particulier sur son pronostic, détaille les perspectives et les défis dans l’analyse des données génomiques, et présente les méthodologies et contributions de la thèse dans ce domaine de recherche.
1.1
General Background of Breast Cancer
Breast cancer refers to a malignant tumor that has developed from cells in the breast. Uncontrolled growth of cancer cells can invade nearby healthy breast tissue over time, and if cancer cells get into the lymph nodes that are small organs that filter out foreign substances in the body, they could then have a system of spread-ing further into other parts of the body and form new tumors in distant organs or tissues, a process called distant metastasis that aggravates the situation to a signif-icant extent. Breast cancer is the most common cancer in women worldwide and second most common cancer overall for both genders in terms of incidence rates (following lung cancer), and it is the leading cause of cancer death among women in developing countries and the second leading cause of cancer death (following lung cancer) among women in developed countries [Torre 2015].1 Over 521,900 women worldwide were estimated to have died in 2012 due to breast cancer [Ferlay 2013].2 Survival rates have in general been improving over the past decades, as a result of increased awareness, earlier detection through mammographic screening, adequate medical care and cancer treatment advances, with the caveat that rates vary greatly worldwide and still remain quite low in less developed countries.
Diagnosis of cancer, determination of the presence (or extent) of the disease, is performed by means of (incisional) biopsy, a medical test in which surgeons extract sample cells or tissues for pathologists to examine under microscope or further ana-lyze chemically. If diagnosed early, the initial treatment for breast cancer is usually accomplished by complete removal of tumor by surgery or radiation (mastectomy or less-extensive breast-conserving surgery) without damage to the rest of the body. After the initial treatment (or in case that the initial treatment should not be appli-cable), many patients receive additional treatment, including adjuvant chemother-apy, hormone therapy and targeted therchemother-apy, to lower the risk of relapse, that is the recurrence risk of cancer-related conditions, and/or to prevent metastasis. However, as the most common type of adjuvant therapy, chemotherapy usually involves cyto-toxic drugs and has strong deleterious side effects, and the intake of such aggressive treatment should hence be minimized for those that will not necessarily need it. Therefore, to identify those patients who should receive adjuvant chemotherapy is of chief importance in improving the feasibility of treatment deployment in routine clinical management of cancer. The decision of whether to receive such treatment or not is made based on prognosis of the cancer patient, that is the estimation of the risk of relapse or likely course of outcome if no additional treatment is given after the initial treatment, and further treatments are considered most beneficial for patients with poor prognosis and some cases of good prognosis can even choose the option to forgo chemotherapy.3 In order to quantify prognosis results, a patient is
1
See more cancer facts and statistics summary at https://www.cancer.org/research/
cancer-facts-statistics.html. 2
See more of contemporary estimates of the incidence of, mortality and prevalence from major types of cancer athttp://globocan.iarc.fr/.
3
usually categorized into prognostic groups of high or low risk corresponding to one of the four common types of survival risk: distant metastasis-free survival, (local or distant) recurrence-free survival, disease-free survival, overall survival. Note that the following discussion applies to any specific survival unless specified otherwise.
Conventionally, breast cancer prognosis is based solely on clinico-pathological information collected from patients and tumors. Several commonly used clinico-pathological parameters have been well established to be indicative of likely prog-nosis of patients, and thus widely adopted in the clinical management of breast cancer. For example, it is known that breast cancer with cancer cells detected in lymph nodes has a higher risk of relapse than breast cancer in situ, and thus re-quires to be treated with certain adjuvant chemotherapies that are usually more aggressive [Moffat 2014]. In fact, doctors most often evaluate the severity of breast cancer based on the Nottingham grading system, a score-based grading system us-ing clinico-pathological parameters such as the size and shape of the nucleus in the tumor cells and how many dividing cells are present [on Cancer 2010]. High-grade tumors look the most abnormal from normal cells and tend to be the most invasive, and are thus classified with poor prognosis. As another example, hormone receptors in breast cancer, estrogen-receptor (ER) and progesterone-receptor (PR), play an important role in normal glandular development and in breast cancer progression, and their status is therefore highly prognostic (as well as predictive to the respon-siveness of hormone and endocrine therapies) [Moffat 2014]. Some online tools exist to perform prognosis of cancer patients and aid physicians weigh against the risks and benefits of adjuvant treatments, among which stands out the renowned
Adju-vant! Online4. Notably, the six predictors that are shown highly prognostic and
used by Adjuvant! Online to predict cancer-related mortality and relapse are: pa-tient age, tumor size, grade, hormone receptor status, number of positive lymph nodes and comorbidity level.
Due to the intrinsic heterogeneity across breast cancer tumors, patients of sim-ilar clinico-pathological type can have remarkably different survival outcome. An example constituted by [van ’t Veer 2008] will be quoted here. Large meta-analyses show that recurrence is likely in 20–30% of young women with early-stage (lymph node-negative) breast cancer, but in the United States 85–90% of women with this type of cancer receive adjuvant chemotherapy, among whom 55–75% therefore undergo a toxic therapy that they would very likely not benefit from but may ex-perience the undesirable side effects. Since cancer is a inherently complex disease, the unwanted situation is mostly due to the fact that clinico-pathological informa-tion alone is far from sufficient to reliably identify those patients who are likely to
that is the estimation of the course of outcome if no additional treatment is given and hence the identification of those patients who are most likely to need additional treatment; prediction that is the identification of patients who are most likely to benefit from a specific treatment and hence the determination on which treatment should be most responsive and effective for a patient. While prognosis and prediction are equally important and usually discussed together in literature, prediction will be mostly omitted from discussion for ease of the presentation of this thesis.
4
relapse, let alone to accurately characterize the outcome of each particular case in order to personalize the best therapeutic option. It is recognized as an important yet challenging task to improve prognosis for each diseased individual and identify more efficient prognostic features, burgeoning the research of interest in interrogat-ing breast cancer at the molecular level.
1.2
Towards Molecular Prognosis
As [Vogelstein 2004] put it, who are pioneers in cancer molecular biology research:
“The revolution in cancer research can be summed up in a single sentence: cancer is, in essence, a genetic disease.”
Among many explanations on cancer biology, a widely accepted one states that cancer is caused by genomic abnormalities, such as the accumulation of mutations or the dysregulation of gene expression involving tumor suppressor genes and onco-genes in cancer cells. For decades, the number of onco-genes with established involvement in cancer development has been increasing significantly, and it has been appreciated that their biological functions are organized by a few principles, named the
hall-marks of cancer, which rationalize the complexities of cancer and are all underlaid
by genome instability generating genetic diversity [Hanahan 2000, Hanahan 2011]. It is now common knowledge that genomic features contain unique characteristics of each individual being and offer the opportunity of scrutinizing the individuality of each breast tumor. Often termed by biomarkers are such molecular features, typically genes, whose abnormal presence or dysfunctional behavior characterizes the biological heterogeneity of tumours, leading to molecular subtyping of cancer, and can thus be indicative of prognosis. While biomarkers can be associated to any phenotype of interest in general, the discussion will particularly focus on biomarkers related to breast cancer prognosis in accordance with the objective of the present thesis.
Many biomarkers related to breast cancer survival have been reported in the literature. For example, somatic mutations in gene TP53 show association with worse survival, independent of other risk predictors, see for instance a meta-analysis
by [Pharoah 1999]. Worse breast cancer survival of gene BRCA mutation
carri-ers vcarri-ersus non-carricarri-ers have been confirmed by several meta-analyses [Zhong 2015,
Zhu 2016]. Over-expression of gene HER2, pathologically termed as HER2-positive,
is linked to poorer outcome of node-negative breast cancers [Chia 2008], a widely-observed association that has led to the advent of several HER2-directed therapies
[Arteaga 2012]. Notably, major molecular subtypes of breast cancer are determined
by the gene expression status, over- or under-expression, of hormone receptors and HER2, based on which physicians usually perform prognosis and plan treatments
[Schnitt 2010]. For a review on currently established and emerging biomarkers for
breast cancer prognosis, see [Weigel 2010].
From the foundation and completion of Human Genome Project (HGP) to the foundation of The Cancer Genome Atlas Research Network (TCGA), the rapid
advancement of genomic profiling technologies in the past decades have paved way to the advent of the current “omics” revolution. Nowadays, thousands up to millions of genomic features can be efficiently collected from biological samples available for medical research. Taking gene expression profiling as an example, DNA microarray, a hybridization-based technology, measures the relative expression activity of a large number of predetermined list of target genes in a single experiment (Figure
1.1) [Lockhart 1996]. RNA-seq, a next-generation sequencing-based technology,
was later invented to provide expression measurements of gene sequences at lower cost and higher throughput (or larger genome coverage) with many advantages benchmarked against previous technologies [Wang 2009].
Figure 1.1: This image from [Commons 2017] illustrates an example of gene expression
values from microarray experiments represented as a heatmap of two color dyes, with pa-tients in rows and probes in columns, to visualize results of data analysis.
The revolution of gene expression profiling technologies fostered the development of multigene expression signatures for breast cancer prognosis, a group of biomarker genes whose combined expression pattern refines prognosis (usually with
incremen-tal value added to the use of standard clinico-pathological parameters). The re-search of prognostic signatures has resulted in many success stories [Sotiriou 2009]. Notably, as of today there exist at least six different prognostic multigene expression signatures commercially available to aid clinical decision making of breast cancer:5 • MammaPrint R (Agendia, Amsterdam, The Netherlands) [van ’t Veer 2002]
is a 70-gene microarray-based expression profile for stratifying breast cancer into high- or low-risk prognostic groups. As one of the earliest success stories, it was the first test approved by the Food and Drug Administration (FDA) in the United States and by regulators in the European Union as an ad-junct prognostic assay for women patients satisfying criteria6 including stage I/II, invasive infiltrating carcinoma, tumor size less than 5.0 cm, lymph node negative (or up to three lymph nodes positive).
• Prosigna R Breast Cancer Prognostic Gene Signature Assay or PAM50
(Nanos-tring Technologies, Seattle, WA, USA) [Parker 2009] is a 50-gene assay for classifying breast tumors into five intrinsic subtypes (luminal A, luminal B, HER2-enriched, basal-like, normal-like) that are prognostic independent of standard clinico-pathological parameters. It is the second FDA-approved test in the United States to estimate distant recurrence risk for stage I/II (includ-ing one to three positive nodes), ER-positive breast cancer in postmenopausal women treated with adjuvant endocrine therapy, and it also received clear-ance in the European Union.
• Oncotype DX R (Genomic Health, Redwood City, CA, USA) [Paik 2004] is
a 21-gene signature for categorizing tamoxifen-treated breast cancer patients into groups of low-, intermediate- or high-risk recurrence. It is the most widely used prognostic assay for ER-positive cancers in the United States. • MapQuant DxTM Genomic Grade Index (Ipsogen, France) [Sotiriou 2006] is
a microarray-based 97-gene assay for reclassifying histologically intermediate-grade ER-positive cancers into high or low molecular intermediate-grade with significantly different prognosis.
• Breast Cancer IndexSM (BioTheranostics, San Diego, CA, USA) [Ma 2008]
is comprised of two signatures, a 5-gene molecular grade index and the ratio of two independent biomarkers HOXB13:IL17BR, and can assess the risk of distant recurrence in ER-positive, lymph node-negative breast cancers. • EndoPredict R (Sividon Diagnostics GmbH, Koln, Germany) [Filipits 2011] is
a 11-gene signature for stratifying patients with ER-positive cancer into high or low risk of recurrence if treated with adjuvant endocrine therapy alone.
5
See for referencehttp://www.breastcancer.org/symptoms/testing/types.
6Indications for ordering an assay can vary in accordance with the clearance issued by the country of application.
More details about these signatures are found in [Győrffy 2015]. Notably, another rather famous 76-gene signature (Veridex LLC, a Johnson & Johnson company, San Diego, CA, USA) [Wang 2005a] could be used to predict the development of distant metastases within 5 years in lymph node-negative primary breast cancer patients (irrespective of age and tumor size) who did not receive systemic treatment, which was later confirmed in multiple independent studies on patient data obtained from different institutions [Foekens 2006,Desmedt 2007,Zhang 2009].
1.3
Genomic Data Analysis: Topics, Prospects and
Chal-lenges
In order to study the substantial amount of genomic data available for medical research, the use of computational tools such as machine learning has become a popular trend [Barillot 2012]. In fact, machine learning is particularly suitable for analyzing genomic data by developing algorithms or building models to dis-cover unseen patterns, identify complex relationships and predict for phenotypic phenomenon of interest. While genomic data analysis of cancer is a research field encompassing a broad range of topics, the present thesis is specifically devoted to breast cancer prognosis and related biomarker discovery.
Molecular Prognosis
In the language of machine learning, cancer prognosis is usually formulated as
pre-dictive modeling (or discriminative modeling succeeding supervised learning). In
fact, an extensive body of findings in the genre of genomic data analysis are in-ferred from empirical evidence of relationship between the genomic features and the survival information collected over large population of patients. Given a set of
m observations D := {(x1, y1), . . . , (xm, ym)}, where xi ∈ X denotes the feature vec-tor of the i-th sample, typically the expression measurements of n genes (or i-th row in Figure 1.17) in gene expression data analysis when X = Rn, and yi ∈ Y denotes the outcome of the i-th sample, typically the survival time when Y = R × {0, 1} of (positive) survival observation with a right-censoring flag, or the prognostic group when Y = {1, . . . , K} of K ≥ 2 groups categorized by thresholding the observed survival time, the objective is then to infer a predictive function h : X → Y which can then be used to predict survival risk or classify prognostic group for any new sample. These two learning tasks are termed respectively as survival analysis and
classification in machine learning literature.
Survival analysis is generally referred to a set of methods for analyzing data where the outcome variable is the time until the occurrence of an event of interest, hereby referring to the survival time when Y = R × {0, 1}. In clinical management of cancer, patients are usually followed for a specified time period and the focus is
7Probes are hybridization fragments of DNA, therefore probe-specific measurements in microar-ray data usually need post-processing to estimate gene-specific measurements.
on the time at which the event of interest occurs such as metastasis, recurrence or death. If the event had occurred during the follow-up, the survival time is docu-mented by the observed time to event; if the event had not occurred by the end of the follow-up (or the patient dropped out of the study), the event had not yet been observed and the survival time is documented by the follow-up (or drop-out) time with a flag, meaning that survival time can only be considered at least as long as the duration of follow-up. A survival observation is called right-censored if it is in-complete as in the latter case. Survival time is therefore a variable consisting of two components: the documented survival time (usually measured in days) and a right-censoring flag indicating whether the survival is exact or lower-bounded, leading to Y = R × {0, 1} in survival analysis. A number of methods are available in litera-ture to analyze the relationship of the fealitera-ture vector with the survival time, among which two are worth special mention. The Kaplan-Meier method [Kaplan 1958] is a nonparametric estimator and graphical method of depicting survival probabilities as a function of time. It is widely used to obtain descriptive statistics for sur-vival observations that can be further combined with statistical tests to compare the survival experience for two or more groups of patients8. The Cox proportional
hazards model [Cox 1972] is a popular regression model for analyzing survival data that builds an easily interpretable model associating the relationship of the survival hazards to predictive features in order to describe the likely course of outcome. For a textbook-oriented overview of survival analysis, see [Hosmer 1999].
Classification is another classical topic in machine learning and statistics where the outcome variable belongs to one of a few predetermined categories, specifi-cally Y == {1, . . . , K} representing K ≥ 2 prognostic groups. Based on their clinical records of survival time, cancer patients can be categorized into high-risk and low-risk (and sometimes a third intermediate-risk) groups typically by bina-rizing the continuous survival time at a 5-year threshold. In fact, deployment of cancer treatment usually relies on such manageable categorization of patients into prognostic groups. Compared to survival analysis, classification bypasses the dif-ficulty in accurately depicting the course of survival outcome but instead seeks a coarse yet clinically meaningful description of survival outcome. Popular classifica-tion methods include Fisher’s linear discriminant [Fisher 1936], logistic regression
[Cox 1958], decision trees [Breiman 1984], Support Vector Machines [Cortes 1995],
Random Forests [Breiman 2001], Gradient Boosting Machines [Friedman 2001], see
[Hastie 2009] for details and many other algorithms for classification.
Biomarker Discovery
The predictive modeling framework discussed above assumes that a representation of all sample vectors consisting of n genomic features is already determined and will be included in building a predictive model. In the era where we have easy access to thousands up to millions of genomic features for a biological sample albeit most
8Patients are usually grouped by molecular subtypes typically by clustering approaches based on their genomic features.
of which can be irrelevant or redundant for the inference task under consideration, it is crucial to determine which features to be incorporated in the model, a ques-tion usually termed as feature selecques-tion in machine learning or biomarker discovery in computational biology. On one hand, inferring a predictive model with a large number of features from a relatively small number of samples, which is usually the case in biomedical applications, is essentially difficult from the viewpoint of sta-tistical inference, a phenomenon referred to as the curse of dimensionality, which often leads to unreliable models that overfit the observed samples and generalize poorly when used to predict for future samples. Reducing the number of features representing each sample by selecting only a few important features has proven an efficient way to limit this difficulty.9 On another hand, the identification of a few in-formative genomic features helps suggest discerning interpretation and key insights into molecular cancer biology. Further, a few identified biomarkers can facilitate the design of more affordable prognostic gene signatures as it is still cheaper and faster to measure the activity of a few targeted genes nowadays.
Many feature selection techniques exist and are organized into three categories, depending on how they are combined with the construction of the predictive model: filter methods, wrapper methods and embedded methods. (Univariate) filter meth-ods select a list of relevant features from the entire feature set independent from the predictive models used, by assessing the relevance of each feature to the response of interest with an importance score, typically by applying some statistical test such as χ2-test or calculating some information measure univariately such as Information Gain [Xing 2001], and removing those low-scoring ones. Being the computationally fastest methods, filter methods can easily scale to a large number of features and accommodate any predictive model, whereas they usually ignore the interaction between features and special attributes of the predictive model considered. Taking into account the dependencies between features and the hypothesis of the predictive model, wrapper methods aim to directly find the best combination of features by evaluating all possible feature subsets as input to the model and picking the one with which the resulting model performs the best. Due to the fact that the space of feature subsets grows exponentially with the number of features, exhaustive search over the full space of feature subsets is in general computationally impossible, and hence heuristic or greedy algorithms are often adopted to guide the search for a sat-isfactory candidate of feature subset. Popular wrapper methods include simulated annealing [Kirkpatrick 1983] and sequential elimination such as stepwise regression
[Hocking 1976]. Embedded methods enable feature selection during the process
of constructing a predictive model, and as these methods are usually tailored to each specific model utilized, they are therefore far less computationally intensive than wrapper methods. Popular embedded methods include a wealth of regular-ization methods such as the lasso [Hastie 2015] and recursive feature elimination
9
Besides feature selection, another efficient approach of dimensionality reduction is via feature extraction such as principal component analysis. While feature selection finds a subset of informa-tive features as is without altering the original representation of data, feature extraction transforms the data in the high-dimensional feature space to a space of lower dimension.
embedded in Support Vector Machines [Guyon 2002]. For an overview of feature selection methods, see [Guyon 2003,Li 2016] for an introductory review from the methodological viewpoint of machine learning and [Saeys 2007, Hira 2015] with a particular emphasis on applications in bioinformatics.
Prospects and Challenges
While survival analysis, classification and feature selection are themselves exten-sively studied and still active research areas of machine learning research, their applications in genomic data analysis are a particularly demanding task. In fact, it has been widely recognized as a challenging problem to extract potentially valuable information from genomic data for reasons of multiple folds. To start with, cancer is intrinsically a highly complex disease and consequently the heterogeneity underlying cancer patients renders inevitable obstacle in analyzing cancer data, in other words, high-throughput experimental data are noisy by nature leading to a decline in the informativeness of such data. In addition, from the viewpoint of machine learning, a relatively small number of clinical samples (typically at the scale of 102 ∼ 103)
versus a large number of genomic features (typically at the scale of 103∼ 106) adds
difficulty in making reliable inference from analyzing observed samples that could generalize well to future samples and in identifying prognostic biomarkers reusable for future patients. Another major concern specially regarding biomarker discovery is the a posteriori interpretation of the computational findings in terms of biological relevance to the mechanism of cancer. To address the challenges in genomic data analysis, there is a pressing need for bioinformatics-oriented methods built upon state-of-the-art machine learning algorithms as a stepping stone.
Despite the computational challenges confronted by machine learning appli-cations in cancer prognosis, many success stories are prominent. For example, the above-mentioned PAM50 test, the 50-gene classifier for subtyping breast can-cer, is constructed upon a learning algorithm called the nearest shrunken cen-troid method [Tibshirani 2002]. Another example comes from the DREAM 7 —
Sage Bionetworks–DREAM Breast Cancer Prognosis Challenge [Margolin 2013], a
competition-based crowd-source effort that systematically assessed and confirmed the potential of computational models designed to predict breast cancer survival by combining various types of molecular features with standard clinico-pathological parameters to improve prognosis performance (Figure 1.2) [Bilal 2013]. Notably, the best-performing model of the competition [Cheng 2013b] was built upon, in addition to clinico-pathological features, such molecular features called attractor
metagenes that are pan-cancer signatures of coexpressed genes previously
identi-fied in rich gene expression datasets by an iterative attractor-finding algorithm
[Cheng 2013a]. For a recent survey on machine learning applications in cancer
prog-nosis, see [Kourou 2015]. Worth special mention are two lines of ideas to address the difficulty in cancer prognosis and biomarker discovery, which have primarily motivated the work presented in this thesis.
Figure 1.2: This figure from [Bilal 2013, Figure 2] illustrates that the best performer among submissions to the pilot competition uses a combination of clinical and molecular features that are deliberately selected subject to prior knowledge (the MPC category). Models submitted are categorized by the type of features they use: only clinical features (C), only molecular features (M), molecular and clinical features (MC), molecular features selected using prior knowledge (MP), molecular features selected using prior knowledge and clinical features (MPC).
to high measurement noise, the ranking of the expression levels of multiple genes are presumably more robust predictors, in the sense that they can be less sensitive to noise, than their real-valued measurements. This can be particularly beneficial in many biomedical applications when the informativeness (or signal-to-noise ra-tio) in data is low. Pioneering the exploration of these ideas is the top scoring pairs (TSP) [Geman 2004], an algorithm for classifying gene expression profiles by pairwise microarray comparison, together with successive extensions and further investigations by [Tan 2005, Xu 2005, Lin 2009]. These methods generate simple and accurate decision rules to discriminate cancer samples from normal ones based on the relative reversals of pairwise ordering comparing the expression of a few genes. However, when it comes to biomedical classification on difficult tasks such as cancer prognosis that usually involves the collaborative functional activities of a relatively large number of gene, the performance of TSP-family classifiers degrades drastically, probably due to the naively simple majority voting scheme adopted by those classifiers. In order to improve cancer outcome prediction, many studies em-ployed TSP algorithm as a feature selection technique that is further embedded into more complex classification methods such as Support Vector Machines [Shi 2011] or decision trees [Czajkowski 2011] in microarry data analysis.
Cancer is a “network disease”. In fact, it has already been quoted above that cancer is a genetic disease. As more and more cancer-related genes were iden-tified and arranged into signaling pathways through which they act, it became apparent that these pathways are interconnected and present crossroads at
differ-ent levels [Vogelstein 2004], indicating that tumor progression is the consequence of network-level dysregulation of interactions between genes, RNAs, proteins and other molecules that control at least the hallmarks of cancer [Hanahan 2011]. More-over, biological networks, including protein-protein interaction, coexpression and regulatory networks, or metabolic and signaling pathways, are a common way of depicting functional relationships between genes that have been accumulated from decades of biomedical research, and they can be potentially valuable when incorporated as domain-specific knowledge during the process of the computa-tional analysis of genomic data so as to, for instance, improve stability and in-terpretability of biomarker discovery (Figure 1.3). Approaches to pathway and network analysis techniques range broadly, including gene set enrichment analy-sis that identifies genes of interest appearing in pathways more frequently than expected by chance [Subramanian 2005], network modeling that infers the activ-ities and interactions of various genetic components in pathway or networks, see for instance [Tarca 2008, Drier 2013, Vandin 2011, Hidalgo 2017], network-guided predictive modeling that consults the structure of a priori known network and constrains the predictive modeling procedures discussed above so that the “ideal” model or biomarkers selected should be coherent with the network, see for instance
[Li 2010, Rapaport 2007, Jacob 2009]. For a recent review of pathway and
net-work analysis of cancer genomes, see [Creixell 2015] with a focus on approaches applied to somatic single nucleotide variants (SNVs) and altered RNA expression and [Azencott 2016] with a particular emphasis on biomarker discovery.
1.4
Contribution of the Thesis
The thesis work is conceived following the two lines of ideas intended to address two major questions from the methodological standpoint of machine learning: rank-based approaches for improved molecular prognosis and network-guided approaches for enhanced biomarker discovery. Furthermore, despite their biomedical applica-tion in cancer prognosis to which this thesis is largely devoted, the methodologies developed and investigated in this thesis, pertaining respectively to learning with rank data and learning on graphs, have a significant contribution to several branches of machine learning, concerning applications across but not limited to cancer biology and social choice theory. This thesis will be organized by projects, each presented in one chapter.
Rank-based Approaches for Improved Molecular Prognosis
The first line of ideas is to perform gene expression data analysis based on exploiting exclusively the ranking of the expression levels of multiple genes while their real-valued measurements are disregarded, which integrates the idea of relative reversals of pairwise ordering inherited from TSP-family classifiers in the paradigm of kernel learning. From the point view of machine learning, the problem reduces to the study of a particular type of structured data, specifically rankings. It is well-known that
Figure 1.3: This figure from [Rapaport 2007, Figure 3] illustrates an example of metabolic pathways, mapped by coefficients of the decision function obtained by applying a network-free model (left) and a network-guided model (right) in color, positive in red and negative in green with intensities reflecting absolute values, where some large highly connected func-tional parts of the network with annotations such as proteinkinases and DNA and RNA polymerase subunits were identified by the network-guided model, rendering readily avail-able interpretability of the involvement of the selected genes in cancer.
kernel methods have found many successful applications where the input data are discrete or structured including strings and graphs [Gärtner 2004]. The first project of my doctoral studies was focused on proposing computationally attractive kernels for rank data and applying kernel methods to problems involving rankings. Central to this work was the observation that the widely used Kendall tau correlation and the Mallows similarity measure are indeed positive definite kernels for total rankings. These kernels were further tailored to more complex types of rank data that prevail in real-world applications, especially uncertain rankings which are converted from real-valued vectors by keeping simply the relative ordering of the values of multiple features thereof. Thanks to these kernels, many off-the-shelf kernel machines are available to solve various problems at hand [Shawe-Taylor 2004,Schölkopf 2004]. It is worth special mention that, despite that the project was initially motivated by biomedical applications, the prospective contribution of this work concerns appli-cations from many fields of machine learning pertaining to learning from rankings, or learning to rank. This study will be presented in Chapter 2.
The study of the Kendall kernel for rankings has paved an unprecedented way towards a deeper understanding of a classical problem called Kemeny aggregation
[Kemeny 1959] from the field of social choice theory. Kemeny aggregation searches
for a consensus ranking that best represents a collection of individual rankings in the sense that the sum of the Kendall tau distance between each ranking and the consensus is minimized. Although Kemeny aggregation is often considered to provide the “golden” solution among all ranking aggregation criteria, the Kemeny consensus is known to be NP-hard to find [Bartholdi III 1989]. Many tractable approximations to the Kemeny consensus have therefore been proposed and exten-sively studied, see for instance [Ali 2012]. Since the Kendall kernel derives from an inner product of a Euclidean space, the Kendall tau distance derives from a squared Euclidean distance. As a result, the combinatorial problem of Kemeny aggregation is endowed with an intuitive interpretation from a geometric point of view. Based on this observation, a tractable upper bound of the estimation error in terms of the distance between the exact Kemeny consensus and an approximate solution is established. This upper bound requires little assumption on the approximation pro-cedure or the collection of rankings to aggregate. Due to its remote connection to cancer prognosis or the primary objective of this thesis, this study will be presented in AppendixA.
Network-guided Approaches for Enhanced Biomarker Discovery
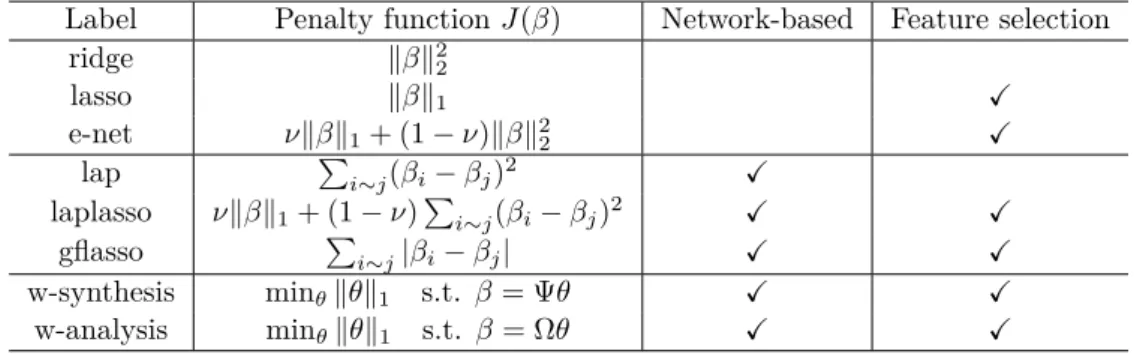
The second line of ideas of performing genomic data analysis for cancer prognosis is to consult biological networks as prior knowledge in order to improve the selection efficacy of molecular features. Two projects were initiated on network-guided analy-sis of genomic data for suggesting candidate biomarkers related to cancer prognoanaly-sis. In one project, we focused on the study of structured regularization in gen-eralized linear models [McCullagh 1989] and the Cox proportional hazards model
the biological network are encouraged to be selected simultaneously as candidate biomarkers. In fact, in order to achieve simultaneous modularity and sparsity coher-ent with the presumed network structure, a popular method called network-based wavelet smoothing has been successfully applied in many applications from the field of signal processing [Shuman 2013]. Therefore, we were intrigued to investigate the potential of this method in survival analysis of breast cancer with a gene expression dataset guided by a protein-protein interaction network, albeit the methodology is generally applicable to various types of genomic data and biological networks. In particular, the method allows to designate genes as candidates for biomarkers in form of gene modules with intra-collaborative functionality rendering readily inter-pretable insights related to cancer survival. Numerical results demonstrated that, compared to several network-free and some established network-based regulariza-tion methods, network-based wavelet smoothing was able to improve the selecregulariza-tion efficacy of genes related to cancer survival in terms of stability, connectivity and interpretability, while achieving competitive performance of survival risk prediction. This study will be presented in Chapter 3.
In another project, we focused on a particular type of biological network namely signaling pathway network. Based on a modeling framework of cell signaling pro-posed by [Hidalgo 2017], gene expression profiles can be translated into personalized profiles of signaling pathway activities by integrating known signaling pathways. When gene-level profiles are replaced by these derived pathway-level profiles as input to many off-the-shelf computational tools, a simple scheme emerges where gene-level analysis is easily promoted to pathway-level analysis of gene expression data. The advantage is remarkable in that, when combined with feature selection methods, the proposed scheme enables direct identification of pathway-level mech-anistic signatures as an alternative to conventional gene-based signatures, which provides more informative insights into the cellular functions and biological pro-cesses involved in cancer. This study will be presented in Chapter 4.
Other Contributions
During the course of my doctoral studies, I have undertaken some other projects as well. In 2013, Elsa Bernard, Erwan Scornet, Véronique Stoven, Thomas Wal-ter, Jean-Philippe Vert from our laboratory and I participated in the DREAM
8 NIEHS–NCATS–UNC Toxicogenetics Challenge, an international bioinformatics
competition where participants were asked to predict the response of human cell lines exposed to various toxic chemical compounds based on the molecular charac-terization of chemicals and the transcriptome of cell lines. Finally our team won second place with a kernel bilinear regression model. Oral presentation was accepted to NIPS Workshop on Machine Learning in Computational Biology (MLCB) and later invited to RECOMB Conference on Regulatory and Systems Genomics. This work has been accepted for publication in [Bernard 2017] and it has also been pub-lished as part of the crowd-source collaboration as a result of the competition in
that it was not well polished by the time of drafting the manuscript.
During my internship at Roche Diagnostics GmbH, Penzberg, Germany, I worked on failure state prediction for automated analyzers for analyzing biological samples in collaboration with Jean-Philippe Vert, Fabian Heinemann, Sven Dahlmanns and Stefan Kobel, and a European patent regarding the application was filed by Roche Diagnostics GmbH, F. Hoffmann–La Roche AG in December 2016 and is currently pending approval [Jiao 2016c]. Due to corporate confidentiality policies, this study will not be included in this thesis.
![Figure 1.1: This image from [ Commons 2017 ] illustrates an example of gene expression](https://thumb-eu.123doks.com/thumbv2/123doknet/2871266.72209/28.892.235.723.406.893/figure-image-commons-illustrates-example-gene-expression.webp)