Simulation
by
Chunping ZHANG
MANUSCRIPT-BASED THESIS PRESENTED TO ÉCOLE DE
TECHNOLOGIE SUPÉRIEURE IN PARTIAL FULFILLMENT OF THE
REQUIREMENTS FOR THE DEGREE OF DOCTOR OF PHILOSOPHY
PH.D.
MONTREAL, FEBRUARY 21
ST2020
ÉCOLE DE TECHNOLOGIE SUPÉRIEURE
UNIVERSITÉ DU QUÉBEC
This Creative Commons licence allows readers to download this work and share it with others as long as the author is credited. The content of this work can’t be modified in any way or used commercially.
BY THE FOLLOWING BOARD OF EXAMINERS
Prof. Mohammad Jahazi, Thesis Supervisor
Department of Mechanical Engineering at École de technologie supérieure Prof. Claudiane Ouellet-Plamondon, President of the Board of Examiners Department Construction Engineering at École de technologie supérieure Prof. Vincent Demers, Member of the Jury
Department of Mechanical Engineering at École de technologie supérieure Prof. Jun Song, External Independent Member of the Jury
Department of Materials Engineering at McGill University Prof. Mamoun Medraj, External Evaluator
Department of Mechanical Engineering at Concordia University
THIS THESIS WAS PRENSENTED AND DEFENDED
IN THE PRESENCE OF A BOARD OF EXAMINERS AND PUBLIC JANUARY 30TH 2020
First and foremost, I would like to express my sincere appreciation to my supervisor, Prof. Mohammad Jahazi. His invaluable guidance and counselling, his continuous encouragement and support, all these were motivational for me, especially during the tough times in the PhD pursuit. His patience and positive attitude made this project a very enjoyable learning experience. His spirit of complete devotion to science career, his humor, his kindness and his caring of others set an example for my future lifelong journey. Particularly, I owe many thanks to him for his advices and help in my life throughout the years of study.
I would also wish to thank the jury members, Prof. Mamoun Medraj, Prof. Vincent Demers and Prof. Claudiane Ouellet-Plamondon. I am very grateful for them to give me valuable advices during DGA 1033 oral exam regarding the expertise, experimental design and simulation techniques.
I appreciate the financial support provided by the Natural Sciences and Engineering Research Council (NSERC) of Canada in the form of a Collaborative Research and Development Grant (CRDG) under number 470174.
I’d like to express my acknowledgement to Finkl Steel, the sponsor company of the practical industrial project. I’m very grateful for its support on experimentations regarding the ingot casting, the measurement of temperature profiles on the mold outside surface, the cutting, grinding, macroetching and conservation of samples, the characterization of chemical and macrostructural profiles on specified sections. Particular thanks to three engineers in the company, Mr. Rami Tremblay, Ms. Haikouhi Melkonyan, and Ms. Paloma Isabel Gallego, for their help in search for castings, samples, available laboratory facilities and all the relevant arrangements and documents.
I would also extend my appreciations to the members of the CM2P group. The group has been the source of valuable advices, collaboration, inspiration and friendship. Particular thanks go to Dr. Abdelhalim Loucif for his valuable comments and advices on the design in experimental planning and on the redaction of articles, and also for his consistent kindness
and help in my work and life. We worked together on the experimentations and simulations and I appreciate his enthusiasm, attentiveness, carefulness, diligence and amazing ability. Great thanks go to Dr. Mahammad Saadati for training me on SEM and EBSD machine. Many thanks go to Dr. Davood Shahriari for his help in the first stage of the establishment of the FEM models, in the measurement of temperature profiles during casting and in the performance of tension and solidification tests using thermomechanical simulators. It was my pleasure to work with all these experts during my PhD pursuit.
My utmost gratitude goes to my parents Mr. Dongmin Zhang, Ms. Shuhua Yuan and my brothers, Mr. Zhigang Zhang and Mr. Zhiqiang Zhang, for their consistent support and love throughout my study.
Ultimately, I’m deeply indebted to my husband, Mr. Weimin Liu, and my son, Mr. Qikai Liu. Their unconditional love, unparalleled motivation, consistent encouragement and complete understanding enabled me to concentrate and focus on my work and make the PhD pursuit a possible journey.
Chunping ZHANG
RÉSUMÉ
Ce projet vise à développer un modèle numérique fiable qui peut prédire la sévérité et l'étendue de la macroségrégation dans un lingot de 40 tonnes métriques d’acier au carbone faiblement allié à haute résistance mécanique, ainsi que leurs changements en fonction des paramètres du processus de coulée, en vue de minimiser ce défaut important.
Pour atteindre cet objective, le code commercial d'éléments finis, Thercast®, était d'abord
choisi pour le déroulement des simulations. Cette décision a été prise sur la base d'un examen critique de la littérature concernant les techniques de modélisation qui sont apparues ces soixante dernières années, sur la puissante capacité de ce logiciel, et aussi sur son fonctionnement de modélisations tridimensionnelles du remplissage et de la solidification à l'aide d’un modèle biphasé solide-liquide.
Dans un premier temps, les éléments susceptibles d’introduire l'incertitude ont été éliminés du modèle. Par exemple, un modèle 3-D axisymétrique un 24ème de la totalité du système du moulage a été considéré suffisamment représentatif pour l’exécution des simulations dans ce projet. Une taille moyenne de cellules de 35 mm a été définie pour la discrétisation du modèle, sur la base de la détermination des conditions d’équilibre entre précision et temps de calcul et aux études de sensibilité préliminaire. Les conditions limites du modèle ont été mises en place par les pratiques industrielles, qui ont pris en compte non seulement les conditions locales et les échanges thermiques entre l’acier et les composants du moule, mais aussi les échanges mutuels entre eux.
Les paramètres dépendants de la température des matériaux concernés, reflétant les comportements thermodynamiques, thermomécaniques et thermodiffusion, ont été déterminés par voie du logiciel Thermo-Calc®, de la littérature, des équations empiriques, de
la base de données du logiciel Thercast®, de l’industrie, des calculs théoriques, ainsi que des
essais de traction réalisés en laboratoire à différente température. L’applicabilité des logiciels et des équations a été vérifiée auparavant. La planification expérimentale a été basée sur des essais de simulation.
La loi de mélange s’est avérée une bonne approximation pour représenter la microségrégation et décrire le comportement physique du lingot de l’acier, après les examens comparatifs sur différents schémas de microségrégation. Le modèle thermomécanique a été pris comme formulation de base pour les études paramétriques subséquents en termes de l’influence du retrait thermomécanique et des aspects expérimentaux.
Par la suite, le comportement de solidification à a variation des paramètres du processus de moulage, tel que la vitesse de remplissage, la température surchauffe de fusion et la température de départ du moule, à l'aide du modèle fiable qui a été établi. Les trois
paramètres faisaient l'objet d’étude du fait de la manque de données pertinentes dans la littérature. Les variables étudiées concernaient les vitesses de remplissage de 0.084, 0.107, 0.145 m/min (avec une durée de remplissage de 38, 30, 22 min), les températures surchauffes de fusion de 75, 65, 55 °C et les températures de départ du moule de 50, 120, 250 °C. Ces paramètres de coulée formaient les conditions les plus fréquentes dans l'industrie pendant la coulée des lingots de grande taille.
Les résultats de cette étude ont permis de démontrer qu’une réduction du temps de remplissage, une surchauffe plus basse et un moule initialement plus froid peuvent contribuer à la diminution de l'intensité de macroségrégation, dans la portion supérieure du lingot, le long de l'axe de la pièce et dans la région centre/périphérie enrichie du soluté. Ces effets ont été associés aux courants du liquide, induits par l'opération de coulage, par la convection, par la déformation thermomécanique des phases, et par la variation du gradient de température et des vitesses de solidification. Les prévisions de tous les cas étudiés ont été validées par des données de laboratoire, telles que les structures macro et microscopiques, la distribution des concentrations de solutés, les modifications dimensionnelles du casting et les variations de la température sur la face extérieure du moule.
Les résultats recueillis favoriseront une meilleure compréhension des mécanismes sous-jacents à l’origine de la formation de macroségrégation dans le processus de la coulée. Ils pourraient être utiles pour la conception du processus de coulée d’un lingot donné. Ils peuvent servir à l'industrie pour améliorer la qualité du lingot de grande taille et la productivité des aciers à grande valeur ajoutée, qui sont susceptibles de macroségrégation.
Chunping ZHANG
ABSTRACT
The present project aims to develop a reliable numerical model to predict the extent and severity of macrosegregation in a 40MT (metric ton) medium-carbon high strength steel ingot as a function of casting parameters with the view to minimize the occurrence of the macro-scale defect. For this purpose, the commercial finite element modeling (FEM) code Thercast® was at first determined to be used for the simulation work. This basis of such a
decision rested on the critical literature review on the evolution of solidification modeling technique in the past 60 years, the powerful computing capability of the software and its performance of the three-dimensional simulations of mold filling and solidification based on a volume-averaged solid-liquid two-phase model.
The factors influencing model accuracies were eliminated one by one. For instance, an axisymmetric model in the dimension of 1/24 of the actual casting system was determined to be representative enough for the necessary simulation work. An average general cell size of 35 mm was identified to be the discretization parameter for its realization of the compromise between computational accuracy and efficiency based on series of sensitivity studies of solidification to mesh size. Modeling boundary conditions were set based on industrial practice, which took into account the local friction and the thermal exchange between the steel and the mold components, as well as the mutual exchange between mold components themselves in the casting system. Input temperature-dependent parameters of all concerned materials, reflecting their thermodynamic, thermomechanic and thermodiffusion behaviors, were identified by means of combined approaches of computational thermodynamics program Thermo-Calc® software, literature reports, published empirical equations, Thercast®
software material database, industry sources, theoretic calculations, as well as room and high temperature tension tests in laboratory. The applicability of the used softwares and models was verified before applying them to the investigated steel. The experimental planning was strictly formulated based on simulation tests. Lever rule microsegregation model was ascertained to be the most reasonable depiction of the physical behavior of the steel in study in large-size cast ingot. This selection was made after comparative examinations of various microsegregation schemes against experimental measurements, together with subsequent adoption to the regions formed in different stages of the solidification process. A thermomechanical model was finally deemed as the baseline formulation for all the parametric studies in terms of the impact study of thermomechanical shrinkage on macrosegregation and its reproductions of experimental findings.
The dependence of the solidification behavior on the variations of filling rate, melt superheat and initial mold temperature was then investigated, respectively, using the established reliable model. The three casting control parameters were selected due to the shortness or confliction of relevant data in the literature, as well as the complication, high-cost or
impossibility of the employment of other macrosegregation control techniques. The studied casting variables included the filling rates of 0.084, 0.107 and 0.145 m/min (with filling times of 38, 30 and 22 min), the initial melt superheats of 75, 65 and 55 °C, the initial mold temperatures of 50, 120 and 250 °C. These casting parameters represented the conditions the most commonly encountered in industry during casting of large size ingot. The results indicated that a quicker filling operation, a lower melt superheat and a colder mold condition tended to decrease the macrosegregation intensity in the upper section of the casting, along the centerline, and in the mid-radius solute-enriched bands. The alleviation effect was associated with the changes in flows induced by pouring jet, thermosolutal convection, thermomechanical deformation of the phases, along with the variations of the temperature gradient in the casting and the solidification speed. The predictions of the studied cases were verified with experimental characterizations on the macro-/micro-structures, solutal distributions, dimensional change of the casting and the temperature variations on mold outside surface.
The findings in the dissertation allow for a better understanding of the underlying mechanisms responsible for the occurrence of macrosegregation in ingot casting process. They should also be helpful for the casting process design of a given ingot and could be used in industry to improve the quality of large size ingot production and the productivity of high value-added steels or other alloys which are prone to macrosegregation.
TABLE OF CONTENTS
Page
INTRODUCTION ...1
PROJECT CONTEXT AND DEFINITION ...5
1.1 Macrosegregation ...6
1.2 Measures to control macrosegregation ...8
1.3 Macrosegregation modeling ...12
1.3.1 Development of solidification modeling ... 14
1.3.2 Model uncertainties ... 23
1.4 Project definition and methodology ...26
1.4.1 Experimental work ... 29
1.4.2 FEM model establishment ... 31
1.4.3 Application of established model ... 33
PRILIMINARY MODLE ESTABLISHEMENT ...35
2.1 Model constitutive algorithm ...35
2.2 Determination of model geometry ...41
2.3 Determination of mesh ...44
2.4 Determination of material properties ...50
2.4.1 Steel thermodynamic properties ... 50
2.4.2 Steel thermomechanical properties ... 52
2.4.3 Steel thermodiffusion properties ... 58
2.4.4 Other parameters ... 59
ARTICLE 1 ON THE IMPACT OF MICROSEGREGATION MODEL ON THE THERMOPHYSICAL AND SOLIDIFICATION BEHAVIORS OF A LARGE SIZE STEEL INGOT ...61
3.1 Abstract ...61
3.2 Introduction ...62
3.3 Microsegregation models ...64
3.4 Material and methods ...67
3.4.1 Experimental and modeling processes ... 67
3.4.2 Determination of Fourier number α ... 69
3.4.3 Determination of thermodynamic properties ... 70
3.5 Results and discussions ...71
3.5.1 SDAS and back-diffusion parameter ... 71
3.5.2 Impact of microsegregation model on thermophysical properties ... 73
3.5.3 Impact of microsegregation model on solidification behavior ... 79
3.6 Conclusions ...87
3.7 Author contributions ...87
3.8 Funding ...88
3.10 Conflicts of interest ...88
ARTICLE 2 INFLUENCE OF THERMOMECHANICAL SHRINKAGE ON MACROSEGREGATION DURING SOLIDIFICATION OF A LARGE-SIZED HIGH-STRENGTH STEEL INGOT ...89
4.1 Abstract ...89
4.2 Introduction ...90
4.3 Experimental setup, process and model geometry ...92
4.4 Mathematical formulation ...95
4.5 Determination of material properties ...96
4.5.1 Steel thermodynamic properties ... 97
4.5.2 Steel thermomechanical properties ... 98
4.5.3 Steel thermodiffusion properties ... 98
4.5.4 Other parameters ... 101
4.6 Results and discussions ...102
4.6.1 Top shrinkage and air-gap formation ... 102
4.6.2 Temperature gradient ... 105
4.6.3 Liquid fraction and solidification time ... 107
4.6.4 Macrosegregation pattern ... 109
4.6.5 Validation of models ... 111
4.7 Conclusions ...115
4.8 Acknowledgements ...116
ARTICLE 3 ON THE EFFECT OF FILLING RATE ON POSITIVE MACROSEGREGATION PATTERNS IN LARGE SIZE CAST STEEL INGOTS ...119
5.1 Abstract ...119
5.2 Introduction ...120
5.3 Materials and experimental process ...122
5.4 Results and discussions ...123
5.4.1 General macrosegregation patterns ... 123
5.4.2 Effect of filling rate on segregation severity ... 126
5.4.3 Effect of filling rate on fluid flow and solidification time ... 130
5.5 Conclusions ...133
5.6 Author contributions ...134
5.7 Acknowledgments...134
5.8 Conflicts of interest ...134
ARTICLE 4 SIMULATION AND EXPERIMENTAL VALIDATION OF THE IMPACT OF FILLING RATE ON MACROSEGREGATION IN LARGE-SIZE STEEL INGOTS ...135
6.1 Abstract ...135
6.2 Introduction ...136
6.3 Model establishment ...138
6.4.1 Macrosegregation ratio patterns and verification ... 140 6.4.2 Liquid movement ... 144 6.4.3 Solidification speed ... 147 6.4.4 Temperature field ... 150 6.5 Conclusions ...152 6.6 Acknowledgements ...154
ARTICLE 5 SIMULATION AND EXPERIMENTAL VALIDATION OF THE EFFECT OF SUPERHEAT ON MACROSEGREGATION IN LARGE-SIZE STEEL INGOTS ...155
7.1 Abstract ...155
7.2 Introduction ...156
7.3 Model establishment and experimental process ...158
7.4 Results and discussions ...159
7.4.1 Macrosegregation patterns and verification ... 159
7.4.2 Temperature gradient ... 163
7.4.3 Liquid flow and solidification speed ... 166
7.5 Conclusions ...169
7.6 Acknowledgements ...170
7.7 Funding ...170
ARTICLE 6 MACROSEGREGATION IN LARGE-SIZE STEEL INGOTS: MODELIG AND EXPERIMENTAL VALIDATION OF IMPACT OF MOLD INITIAL TEMPERATURE ...171
8.1 Abstract ...171
8.2 Introduction ...172
8.3 Model establishment ...173
8.4 Results and discussions ...174
8.4.1 Macrosegregation pattern ... 174 8.4.2 Temperature field ... 177 8.4.3 Liquid movement ... 182 8.4.4 Solidification speed ... 184 8.5 Conclusions ...187 8.6 Acknowledgements ...188 8.7 Funding ...188 CONCLUSIONS...189 RECOMMENDATIONS ...193
APPENDIX I ARTICLE 7 EFFECT OF SEGREGATED ALLOYING ELEMENTS ON THE HIGH STRENGTH STEEL PROPERTIES: APPLICATION TO THE LARGE SIZE INGOT CASTING SIMULATION 195
AI.1 Abstract ...195
AI.3 Material and methods ...197
AI.4 Results and discussions ...198
AI.4.1 Solidification model description ... 199
AI.4.2 Effect of segregation levels on physical properties ... 201
AI.4.3 Effect of segregation levels on solidification time and temperature gradient ... 203
AI.5 Conclusions ...206
AI.6 Acknowledgements ...206
APPENDIX II ARTICLE 8 EFFECT OF THERMO-PHYSICAL PROPERTIES OF SOLIDIFICATION BEHAVIOR OF LARGE SIZE HIGH STRENGTH STEEL INGOTS ...207
AII.1 Abstract ...207
AII.2 Introduction ...207
AII.3 Microsegregation models ...208
AII.4 Material and methods ...210
AII.5 Results and discussions ...212
AII.5.1 Effect of microsegregation models on solid fraction profiles ... 212
AII.5.2 Effect of microsegregation models on thermophysical properties and solidification behavior ... 214
AII.6 Conclusions ...217
AII.7 Acknowledgement ...218
APPENDIX III ARTICLE 9 INFLUENCE OF NON-UNIFORM TEMPERATURE DISTRIBUTION OF THE MOLD ON SOLIDIFICATION BEHAVIOR IN LARGE SIZE STEEL INGOTS ...219
AIII.1 Abstract ...219
AIII.2 Introduction ...220
AIII.3 Establishment of model...220
AIII.4 Experimental process ...223
AIII.5 Results and discussions ...224
AIII.5.1 Temperature field and solidification speed ... 224
AIII.5.2 Verification of the model ... 232
AIII.6 Conclusions ...234
AIII.7 Acknowledgements ...235
LIST OF TABLES
Page
Table 1-1 Chemical composition of the investigated steel (wt.%)...27
Table 1-2 Ingots fabricated with varied casting parameters for the current project. ..29
Table 2-1 Chemical composition of the steel 25CrMo4 (wt.%). ...43
Table 2-2 Tested models and meshes. ...48
Table 2-3 Thermodiffusion properties for each solutal element. ...59
Table 2-4 Other parameters of the calculation and of the alloys. ...60
Table 3-1 Microsegregation models and equations. ...66
Table 3-2 Chemical composition of the investigated steel and regions (wt.%). ...67
Table 3-3 Calculated parameters for the investigated regions. ...72
Table 4-1 Nominal chemical composition of the studied modified P20 steel (wt.%).93 Table 4-2 Thermodiffusion properties for each solutal element. ...100
Table 4-3 Other parameters of the calculation and of the alloys. ...101
Table 4-4 Nomenclature ...116
LIST OF FIGURES
Page Figure 1.1 Carbon profile on longitudinal section of a 40 metric ton steel ingot
from Finkle Steel with nominal composition of 0.36 wt% C after
reheating and forging ...5 Figure 1.2 Schematic of macrosegregations in large ingots. Positive segregation
is denoted by + symbols (regions enriched in solute) and negative by – (regions depleted in solute) (Pickering, 2013). ...7 Figure 1.3 Schematic of the processes leading to mass transport during ingot
solidification. (a) Convective flows in the interdendritic liquid (+ symbols denote enrichment in solute, whilst - denote depletion (b) Grain sedimentation (more generally solid movement) (c) Liquid flow to feed solidification shrinkage (d) Mushy-zone deformation
(Pickering, 2013)...8 Figure 1.4 Potentially important interactions in modeling solidification in
castings (Pickering, 2013). ...13 Figure 1.5 Schematic of volume element in mushy zone considered when
developing conservation equations (Fleming, 2000). ...15 Figure 1.6 Representation of a grain by an envelope containing a solid skeleton
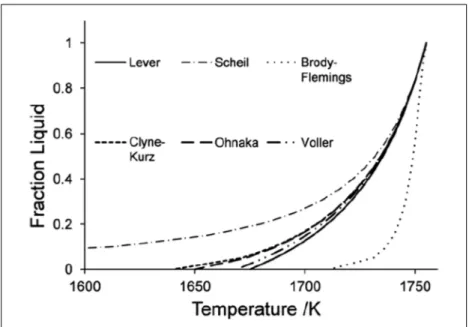
and interdendritic liquid (Taguchi, Miyamura et Soga, 1984). ...19 Figure 1.7 Liquid fraction vs temperature plots for a 0.5C-3Mn-3Mo (wt.%)
alloy using various microsegregation models (Fridberg, Torndahl et
Hillert, 1969). ...25 Figure 1.8 Observed top shrinkage in large size steel ingots. (a) Longitudian
section of a 65 MT steel ignot (Lesoult, 2005) (b) Lognitudian section of the hot-top and upper section of a 40 MT steel ingot from Finkle Steel...26 Figure 1.9 Bottom-pouring casting system, process and the 40MT steel ingot.
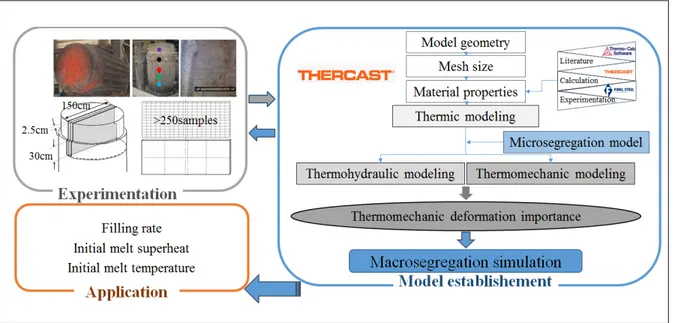
(a) 40MT ingot casting system (b) Bottom-pouring process (c) 40MT steel ingot. ...27 Figure 1.10 Schematic of the works involved in the experimental and modeling
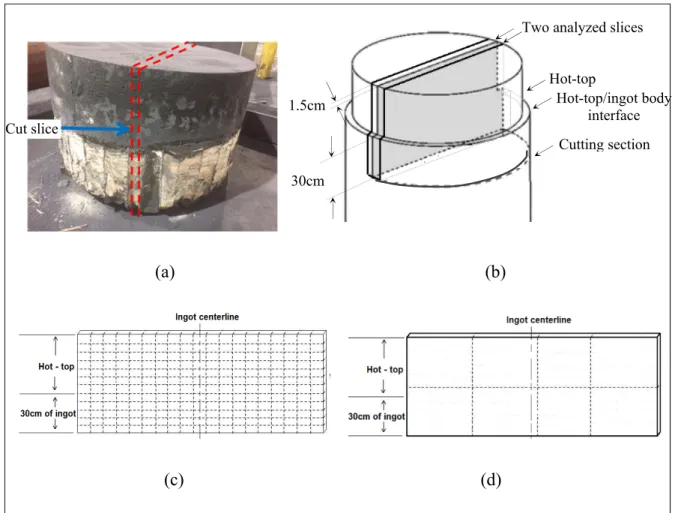
Figure 1.11 Cutting diagram for chemical and macrostructure analysis. (a) Photo of the cut block with the hot-top (with white insulating tiles) and 30 cm top section of the ingot (b) Cutting diagram of the analysed block (c) Slice cut into small samples for chemical characterization (d) Slice cut into large samples for macro etching. ...30 Figure 2.1 360° 3D model established based on actual casting system. (a) Front
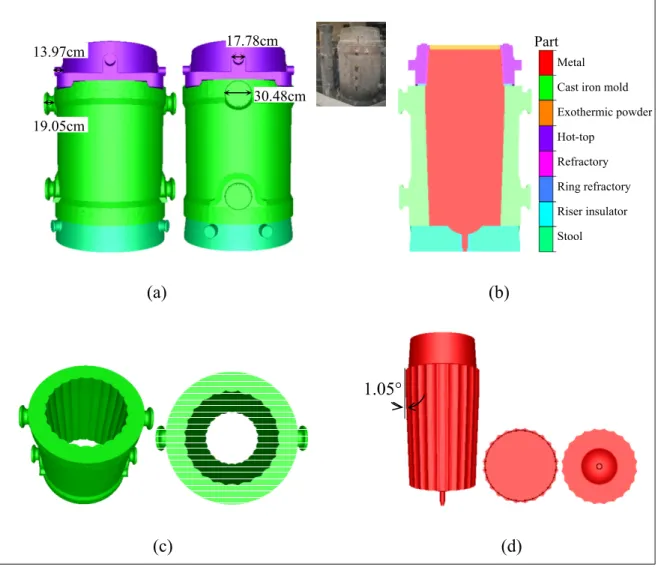
and side views of the entire system (b) Components of the system (c) Big-end-up cast iron mold with 24 corrugations (or flutings) on interior surfaces (d) Cylindrical ingot with 24 flutings on the outside surface as well as top and bottom views. ...42 Figure 2.2 Side and top views of 360° 3D simplied models. (a) Simplified model
with rotational symmetry of order 8 (b) Simplified model with
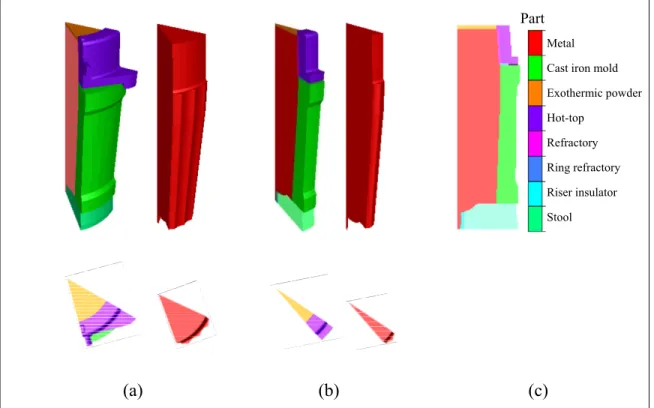
rotational symmetry of order 48. ...43 Figure 2.3 Simplied models to different extents with side and top views of the
casting system and ingot. (a) 1/8 (45°) model (b) 1/24 (15°) model (c) Casting system components. ...44 Figure 2.4 45° model (45M). (a) Mesh image with 31877 elements (15-60 mm
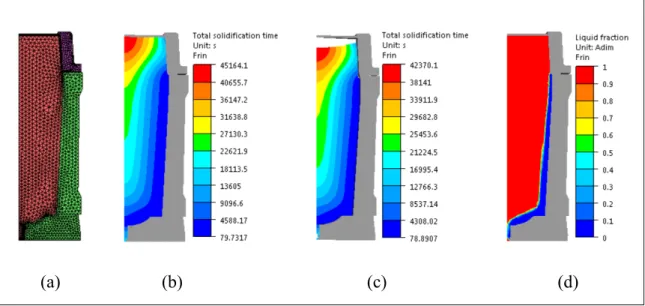
grid size) (b) Predicted total solidification time from thermic calculation (12 h 43 min) (c) Predicted total solidification time from thermomechanic calculation (12 h 18 min) (d) Liquid fraction pattern at the end of filling stage. ...45 Figure 2.5 15° model (15M1). (a) Mesh image with 17626 elements (15-60 mm)
(b) Predicted solidification time in thermic calculation mode (12 h 33 min) (c) Predicted solidification time in thermomechanic calculation mode (11 h 46 min) (d) Liquid fraction pattern at the end of filling stage. ...46 Figure 2.6 Variation of temperature on the mold outside surface for the 45° and
15° models. ...46 Figure 2.7 15°C model with 46872 elements (grid size of 10-40 mm) (15M2).
(a) Mesh image (b) Predicted solidification time with thermic calculation (12 h 52 min) (c) Predicted solidification time with
thermomechanic calculation (11 h 30 min). ...47 Figure 2.8 15° model with 244216 elements (grid size of 8-30) (15M3). (a)
Mesh image (b) Predicted solidification time with thermic calculation (12 h 37 min) (c) Predicted solidification time with thermomechanic calculation (11 h 16 min). ...47
Figure 2.9 Three solidification times predicted by the 15° model with 46872 elements (10-40 mm grid size) (15M2) with macrosegregation simulation of the steel in study in thermomechanic calculation mode. (a)15 h 07 min (b) 15 h 16 min (c) 15 h 13 min. ...49 Figure 2.10 Three solidification times predicted by the 15° model with 244216
elements (8-30 mm grid size) (15M3) with macrosegregation simulation of the studied steel in thermomechanic calculation mode. (a)15 h 38 min (b) 15 h 37min (c) 15 h 33 min. ...49 Figure 2.11 Established model made of different materials. ...50 Figure 2.12 Temperature dependence of thermodynamic parameters of the studied
steel. (a) Solid fraction (b) Density (c) Specific heat capacity (d)
Thermal conductivity coefficient. ...52 Figure 2.13 Source and geometry of tensile specimens for tensile tests. (a)
Segregation ratio pattern of carbon on the longitudinal section of the hot-top and upper section of ingot n° 1 (b) Macrograph of the square region framed in dashed lines in segregation ratio pattern with solute-enriched black A-segregation bands (c) Specimen
geometry for tensile tests according to ASTM A370 standard. ...53 Figure 2.14 Temperature field predicted by macrosegregation simulation for
the steel 25CrMo4 using 15M2 model. ...54 Figure 2.15 Strain rate analyses on the 15° model (15M2) with thermomechanical
macorsegregation simulation of steel 25CrMo4 along the diagonal line of the ingot. (a) Strain rate pattern and the 15 analyzed points (b) Strain rate evolution during the casting process on the 15 selected points (c) Enlarged strain rate plot in the first hour (d) Enlarged strain rate plot below the 0.005 strain region. ...55 Figure 2.16 Effective strains subjected by the ingot during the casting process.
(a) Radial strains on 15 points along the diagonal line (b) Vertical strains on 10 points on the ingot top skin. ...56 Figure 2.17 Tension test machine and chamber. (a) GleebleTM 3800 (b) Test
chamber with specimen installed. ...56 Figure 2.18 Temperature dependence of thermo-mechanical properties of the
studied steel. (a) True stress and strain curves (b)Young’s modulus (E) and yield stress (σs) (c) Stain rate sensitivity (m) and strain hardening
Figure 2.19 Linearized binary phase diagrams with respect to iron using Thermo-Calc® and the enlarged region for the studied steel. ...59
Figure 3.1 (a) The 40 MT cast ingot after stripping out of the mold (b) Three regions subjected to chemical and microstructure characterizations. ...68 Figure 3.2 The used 3D model and the installation positions of thermocouples
(TC) for experiment and sensors (SN) for simulation ...69 Figure 3.3 Micrographs of the three studied regions on the axial face along the
section of 30cm below the hot-top/casting body separation interface. (a) Region 1 in the periphery (d2 = 366 μm) (b) Region 2 in the ½
radius position (d2 = 474 μm) (c) Region 3 in the center
(d2 = 536 μm). ...73
Figure 3.4 Predicted solid fraction/temperature curves for the Regions 1-3 according to the classical limiting cases and the intermediate models over a range of Fourier number values. (a) α = 10.57(ingot wall side) (b) α = 12.60 (mid-radius region) (c) α = 12.66 (ingot center). ...74 Figure 3.5 Temperature dependence of thermal conductivity for the steel in study
according to different microsegregation solidification models for the three cases. (a) α = 10.57(ingot wall side) (b) α = 12.60 (mid-radius region) (c) α = 12.66 (ingot center). ...75 Figure 3.6 Temperature dependence of specific heat for the steel in study
according to different microsegregation solidification models for the three cases. (a) α = 10.57 (ingot wall side) (b) α = 12.60 (mid-radius region) (c) α = 12.66 (ingot center). ...76 Figure 3.7 Temperature dependence of density for the steel in study according to
different microsegregation solidification models for the three cases. (a) α = 10.57(ingot wall side) (b) α = 12.60 (mid-radius region) (c) α = 12.66 (ingot center). ...77 Figure 3.8 Temperature field (left figures) combined with liquid fraction patterns
(right figures) predicted using Lever rule and Scheil models in the solidification process. (a, e) 0.5h (end of filling) (b, f) 5.5h (c, g) 10.5h (d, h) 15.5h. ...81 Figure 3.9 Temperature profiles on 5 specified positions on the outside surface
of the mold. (a) Temperature profiles for all 5 monitored positions (b) Temperature profiles in the higher temperature regions for the first four monitored positions. ...82
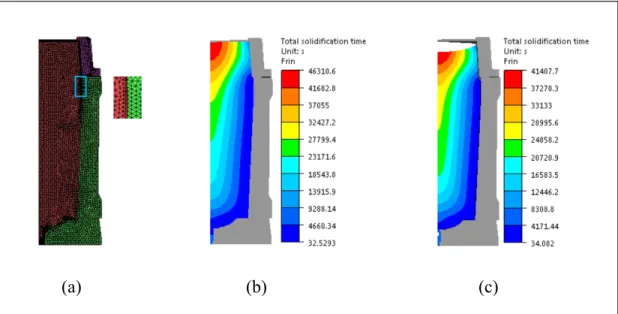
Figure 3.10 Total solidification time (s) for simulations based on
microsegregation models. (a) Lever rule (b) Scheil. ...83 Figure 3.11 Predicted segregation pattern of carbon. (a) Lever rule (b) Scheil. ...84 Figure 3.12 Segregation pattern of carbon on the axial surface of the hot-top and
upper section of ingot. (a) Lever rule (b) Scheil (c) Mass
spectrometer measurements with macrostructure around the hot-top/ingot junction...85 Figure 3.13 Macrograph around positive segregated bands on the longitudinal
section at 30 cm below the hot-top/ingot body interface and the
corresponding segregation ratio patterns of carbon. (a) Macrograph with black solute-enriched bands (b) Mass spectroscopy
measurements of the carbon segregation ratio pattern with sampling
density of 0.9 × 0.9 cm2. ...86
Figure 4.1 Casting system and established model. (a) Top view image of the mold (b) Main elements and corresponding materials in the 15° model with sensors placed in the same positions as the
thermocouples (TCs) (c) Mesh distribution of the 15° model. ...93 Figure 4.2 Cutting diagram for chemical and macrostructure analyses. ...94 Figure 4.3 Temperature dependence of thermodynamic parameters of the
studied steel, as well as the calculated and reported properties of pure iron and AISI commercial steels for verifying the applicability of the used software/model. (a) Solid fraction (b) Density (c)
Specific heat capacity (d) Thermal conductivity coefficient. ...99 Figure 4.4 Temperature dependence of thermomechanical properties of the
studied steel. (a) Young’s modulus and yield stress (b) Stain rate
sensitivity and strain hardening coefficient. ...100 Figure 4.5 Predictions of thermomechanic model (TM). (a) Vertical
displacement of Point 1, and radial displacements of Points 2, 3 and 4 with time (b) Evolution of ingot volume with time. ...104 Figure 4.6 Temperature fields predicted by thermohydraulic (TH, left) and
thermomechanic models (TM, right). (a, e) 0.5 h (end of filling) (b, f) 5.5 h (c, g) 10.5 h (d, h) 15.5 h after pouring. ...105 Figure 4.7 Movement of 1450 °C and 950 °C isotherms with time. (a)
Figure 4.8 Liquid fraction and liquid flow patterns predicted by thermohydraulic (TH, left) and thermomechanic resolution (TM, right). (a, e) 0.5 h (end of filling) (b, f) 1.5 h (c, g) 10.5 h (d, h) 15.5 h after pouring. ...107 Figure 4.9 Evolution of solid volumetric fraction with time. ...108 Figure 4.10 Total solidification time patterns. (a) Thermohydraulic model (TH)
(b) Thermomechanic model (TM). ...109 Figure 4.11 Carbon segregation ratio patterns predicted with thermohydraulic
(TH, left) and thermomechanic models (TM, right). (a, e) 0.5 h (end of filling) (b, f) 1.5 h (c, g) 10.5 h (d, h) 15.5 h after pouring. ...110 Figure 4.12 Temperature readings for thermocouples (TC) and the temperature
predictions from simulations with thermomechanical (TM) and
thermohydraulic models (TH)...112 Figure 4.13 Evolution of macrosegregation ratio of carbon at the end of
solidification. (a) Along the ingot centerline (b) Along the cutting section with 30cm below the hot-top/ingot body interface. ...113 Figure 4.14 Segregation ratio patterns of carbon on the axial surface of
longitudinal section. (a) Thermohydraulic model (TH) (b)
Thermomechanic model (TM) (c) Mass spectrometer measurements with macrostructure around the hot-top/ingot junction. ...114 Figure 5.1 Segregation ratio patterns in the two ingots (LFR and HFR) for the
three analyzed solutes. (a, b) C (c, d) Mn (e, f) Cr. ...125 Figure 5.2 Partition coefficients of different alloying elements and diffusion
coefficients of different solutes in liquid iron. (a) Partition coefficients of different alloying elements determined based on
linearized binary phase diagrams with respect to iron (b) Evolution of diffusion coefficients of solutes in liquid iron as a function of
temperature. ...126 Figure 5.3 Frequency distribution of segregation ratios. (a) In the hot-top
(b) In the upper section of ingot body. ...127 Figure 5.4 Segregation ratio profiles along the ingot central axis of the two
ingots. (a) Carbon (b) Manganese (c) Chromium. ...128 Figure 5.5 Segregation ratio profiles along the bottom of the cutting section
of the two ingots. (a) Carbon (b) Manganese (c) Chromium. ...129 Figure 5.6 Grain morphologies in the bordering zones (the chill walls are on
Figure 5.7 Micrographs along the bottom of the cutting section (30 cm below the hot-top/casting body separation position) of ingots LFR (left) and HFR (right). (a, c) In the 1/2 radius position from the center (b, d) In the center. ...132 Figure 6.1 Predicted macrosegregation ratio patterns of carbon in the
solidification process. (a, f, k) End of filling (b, g, l) 1.5 h (c, h, m) 5.5 h (d, i, n) 10.5 h (e, j, o) End of solidification. ...139 Figure 6.2 Evolution of macrosegregation ratio of carbon at the end of
solidification. (a) Along the ingot centerline (b) Along the cutting section with 30cm below the hot-top/ingot body interface. ...141 Figure 6.3 Segregation ratio patterns of carbon on the axial surface of
longitudinal section of 30M, 22M and 30E, 22E. (a, c) Model prediction (b, d) Mass spectrometer measurements and
macrostructures. ...142 Figure 6.4 Macrographs around positive segregated bands on the longitudinal
section at 30 cm below the hot-top/ingot body interface and the corresponding segregation ratio patterns of carbon. (a, c)
Macrograph with black solute-enriched bands (pointed by arrows) (b, d) Mass spectroscopy measurements of the carbon segregation ratio pattern with sampling density of 0.9 × 0.9 cm2. ...143
Figure 6.5 Liquid fraction patterns combined with velocity vectors predicted by 38M, 30M and 22M. (a, f, h) 12 min after pouring (b, g, l) End of filling (c, h, m) 1.5 h (d, i, n) 10.5 h (e, j, o) 14.5 h after pouring. ...145 Figure 6.6 Predicted solidification time. (a) 38M (b) 30M (c) 22M. ...148 Figure 6.7 Time-dependent displacements of ingot surface and volume
change. (a) Time-dependent displacement of Points 1-4 in the radial and axial directions (b) Time-dependent of instantaneous volume to the initial volume of the castings. ...149 Figure 6.8 Temperature fields predicted by 38M (left group), 30M (middle
group) and 22M (right group). (a, d, g) End of filling (b, e, h) 5.5h (c, f, i) 10.5h after pouring. ...151 Figure 6.9 Time-dependent displacement of isotherms 1450 °C and 1050 °C
during the casting process predicted by 38M, 30M and 22M. (a) In the radial direction (b) In the vertical direction. ...153 Figure 7.1 Segregation ratio patterns of carbon during the casting process
and 55M (lower group). (a, e, i) 0.5 h (end of filling), (b, f, j) 5.5 h, (c, g, k) 10.5 h and (d, h, l) End of solidification. ...160 Figure 7.2 Predicted and measured segregation ratio profiles of carbon at the
end of solidification. (a) In the vertical direction along the ingot centerline b) In the horizontal direction along the section at 30cm below the hot-top/ingot body separation interface. ...161 Figure 7.3 Characterizations in mid-radius position on the section 30 cm below
the hot-top/ingot body interface for the experimentally obtained ingots 75E and 62E. (a, c) Macrograph with solute-rich black bands illustrated with white arrows, (b, d) Segregation ratio pattern of carbon measured using mass spectrometer with sampling
density of 0.9 × 0.9 cm2. ...162
Figure 7.4 Temperature field (left figures) and liquid fraction patterns combined with velocity vectors (right figures) predicted by 75M, 65M and 55M. (a, d, g) 0.5 h (end of filling) (b, e, h) 5.5 h (c, f, i) 10.5 h after pouring. ...164 Figure 7.5 Movement of 1450 °C and 1050 °C isotherms with time. (a) In the
radial direction (b) In the vertical direction. ...165 Figure 7.6 Distance between 1450 °C and 1050 °C isotherms with time. (a) In
the radial direction (b) In the vertical direction. ...167 Figure 7.7 Predicted total solidification times. (a) 75M (b) 65M (c) 55M. ...167 Figure 7.8 Examination of ingot volume contraction in the solidification
process of three superheat cases. (a) Predicted time-dependent
displacements of Points 1-3 in the radial direction and Point4 in the axial direction (b) Displacement differences between 65M/55M and 75M on Points 1-3 in the radial direction and Point4 in the axial direction ...168 Figure 8.1 Predicted macrosegregation ratio patterns of carbon in the
solidification process for three studied cases. (a, e, i) 0.5 h (end of filling) (b, f, j) 5.5 h (c, g, k) 10.5 h (d, h, l) End of
solidification. ...176 Figure 8.2 Evolution of macrosegregation ratio of carbon at the end of
solidification. (a) Along the ingot centerline (b) Along the cutting section 30 cm below the hot-top/ingot body interface. ...177
Figure 8.3 Temperature fields predicted by 50M (left group), 120M (middle group) and 250M (right group). (a, d, g) End of filling, (b, e, h) 5.5 h (c, f, i) 10.5 h after pouring. ...179 Figure 8.4 Temperature gradient examination in the radial direction along
the hot-top/ingot body interface in the cast ingots of 50M, 120M and 250M during the casting process. (a) Time-dependent
displacement of 1450 °C and 1050 °C isotherms (b) Time -
dependent radial distance between 1450 °C and 1050 °C isotherms. ...180 Figure 8. Temperature gradient examination in the vertical direction
along the ingot centerline axis in the cast ingots of 50M, 120M and 250M during the casting process. (a) Time-dependent
displacement of 1450 °C and 1050 °C isotherms (b) Time- dependent vertical distance between 1450 °C and 1050 °C
isotherms. ...181 Figure 8.6 Time-dependent displacement of isotherms 1450 °C and 1050 °C
during the casting process. (a) In the predictions (b) In the
experimental measurement. ...182 Figure 8.7 Liquid fraction patterns combined with velocity vectors predicted
by 50M, 120M and 250M. (a, d, g) 0.5 h (end of filling) (b, e, h) 1.5 h (c, f, i) 5.5 h (d, h, l) 10.5 h after pouring. ...184 Figure 8.8 Total solidification time (a) 50M (b) 120M (c) 250M. ...185 Figure 8.9 Radial displacement of Points 1-3 and vertical displacement of Point 4
LIST OF ABREVIATIONS
ALE Arbitrary Lagrangian-Eulerian
CET Columnar-to-Equiaxed Transition
DC Direct-Chill Casting
EVP Elasto-Visco-Plastic
FE Finite Element
FEM Finite Element Modeling
LSRE Local Solute Redistribution Equation
MT Metric Tons
SDAS Secondary Dendrite Arm Spacing
SN Sensors TC Thermocouple
TH Thermohydraulic model
TM Thermomechanic model
LIST OF SYMBOLS
Symbol Unit Description
α 1/K Coefficient of linear thermal expansion
α - Back-diffusion Fourier number
β - Solidification shrinkage
βi wt.%/K Solutal expansion coefficient of solute i
βT 1/K Thermal expansion coefficient (/K)
εT - Steel emissivity
𝜀̅ - Equivalent plastic strain rate
𝜀̅ - Equivalent plastic strain
𝜀 s-1 Strain rate tensor
ηl - Dynamic viscosity of the liquid,
λ W/m/K Thermal conductivity
µ Pa·s Dynamic viscosity of fluid
𝑣 m/s Linear local solid/liquid interface advance velocity
𝜐 - Poisson’s coefficient.
ρ kg/m3 Density
ρ0 kg/m3 Reference density (density at liquidus)
ρl kg/m3 Density of liquid
ρs kg/m3 Density of solid
𝜎 MPa Von Mises equivalent flow stress
σs MPa Yield stress
σT W/m2/K Stephan-Boltzmann constant
ω0 wt.% Nominal composition
𝜔 wt.% Nominal carbon content
𝜔 wt.% Nominal concentration of solute i
ωC wt.% Carbon content
ωi wt.% Local concentration of solute i
𝜔 wt.% Concentration of carbon in the liquid
𝜔 wt.% Concentration of solute i in the liquid
ωs wt.% Solute concentration at the solid/liquid interface
Δεtr - Solidification shrinkage
ΔH kJ/kg Enthalpy of reaction
∇𝑇 °C or K Temperature gradient
∇𝑝 Pa Pressure gradient
A m2 Cross-sectional area to flow
Cp J/kg/°C Specific heat capacity
CR °C/s Cooling rate
d m Characteristic length
D mm2/s Diffusion coefficient
D0 cm2/s Diffusion frequency factor
d2 μm Secondary dendrite arm spacing
𝐷 mm2/s Diffusion coefficient of solute i in the liquid
Ds μm2/s Diffusivity of solute element in the solid phase
E GPa Young’s modulus
f - Phase fraction
fl - Volume fraction of liquid
fs - Volume fraction of solid
fα - Volume fractions of α-ferrite
fγ - Volume fraction of γ-austenite
fδ - Volume fraction of δ-ferrite
g m/s2 Gravitational acceleration
h W/m/°C Heat transfer coefficient
hgap W/m/°C Gap heat transfer coefficient
j mol/s Solute flux
k - Equilibrium partition coefficient
K m2 Permeability of the mushy zone
ki - Partition coefficient of solute i
Kperm m2 Isotropic permeability
Ks - Viscoplastic consistency in the solid
Kvp - Viscoplastic consistency of the material
l μm Length scale of the microsegregation domain
L m Length over which pressure drop is taking place
Lf kJ/kg Latent heat of fusion
m - Strain-rate sensitivity coefficient
ml - Slopes of liquidus line
𝑚 - Liquidus slope of solute i
𝑚 - Solidus slope of solute i
N - Number of solute elements in the steel
n - Strain hardening exponent
n - Outward normal unit vector
p MPa Pressure
q W Heat flux
Q cal/mol Diffusion activation energy
Qt m3/s Total discharge
R cal/mol·K Gas constant
Re - Reynolds number
Ri - Segregation ratio of solute i
Rv 1/s Isotherm velocity
s - Cauchy stress tensor
t s Time
tf s Diffusion time (local solidification time)
tF min Filling time
T °C or K Temperature
T0 °C Steel pouring temperature
Tconf °C Coherency temperature
Text °C Exterior environmental temperature
Tm °C Melting temperature for pure iron
Tl °C Liquidus temperature
Tmold °C Initial temperature of molds
Tref °C Reference temperature
Ts °C Solidus temperature
v m/s Average velocity
INTRODUCTION
Ingot casting is still one of the important processes for the production of large-size semi-products of high-quality special steels. Macrosegregation, as one of the most significant defects, is difficult to be reduced by the subsequent thermo-mechanical treatments. The presence of the detrimental defect leads to heterogeneous properties in the final cast ingot, severely deteriorate the quality of final products, significantly affect their performance and suitability for different applications, and hence haunt the manufacturers over decades. It has therefore long been predominant concern in pursuit of the prediction on the occurrence, intensity and location of macrosegregation and the measures on the elimination or even clarification of macrosegregates.
Some countermeasures have been reported effective in the control of the degree of convection and diffusion in the liquid and solid, and thus of the solidification process at the outset. However, the dependence of the macrosegregation extent on the critical processing parameters, particularly with respect to multi-component low-alloyed steel ingots in the industrial-scale size, is still unclear and needs to be investigated.
Great endeavors have long been made in the development of finite element modeling (FEM) tools for the prediction of macro-scale solute distribution, due to their faster and less expensive design cycle, compared with the timely and costly trial-and-error approach.
Despite dramatic progress have been made in the last 60 years, predictive capabilities of current available models are still limited. The effectiveness of models is prominently restrained by the computing powers due to the complexity of the involved phenomena, the inappropriateness of the model’s geometry, meshes, boundary conditions, as well as the uncertainties associated with input parameters and auxiliary models. A lack of suitable experimental studies, with which model results can be compared, enhances the difficulty for the examination of models’ viability. The development of a reliable macrosegregation predictive model will thus be of experimental and industrial significance for the macrosegregation research, the production process design and the optimization of the ingot manufacturing efficiency.
The current project, therefore, was initiated to explore the development of a reliable simulation model in order to predict the extent and severity of macrosegregation in a 40MT (metric ton) medium-carbon high strength steel ingot as a function of casting parameters with the view to minimize the occurrence of the macro-scale defect. For this purpose, systematic studies were performed. All the elements which could introduce uncertainties into the model were eliminated. And then a FEM model was constructed. The applicability of the established model to the studied steel and cast ingots was verified using experimental measurements on the chemical, thermal and dimensional profiles. The developed model was employed to investigate the impact of three casting parameters, i.e. filling rate, melt superheat and mold initial thermal conditions, on the thermomechanical evolution, macroscopic fluid flow and the macro-scale solute distribution in the course of filling and casting process. The beneficial effect of the corresponding adjustment of casting variables on the alleviation of macrosegregation was also quantitatively validated against experimental characterizations. All these works are given in detail in 8 chapters.
In Chapter 1, a critical literature review has been done about the macrosegregation formation and development mechanisms, the control methods usually taken to improve ingot quality and limit the intensity of macrosegregation, and the development of macromodeling technique in the past 60 years. The key difficulties of the performance of the countermeasures and the establishment of a reliable macromodel are also given. The viability of their use in an industrial environment is then assessed and the key factors limiting their effectiveness are highlighted.
The adopted methodology, which combined experimentation and simulation, is extensively presented in chapter 2. The material and ingot cast system in study are introduced. The ascertainment of each aspect regarding the model construction is comprehensively described, including the model algorithm, the optimization of model geometry and configuration, the determination of the grid size and the identification of the parameters of concerned materials. The involved softwares, the experimental apparatus, sampling and conditions are stated in the meanwhile.
Chapter 3 is devoted to the identification of the microsegregation model that best predicts macrosegregation in the studied steel ingot. The examined microsegregation models include the classical equilibrium lever-rule, the extreme non-equilibrium Scheil-Gulliver, as well as other treatments in the intermediate regime proposed by Brody and Flemings, Clyne and Kurz, Kobayashi and Ohnaka. Comparative analyses are performed on three regions, representing the initial, intermediate and final stages of the solidification process. The thermophysical properties calculated using each of the above microsegregation models are used for three-dimensional simulations of the solidification process of the studied 40MT steel ingot. The simulation predictions were compared with the experimental measurement for the validation of the reliability of the model.
The importance of solidification shrinkage and solid deformation in the large-size steel ingot solidification process is discussed in Chapter 4. A thermohydraulic model is developed to study heat and solute transport coupled with flow driven by thermosolutal convection (buoyancy-driven flow). A thermomechanic model (TM) is also set up where thermosolutal transport induced by the combined effects of buoyancy- and shrinkage-induced flow was considered. Both models are applied for the numerical study of the filling and cooling stages of the investigated ingot. Based on the comparison between simulation prediction and experimental results, the established model is further improved and decided to be the baseline for the exploration of casting variables.
The comprehensive performances of parametric studies are given in Chapters 5-8, using the determined reliable model. Three casting parameters are investigated: filling rate, initial melt superheat and mold initial temperature. Qualitative and quantitative examination of the occurrence and severity of macrosegregation as a function of the above parameters are conducted. Their associations with the evolution of solid shrinkage, air gap formation, temperature field, solid fraction change and melt velocity domain throughout the filling and cooling stages are explored. The results are analyzed in the framework of theories concerning heat and mass transfer and diffusion/convection-controlled solidification.
Three Annexes are added at the end, talking about the impacts of different segregation levels of alloying elements, thermophysical properties of materials and non-uniform temperature
distribution of the mold on the solidification and cooling behaviors. They act as supplements of the above chapters and preliminary studies of new model development and future work. The findings in the dissertation allow for a better understanding of the underlying mechanisms responsible for the occurrence of macrosegregation in ingot casting process. They should also be helpful for the casting process design of a given ingot and could be used in industry to improve the quality of large size ingot production and the productivity of high value-added steels or other alloys which are prone to macrosegregation.
PROJECT CONTEXT AND DEFINITION
Ingot casting is required for production of high-cost heavy mono-block industrial components, such as the shaft rotor for steam turbine and the pressure vessels for nuclear power generation. During the solidification of alloys, solute is partitioned between the solid and liquid to either enrich or deplete interdendritic regions. This naturally leads to variations in composition on the scale of micrometers, i.e., to microsegregation, and on the length scales approaching the dimensions of the casting, i.e., to macrosegregation. For large size ingots, macrosegregation may be of the order of centimeters or meters (Pickering, 2013). Microsegregation can be removed by homogenization heat treatment, because the distance is sufficiently small over which diffusion can take place to redistribute the alloying elements. Macrosegregation, however, is practically impossible to remove (as seen in Figure 1.1), due to the big distances over which species are required to move within available time scales (Campbell, 2011).
Figure 1.1 Carbon profile on longitudinal section of a 40 metric ton steel ingot from Finkle Steel with nominal composition of 0.36
wt% C after reheating and forging
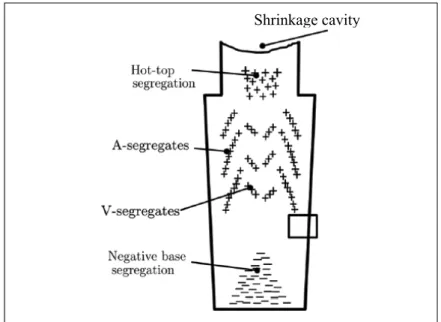
Positive segregation
Negative segregation A-segregates
Almost all macrosegregation is undesirable for casting manufacturers. As the chemical variations can lead to severe microstructural changes, it could deteriorate the quality of the cast products and significantly affect their performance and suitability for different applications. The effects of macrosegregation are critically significant. Thus, predicting the severity and location of macrosegregated zones and eliminating their detrimental effects have been and still remain a challenge to the industry. This chapter first reviews the macrosegregation types, formation mechanisms, common countermeasures and the development of predictive methods. The viability of their use in an industrial environment is then assessed and the key factor limiting their effectiveness is highlighted. The definition of the current project is given at the end of this chapter.
1.1 Macrosegregation
The first examination of macrosegregation in steel ingots can be traced back to 1920s (Hultgren, 1929). Since then, although our understanding of segregation development process has considerably improved, the same macrosegregation patterns can still be observed in ingots produced today (Campbell, 2011). These, as shown in Figures 1.1 and 1.2 (Pickering, 2013), include positive top segregation (with the carbon content more intense than the nominal one at the top of the ingot), negative base segregation (with the solute concentration smaller than the nominal one at the bottom of the ingot) and solute-enriched channel segregations (A- and V-segregate bands). A-segregations, pointing towards the top of the casting, are located near the boundary between center and the periphery, while V segregations are visible in the central part of the casting.
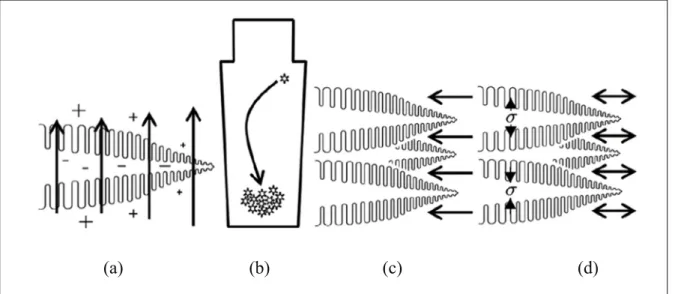
All types of macrosegregation are derived from the same basic mechanism: movement or flow of segregated liquid with respect to the solid framework of the mushy zone during the solidification process. The movement of enriched liquid and depleted solid can occur through a number of processes, as shown in Figure 1.3 (Pickering, 2013):
i) Convective flows due to density gradients caused by temperature and composition variations in the liquid (Figure 1.3a). The thermal and solutal convection contributions can either aid or oppose each other, depending on whether local temperature and concentration
fields cause liquid density to increase or decrease. The convection due to the coupled action of temperature and solute is known as thermosolutal convection.
ii) Movement of small (equiaxed) grains or solid fragments, which have nucleated heterogeneously in the melt, become detached from the dendrites due to remelting/stress or have separated from the mold wall after pouring (Figure 1.3b). Equiaxed grains in steels are denser than the surrounding liquid and will hence tend to sink. This mechanism, along with convective fluid flow, is a dominant macrosegregation process in large size ingots.
iii) Flow that feeds solidification shrinkage and thermal contraction of the liquid and solid during cooling (Figure 1.3c).
iv) Deformation of the solid network in the mushy zone due to thermal stresses, shrinkage stresses and metallostatic head (i.e., the pressure provided by the liquid metal above) (Figure 1.3d), or external forces on the solid shell (such as those from the rolls in continuous casting of steel).
Shrinkage cavity
Figure 1.2 Schematic of macrosegregations in large ingots. Positive segregation is denoted by + symbols (regions enriched in solute) and negative by – (regions
v) Imposed flows due to pouring, motion of gas bubbles, vibration, applied electromagnetic fields, stirring, rotation etc.
In ingot casting of steels, the positive segregations dominantly result from the thermosolutal convective flow. The negatively segregated cone is caused by the sedimentation of the equiaxed crystals, formed early in the solidification process, owing to their own weight and a downward motion of liquid along the wall induced by thermal convection. The A-segregates are the results of solutal convection through the columnar dendritic zone in the same direction as, but at a faster speed than, the isotherm velocity. The V-segregates arise from equiaxed crystals settling in the core (Pickering, 2013).
(a) (b) (c) (d)
1.2 Measures to control macrosegregation
It has been found that the extent of segregation depends greatly on the degree of convection or diffusion in the liquid and solid, thus depending upon the cooling conditions in the solidification. Careful control of casting process parameters at the outset could therefore be
Figure 1.3 Schematic of the processes leading to mass transport during ingot solidification. (a) Convective flows in the interdendritic liquid (+ symbols denote enrichment in solute, whilst - denote depletion (b) Grain sedimentation (more generally
solid movement) (c) Liquid flow to feed solidification shrinkage (d) Mushy-zone deformation (Pickering, 2013).
the effective method to control the extent and intensity of macrosegregation. So far, intensive researches have been underway, and some critical process parameters have been identified and used as ‘countermeasures’ to produce sound ingots with improved quality and limited macrosegregations:
1) Control of alloy composition
Alloys, by definition, are always multicomponent. Different alloying elements can have opposite contributions to the density of the mixed melt, to the buoyancy force (i.e. the upward force exerted by a fluid that opposes the weight) and to the overall flow. As a result, they can affect the overall contribution of solutal convection (i.e. motion of fluid induced by composition variation) to the macrosegregation (Du, Eskin et Katgerman, 2007). Furthermore, different concentrations of alloying elements exert different effects on the partition coefficient k, (defined as the ratio of the solid composition to the liquid composition). That is, they affect its deviation from unity (no partitioning of solute elements between liquid and solid phases during solidification, and therefore no segregation) and whether it is less than or greater than 1 (determining the extent and pattern of macrosegregation). It has been reported that the A-segregation could be reduced by increasing molybdenum and decreasing silicon and manganese within the specified range
(Suzuki et Taniguchi, 1981). The reduction was related to the stable density stratification (i.e. variations in density) in the solute-rich liquid, and the decreased and more neutral buoyancy at the temperature within the freezing zone.
2) Employment of multipouring technique
Multipouring technique refers to sequential pouring of molten steel from multiple ladles with different concentrations of alloying elements. Each ladle content, temperature, weight and flow rate are carefully controlled at optimum condition. The purpose is to build an initial
delaminated concentration distribution (i.e. an initial disparate chemical distribution) for the solidification of steel ingots (Duan, Shen et Liu, 2015). It has been argued that the multipouring process is effective to suppress macrosegregation in large size steel ingots by
reversing the initial concentration distribution in the top and the bottom section of the steel ingot before solidification starts (Tu, Shen et Liu, 2015).
3) Adjustment of ingot dimension and configuration
The average ratio of height to diameter of the steel ingot was found to be a factor relevant to the macrosegregation of steel ingot (Lesoult, 2005). Improving insulating effects and increasing the height and reducing the taper of the hot-top result in the formation of channel segregates in the hot-top (Flemings, 1975). With increasing insulating ability of sleeve, the light melt at the top overcomes more segregated carbon floating from the lower part of the ingot, and the positive segregation could be decreased (Comon, Delorme et Bastien, 1973).
4) Introduction of forced melt flow
The forced melt flow, or convection, could be imposed by stirring, rotating or oscillating the crucible, introducing a rotating magnetic or electromagnetic field. The aim is to reduce the contact pressure between the melt and mold, broaden the mushy zone, promote heterogeneous nucleation, reduce temperature gradient and weaken the effect of gravity (Zhang, Cui et Lu, 2003; Zhang et Cui, 2003). As a result, significant refinement of the cast microstructure can occur, solute distribution in the ingot can be improved, and macrosegregation of alloy elements can be reduced (Zhang, Cui et Lu, 2003; Zhang et Cui, 2003; Zhao, Cui et Nagumi, 2005).
5) Control of casting parameters
Stringent control of casting parameters, as the most practical ‘countermeasure’, has attracted the attention of many researchers (Pickering, 2013). Numerous studies have been performed on the effect of different parameters on the solidification behavior of castings.
i) Filling rate
It has been reported that the variation of the filling rate can give rise to the change in the flow characteristics (Im, Kim et Lee, 2001; Lee, Mok et Hong, 1999), the solidification speed (Im, Kim et Lee, 2001;), the temperature and thermal stress fields (Lee, Mok et Hong, 1999; ), the
metal front migration, the heat transfer at the early stages of the casting process (Lee, Mok et Hong, 1999; ) and the cold shuts formation (Ravindran et Lewis, 1998). It has also been revealed that residual flow due to filling effects can significantly affect the shape of the mushy zone and delay the development of solutal convection (Yadav et al., 2009). All these actions result in less intense macrosegregation near the cold wall and a farther distance of A-segregates from the cold wall (Yadav et al., 2009). However, the effect of filling velocity on macrosegregation in large size steel ingots has not yet been reported, either numerically or experimentally.
ii) Initial melt superheat
Superheat is excess of the casting temperature above the liquidus (Campbell, 2011). In the past decade, many studies have been carried out on the impact of melt superheat on macrosegregation.The findings, however, present two different views:
On one hand, it was pointed out that a higher superheat enhanced the convection velocities (Liu et al., 2011; EI-Bealy et Hammouda, 2007), coarsened the equiaxed dendritic grains and increased secondary dendritic arm spacing (Zhong et al., 2012). Meanwhile, a higher superheat can reduce the height of bottom negative segregation cone (Liu et al., 2011) and decrease the intensity of carbon segregation (EI-Bealy et Hammouda, 2007; Zhong et al., 2012; Pikkarainen, et al., 2016;).
On the other hand, it was reported that a lower melt superheat results in weakened flotation of grains (Sun et al., 2016), favored equiaxed structures (Mäkinen et Uoti, 2006) and increased nucleation density of crystals (Sun et al., 2016). A decreased severity of macrosegregation is also ascribed to a lower melt superheat (Sun et al., 2016), including a less intense centerline macrosegregation (Mäkinen et Uoti, 2006) and V-shaped segregation (Guan et al., 2018). It was observed that a lower melt superheat favored the stability of equiaxed crystals, resulting in more uniform rejection of solutes in the mushy zone, and subsequently a reduction in segregation severity (Choudhary et Ganguly, 2007).
In view of the above conflicting findings on the effect of melt superheat on macrosegregation, it is of great necessity to turn to further investigations for an answer.
iii) Initial mold temperature
The initial mold temperature, as a casting parameter, is not specified in production and often fixed at or close to room temperature. It was found, however, that a rise in initial mold temperature was accompanied by coarsened grains (Zhang et al., 2016; Li et al., 2017), increased secondary dendrite arm spacing (SDAS), aggravated shrinkage porosities (Li et al., 2017; Haj, Bouayad et Alami, 2015) and a prolonged solidification time (Haj, Bouayad et Alami, 2015; Li et al., 2017). However, the impact of initial mold temperature on macrosegregation in large size steel ingots is still not clear and needs to be quantified.
In order to minimize the occurrence of macrosegregation in a heavy steel ingot, stringent control of the aforementioned parameters is of critical importance. Quantification of their impact on macrosegregation, however, is a great challenge, particularly using the costly and timely ‘trial and error’ approach. Finite element method (FEM), thus, becomes where to turn for help.
1.3 Macrosegregation modeling
Simulation by FEM method is a good choice for quantitative predictions of the occurrence and severity of solidification defects, for performance of parametric studies to control and improve casting quality and for understanding the basic physical mechanisms. Particularly, when large ingot manufacture is involved and it is too complicated or impossible to optimize the process and compositions just simply by trial and error approach, FEM method performs a faster and less expensive design cycle.
However, predictive capabilities of current models are still limited despite dramatic progress have been made in the last 60 years. Computing power is arguably the most prominent restraint on the effectiveness of current models, and there is also a lack of suitable experimental studies with which model results can be compared.
Solidification models are very complex and require large computing resources in their solutions, because they often must simultaneously consider many aspects of a solidification process. As illustrated in Figure 1.4 (Pickering, 2013), phenomena to be considered include heat transfer, solute transport, fluid flow, solid movement, thermal gradients, cooling rates, melt convection, alloy composition, melt superheat, mold temperature, and deformation at the (macroscopic) scale of the casting, as well as phase equilibrium, nucleation, structure formation, segregation, and flow at various microscopic scales. Many of the above parameters interact in casting processes (Beckermann, 2000) and some of them vary with time and position during solidification, as observed by Willers et al. (Willers et al., 2005). Any factor that affects the flow and the microstructure also influences macrosegregation, and vice versa. Today, it is certainly not desirable to generate a solidification model that includes all listed effects, since a model of such complexity would hardly be useful in practice. The attention is therefore attracted to the researches where some of these interactions are taken into account in order to address industrially relevant solidification problems.
Figure 1.4 Potentially important interactions in modeling solidification in castings (Pickering, 2013).