HAL Id: hal-02952013
https://hal.archives-ouvertes.fr/hal-02952013
Submitted on 29 Sep 2020
HAL is a multi-disciplinary open access
archive for the deposit and dissemination of
sci-entific research documents, whether they are
pub-lished or not. The documents may come from
teaching and research institutions in France or
abroad, or from public or private research centers.
L’archive ouverte pluridisciplinaire HAL, est
destinée au dépôt et à la diffusion de documents
scientifiques de niveau recherche, publiés ou non,
émanant des établissements d’enseignement et de
recherche français ou étrangers, des laboratoires
publics ou privés.
Strain rate effect of mode II interlaminar fracture
toughness on the impact response of a thermoplastic
PEEK composite
Christophe Bouvet, Joël Serra, Pablo Garcia-Perez
To cite this version:
Christophe Bouvet, Joël Serra, Pablo Garcia-Perez. Strain rate effect of mode II interlaminar fracture
toughness on the impact response of a thermoplastic PEEK composite. Composites Part C: Open
Access, Elsevier, 2020, 2, pp.0. �10.1016/j.jcomc.2020.100031�. �hal-02952013�
an author's
https://oatao.univ-toulouse.fr/26736
https://doi.org/10.1016/j.jcomc.2020.100031
Bouvet, Christophe and Serra, Joël and Garcia-Perez, Pablo Strain rate effect of mode II interlaminar fracture
toughness on the impact response of a thermoplastic PEEK composite. (2020) Composites Part C: Open Access, 2.
ISSN 2666-6820
Strain
rate
effect
of
mode
II
interlaminar
fracture
toughness
on
the
impact
response
of
a
thermoplastic
PEEK
composite
C.
Bouvet
a, ∗,
J.
Serra
a,
P.
Garcia
Perez
a, ba Université de Toulouse, Institut Clément Ader, ISAE-SUPAERO – UPS – IMT Mines Albi – INSA, 10 av. E. Belin, 31055 Toulouse, France b Arts et Métiers ParisTech, I2M, Talence, France
Keywords:
Strain rate effect Carbon/PEEK composite Fracture toughness Impact
Delamination
a
b
s
t
r
a
c
t
Recent advancements in composite production and processing are making thermoplastics a viable option in a wider array of aerospace applications. In particular, Carbon Fibre Reinforced Plastics (CFRP) with thermoplastic resin are believed to have better damage tolerance properties than thermosets. However, few studies have been conducted regarding the numerical modelling of the behaviour of such materials submitted to low energy impacts. Here the Discrete Ply Model (DPM), that predicts the failure of laminated composites with the help of cohesive elements, is used to compare thermosetting and thermoplastics impact damage tolerances. The DPM is improved to take into account the strain rate effect of the fracture toughness (FT) in mode II of interlaminar interfaces. First, the End Notched Flexure (ENF) test that induces unstable crack growth is used both to experimentally measure the value of FT in mode II for high speed crack growth and to identify the strain rate effect used in the model. Second, the DPM is then used to simulate impact tests for various stacking sequences ([45 2, − 45 2, 0 2, 90 2] 2S, [0 2, 45 2, 90 2, − 45 2] 2S, [0 2, 30 2, 90 2, − 30 2] 2Sand [90 2, − 45 2, 0 2, 45 2] 2S) and impact energy levels (10, 20 and 30 J). Good correlations with experiment are observed in terms of force/displacement curves and delaminated areas. The numerical model correctly describes the asymmetry of the delaminated interfaces and the propagation of groups of interfaces located near the mid-thickness of the laminated plates. Finally, the damage associated with a 30 J impact is compared for the carbon/PEEK of this study and classical carbon/epoxy plates using numerical simulations (DPM). No significant difference has been found. The results corroborate those obtained in previous studies showing the relatively low value of FT in mode II, using an ENF test and infrared thermography (IRT). This article therefore questions the apparent superiority of carbon/PEEK laminated composites over carbon/epoxy laminated composites in terms of impact damage tolerance.
1. Introduction
High-performance composites with thermoplastic resin are being in- creasingly used in composite structures, in particular in the aeronauti- cal field. Semi-crystalline thermoplastic polymers, such as PEEK resins, have advantages over classical thermoset resins, such as epoxies: good damage and impact tolerance [1, 2], a high degree of chemical resis- tance, no expiry date, a usability over a large range of temperatures and a possible recycling through remelting. In the case of PEEK, its bio- compatibility also makes it a perfect candidate for composite trauma devices such as orthopaedic, dental, spinal and cranial implants [3, 4]. Classically, the literature states that thermoplastic composites show a better tolerance to impact damage than epoxy based composites [5, 6]. The main properties driving the impact tolerance of composite laminate, i.e. the mode I and mode II fracture toughness (FT), GIcand GIIc, are
∗Corresponding author.
E-mailaddress:christophe.bouvet@isae-supaero.fr(C. Bouvet).
the most important [2, 7–12]. The FT of thermoplastic resins is clearly higher than that of thermoset resins, particularly if the neat resin is con- sidered. For example, the mode I FT is about 4 N/mm for neat PEEK
resin compared to about 0.1 N/mm for neat epoxy resin [11]. How-
ever, the difference diminishes when fibres are added. Friedrich et al.
[13]have shown that carbon fibre prepeg with PEEK resin is “only ” about 10 times more resilient (mode I and mode II FT) than carbon fibre prepeg with epoxy resin ( Fig.1a), for a similar fibre content of approximately 64%. Carbon fibre woven plies also follow this trend: mode I and mode II FT are about 1.6 N/mm and 2.5 N/mm, respec- tively, for carbon/PEEK composite, compared to about, 0.5 N/mm and 1.5 N/mm for carbon/epoxy composite, for a similar fibre content of ap- proximately 50% [11]. This evolution can be explained by the increase of the influence of fibres on damage propagation. The delamination can only evolve between plies on a prepeg-based laminate and the crack
Fig.1. Effect of the crack growth speed on modes I and II FT for carbon/epoxy and carbon/peek composites (a) [13], and ductile (b) and brittle behaviour (c) of delamination of PEEK resin [29].
propagation path is even more constrained by the undulated pattern of the yarns for the case of woven plies [11]. It is generally accepted in the literature that the initial damage during impact loading, associated with delamination, is mainly driven by the interlaminar FT in mode II. Therefore, the higher FT of thermoplastic composites in shearing mode makes them good candidates for impact tolerance [14].
However, some results recently reported in the literature show that the superior impact tolerance of carbon/thermoplastic laminated com- posites compared to that of carbon/epoxy laminated composites is not so obvious. For example, Vieille et al. compared the impact damage of composite laminates with woven carbon and 3 types of resin: 2 ther- moplastic ones (PEEK and PPS) and a thermoset one (epoxy) [9, 10]. Although better resistance to impact was expected from the thermoplas- tics, the results show similar behaviour for the 3 materials. The authors explain that the small difference observed between these 3 laminates could be due either to the woven nature of the plies or to the small thickness of the plates (about 2 mm), compared to the classical thick- ness (4 mm) used for standard tests [15]. Another explanation of the small difference between impact resistance of thermoplastic and ther- moset composites could be the strain rate effect of the thermoplastic resins on the interlaminar FT, particularly in shearing mode.
It is well established that the mechanical properties of polymers are very dependant on temperature, strain rate and pressure [16, 17]. Strain rate often has an influence on the fracture behaviour of both thermoset-
[18]and thermoplastic-based composites [19–23]. A few configurations seem to be strain rate-independent [24–27], behaviour that might be due to fibre bridging in unidirectional specimens [22]or to the rela- tively low strain-rates investigated. The review by W. J. Cantwell and M. Blyton on various thermoset and thermoplastic resin based compos- ites reveals that, on average, the fracture toughness of brittle matrix
composites is either rate-insensitive or increases slightly with loading rates [28]. In contrast, thermoplastic matrices exhibit a reduction in fracture toughness with increasing strain rates. According to Ploeckl, at low temperatures or at high strain rates, the molecular movements of the polymer chains are restricted and, consequently, the overall mate- rial behaviour shows a rigid and brittle response [20]. With increasing temperatures, rotations and translational displacements of side groups, small molecular groups or repeat units in the main polymer chain are possible. The decrease of the temperature is equivalent to the increase of the strain rate. In polymer physics literature, this is referred to as the time-temperature superposition principle.
Regarding the specific case of PEEK based composites, Hamdan et al. suggested that high rate testing induced a change in crystalline mor- phology and, more specifically, an increase of the crystallinity degree
[30]which would then be the cause of the fracture toughness decrease at high strain rates. El Qoubaa et al. showed that the dependency re- lationship of PEEK material properties on strain rate is not linear: the strain rate sensitivity is greater at higher strain rate (over 100/s) [31]. Friedrich et al. [13]performed ENF tests of APC-2 PEEK resin uni- directional (UD) composite laminate at different loading speeds. They showed that FT in mode II ( Fig.1a) of carbon fibre/PEEK decreased from 1.9 to 0.4 N/mm when the crosshead speed increased from 4.2 ×10 −6to
9.2 ×10 −2m/s. They explained this result by an evolution of the crack
growth type, from ductile propagation at low speed ( Fig.1b) to brittle propagation at high speed ( Fig.1c). Hashemi et al. reached the same conclusions with a carbon/PEEK composite using the corresponding pa- rameter of the loading-rate: the temperature [24]. Their work exhibited a clear increase in fracture toughness when the temperature rose. This is also the case for graphite/PEEK composites according to the analysis of Mall et al. [32].
Fig.2. FT in mode II versus crack growth evolution of the ENF tests [33]. (For interpretation of the references to colour in this figure, the reader is referred to the web version of this article.)
In a previous study [33], similar results were obtained with a PEEK resin and a UD carbon laminate using the unstable character of the ENF test. For low values of the initial crack length, the ENF test reveals an unstable propagation due to the snapback effect ( Fig.4) [34]. On this subject, the standard advises against using a crack length shorter than 0.347 L (where Lis the beam length, Fig.3). However, if the objective is to promote unstable propagation, it is interesting to forget this rule. The other drawback of unstable propagation is the impossibility to use the classical theory of ENF tests to obtain the interlaminar FT. Therefore, in this work, IRT was used to obtain the GIIcduring unstable propagation
[35–37]. The results show an R-curve effect at the initial crack growth with GIIc increasing from about 1 to 2.7 N/mm, and constant values
of GIIcbetween 0.75 and 1.3 N/mm during the unstable propagation
( Fig.2). The problem of using the IRT approach to measure the FT is the lack of confirmation of this method and, in particular, the difficulty of evaluating the Taylor–Quinney ratio: the ratio between the total en- ergy dissipated by the damage mechanism and the energy dissipated as heat. It lies between 100% (when all the energy released is dissipated as heat) and 0% (when all the energy released is stored in the material). For polymer materials, this value varies considerably, depending on the type of material and the type of loading. For brittle failures, the Taylor– Quinney ratio is close to 100%, and it lies between 90 and 100% in a more general case.
The objective of this article is to assess the influence of the decrease of the FT in mode II between slow and fast crack growth, on the impact behaviour, using a finite element (FE) model. First, a behaviour law of the GIIctaking the strain rate effect into account using the ENF test is
determined. Second, a model of the strain rate effect is proposed and evaluated using the ENF test. Eventually, this model is used in order to simulate impact tests performed at different energy levels and with different stacking sequences. The strain rate effect is highlighted in or- der to show its crucial effect on the damage developing during impact and, in particular, on the delaminated area. Additionally, a comparison with an impact model of thermoset composite is performed in order to compare a thermoplastic and a thermoset composite laminate.
2. ENFtest
2.1. FiniteelementmodeloftheENFtest
The composite laminate used in this study was the same as the one assessed in the previous work dealing with the measurement of the FT using IRT [33]: a UD prepreg laminate with PEEK thermoplastic resin
Table1
Mechanical properties of carbon/PEEK UD ply [46–48]and material parameters of the DPM.
Tensile Young’s modulus in fibre direction, E lt 150 GPa Compressive Young’s modulus in fibre direction, E lc 130 GPa Young’s modulus in transverse direction, E t 9 GPa
In-plane shear modulus, G lt 5 GPa
Poisson’s ratio, 𝜐lt 0.3
Tensile failure strain in fibre direction, 𝜎lt 0.019 Compressive failure strain in fibre direction, 𝜎lc − 0.01 Tensile failure stress in transverse direction, 𝜎tt 84 MPa Compressive failure stress in transverse direction, 𝜎tc − 150 MPa In-plane shear failure stress, 𝜏ltr 160 MPa Interlaminar fracture toughness in mode I , G Ic 1 N/mm Interlaminar low speed fracture toughness in mode II , G II0 2.7 N/mm Interlaminar high speed fracture toughness in mode II , G II1 1 N/mm
Reference shear velocity, Δv 0 1000 mm/s
Material parameter driving the decrease of the FT, n 0 10 Tensile fracture toughness in fibre direction, G If,t 80 N/mm Compressive fracture toughness in fibre direction, G If,c 30 N/mm
Density, 𝜌 1600 kg.m −3
and IM7 carbon fibre. The mechanical properties and the material pa- rameters of the proposed FE model are noted in Table1. The geometry of the ENF test is given in Fig.3. The stacking sequence is [0 16/0 16],
where the “/ ” at mid-thickness corresponds to the Teflon film inserted to initiate the crack. Different initial crack lengths were studied but, for the present work, only the ENF test with an initial crack length of a0=
34 mm is presented. The ENF test is not detailed in this article but all the details can be found in the previous publication [33].
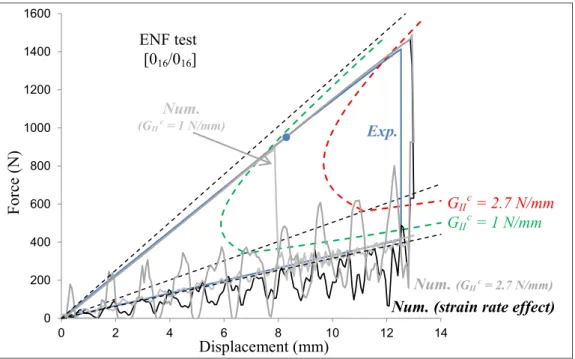
The force-displacement curves obtained experimentally and analyti- cally, for the ENF test with the initial crack length of 34 mm are plotted in Fig.4.
This figure shows:
• the experimental curve as a solid blue line and the point of initiation of the propagation as a blue point. The crack propagation starts at about 1 N/mm of FT, then stable propagation with an R-curve effect is observed up to about 2.7 N/mm of FT, and unstable crack growth is obtained. It is not possible to use the standard to evaluate the FT during this unstable crack propagation, so the FT was evaluated using IRT [33]at about 1 N/mm ( Fig.2).
• the elastic force-displacement curve of the beam without crack ( a = 0), with a half beam length ( a = L/2) and a full beam length ( a= L) crack as dashed black lines. The longer the crack, the smaller
Fig.3. ENF test setup.
Fig. 4. Experimental and analytical force- displacement curves of the ENF test. (For in- terpretation of the references to colour in this figure, the reader is referred to the web version of this article.)
the stiffness. These curves were obtained using an analytical model and are given for information.
• the curves of the condition of crack growth stability obtained ana- lytically using beam theory [38–40](green dashed line for 1 N/mm and red dashed line for 2.7 N/mm). The analytical expression of the condition of crack growth stability is different for a crack length higher and lower than half the length of the specimen. This explains the angular point for a = L/2. The snapback phenomenon is clearly visible for a crack length shorter than 0.347 L.
The FE model of the ENF test was built with 4 vol elements in the thickness of the beam, in order to have 2 elements in the thickness of each arm, and one cohesive zone element at mid-thickness (bottom right of Fig.5). The model was developed with the assumption of a plane strain in the (x,y)plane. Therefore, only one volume element was used in the z direction. The three cylinders of the ENF tests ( Fig.3) were simulated using rigid surfaces and the rubber was not modelled. In the experiment, the rubber was used to avoid compressive fibre failure just under the central cylinder, but in the FE model, even if a fibre failure model (detailed in III.1) was used, no fibre damage was obtained. The model was built using Abaqus Explicit v6.13 and the displacement of the cylinders was set at a constant velocity. A value of 130 mm/s was selected after having verified that the test could be considered static, and that a decrease of this value did not affect the result. Interface ele- ments were used to simulate the delamination at mid-thickness and the
non-penetration of the arms was imposed after the total damage of the interface elements. A coupled damage criterion was programmed with linear coupling between shearing mode (modes II and III) and opening mode (mode I). However, for the ENF test presented here, the crack propagates in pure mode II. The most important parameter for the ENF test is the FT in mode II, GIIc, and the strain rate effect is of particular
importance. During stable propagation, GIIcpresents a classical R-curve
effect ( Fig.2). This R-curve effect is due to the creation of a real frac- ture process zone (FPZ) at the crack tip. However, at the beginning of the test, there is a pre-existing crack generated by a Teflon film placed in the middle plane during the manufacturing process. Therefore, the FPZ is not a real one. This phenomenon is difficult to simulate but is partly taken into account by the initial damaging of the interface ele- ments at the crack tip. The first cohesive element at the crack tip will quickly reach a high stress value due to the high stress concentration. Therefore, once the damage is “activated ”, the stiffness of the element is progressively reduced (III.1) and, as for the experimental FPZ, stress is relieved locally.
In this study, for both crack growth initiation and stable propagation, a constant value of FT of 2.7 N/mm is used ( Figs.2and 6).
2.2. Strainrateeffect
During the unstable crack growth, a low value of FT of 1 N/mm is observed ( Figs.2and 6). It is then necessary to draw the path between
Fig.5. Model of the ENF test just before and just after the unstable crack growth. (For interpretation of the references to colour in this figure, the reader is referred to the web version of this article.)
Fig.6. Strain rate effect on the shearing FT. (For interpretation of the references to colour in this figure, the reader is referred to the web version of this article.)
these 2 values (2.7 N/mm and 1 N/mm) using a velocity parameter. One way could be to use the crack growth velocity. In the present case, this velocity was measured between about 600 and 1000 m/s, which approximately corresponds to the classical Rayleigh wave speed [41]. However, it is difficult to use this velocity because its determination is al- most impossible within an interface element. Moreover, it calls for com- munication between elements, which is tricky in the classic FE codes. Therefore, the velocity gap between the two superimposed nodes of the interface elements is used:
Δ𝒗= 𝒗𝒖𝒖𝒑𝒑𝒆𝒓− 𝒗𝒖𝒍𝒐𝒘𝒆𝒓 (1)
where vulower ( vuupper) is the velocity of the lower (upper) node of the
interface element in the u direction, and u is the in-plane direction of the interface element ( Fig.5).
We propose that the decrease of the FT between the low speed value and the high speed value may be driven using an exponential function ( Fig.6):
𝑮𝑰𝑰𝒄= 𝑮𝑰𝑰1+ (𝑮𝑰𝑰0− 𝑮𝑰𝑰1)(1 + |Δ𝒗 Δ𝒗|
0
) 𝒏0
(2) where GII0is the value of shearing FT for stable propagation, GII1is the
value of shearing FT for unstable propagation, Δv is the shear velocity of the interface element, Δv0is the reference shear velocity, and n0is
a material parameter driving the decrease of the FT ( Table1). Two pa- rameters are then needed to drive the evolution of the FT: the reference shear velocity, Δv0, and the exponent, n0. To simplify the model, the ex-
ponent is set to 10, which is high enough to obtain a relatively quick decrease but low enough not to trigger numerical instabilities in the FE
Fig.7. Effect of the reference shear velocity on the shear velocity (a) and on the size of the zone of high dissipated energy (b). (For interpretation of the references to colour in this figure, the reader is referred to the web version of this article.)
model. Complementary work was done in order to evaluate the effect of this parameter. Results showed that its effect was negligible if the value remained low enough. The only parameter remaining to be evaluated was the reference shear velocity. Many values were tested but only the effect of three values: 10 2, 10 3, and 10 4mm/s is presented in this article
( Fig.6).
In order to evaluate the most relevant value for Δv0, its effect on the
force-displacement curve was studied. The influence of Δv0appeared negligible and therefore these curves have not been plotted on Fig.9be- cause the result would not be readable. These 3 curves are included between the black curve “Num. (strainrateeffect)” and the grey curve “Num. (GIIc= 2.7 N/mm )”. The unstable crack growth is triggered when the energy release rate (ERR) reaches 2.7 N/mm, and its decrease to 1 N/mm only influences the unstable propagation. The unstable propa- gation is represented in the force-displacement curve only by the sudden load drop; no difference can be detected.
Another evaluation of the most relevant value of Δv0could use the crack growth velocity. Once again, there is no significant effect. The crack growth velocity is relatively independent of Δv0 and is always
equal to about 1300 m/s.
To determine Δv0, one could also measure the experimental shear
velocity during the ENF test. This measurement is difficult to make and was not performed during this work. In the future, it would be inter- esting to confront this experimental value with the one selected in this article. The shear velocity during the crack propagation with the 3 val- ues of the reference shear velocity Δv0(10 2, 10 3and 10 4mm/s) is dis-
played in Fig.7a. It should be noted that the shear velocity in a given interface element changes between the start and the end of the damage. The shear velocity at the damage onset is low because the interface ele- ment stiffness remains high, and is high at the damage end because the interface element stiffness becomes null. Therefore, we suggest that the representative shear velocity is reached when half of the FT is dissipated. For Δv0of 10 2mm/s and 10 3mm/s, a sudden increase of the shear
velocity is observed when:
Δ𝒗= Δ𝒗0 (3)
while, for Δv0equal to 10 4 mm/s this condition is never reached, so
this peak is not observed. Nevertheless, this sudden increase of the shear velocity does not really affect the unstable propagation and for the three cases, unstable crack growth is triggered for a crack length of about 35 mm.
An interesting aspect of this shear velocity peak is the correspond- ing decrease of the FT ( Fig.7b). The higher the shear velocity, the lower the FT. The tipping point is the reference shear velocity ( Fig.6). Consecutively, a zone of high dissipated energy appears at the begin- ning of the crack growth. The higher Δv0is, the larger is the high dis-
sipated energy zone. It is about 4, 8 and 155 mm when Δv0 is 10 2,
10 3and 10 4mm/s respectively ( Fig.7b). This parameter can therefore
be used to discriminate the most relevant value of the reference shear velocity.
To do this, the information given by the IRT measurement was used. In Fig.8, the temperature field is displayed at four time increments:
Fig.8. Temperature field measurement using IRT dur- ing the ENF test (1 snapshot every 2 ms). (For inter- pretation of the references to colour in this figure, the reader is referred to the web version of this article.)
two frames before the unstable propagation and two after (one snapshot every 0.002 s). On the frame just after the unstable crack growth (frame 3861), a zone of higher dissipated energy, of about 10 mm, is clearly visible in the zone where the crack growth started. The size of this zone can then be compared to the size of the high dissipated energy zone obtained numerically ( Fig.7b) and establishes the most relevant value for Δv0 at 10 3 mm/s. More precisely, the value is between 10 3 and
10 4mm/s but a perfectly accurate value is not fundamental. A reference
shear velocity of 10 3mm/s was considered relevant enough to be used
with confidence. This value will be used in the next section to simulate the impact tests.
The numerical curve obtained using the model with the strain rate effect is displayed as a continuous black curve in Fig.9. Unstable crack growth is obtained for a cylinder displacement of about 13 mm. The de- formed FE model is shown just before and just after this unstable crack growth in Fig.5. The Von Mises stress is used as a stress mathemati- cal norm rather than a failure criterion here. The unstable propagation induces a marked oscillation of the beam going occurring during the unloading phase.
The numerical curve obtained from the model without the strain rate effect is displayed as a continuous solid grey curve for FT values of 1 and 2.7 N/mm. Unstable crack growths are obtained for displacements of about 8 and 13 mm for FT values of 1 and 2.7 N/mm, respectively. These unstable propagations induce marked oscillations of the beam occuring during the unloading phase. Such numerical issues would need to be corrected in the future by improving the modelling of the structural damping.
3. Impacttest
Now that the strain rate effect has been identified using the ENF test, the model can be used to simulate impact on plates with the same car- bon/PEEK composite and with various stacking sequences. The model used is the Discrete Ply Model (DPM) which has been in development for more than 10 years at the Institut Clément Ader [42–45]. Details are available in our previous article [33], so only the main characteristics will be recalled.
Fig.9. Experimental, analytical and numerical force-displacement curves of the ENF test. (For interpretation of the references to colour in this figure, the reader is referred to the web version of this article.)
Fig.10. DPM concept and its associated specific mesh [44].
Fig.11. Impact test set up [15].
3.1. DiscretePlyModel
The principle of the DPM is to use interface elements to simulate the discontinuity of the matrix cracks ( Fig.10). These elements make it possible both to simulate the significant openings of the plies due to matrix cracking and to account for the coupling between the matrix
cracking and the interlaminar damage (delamination). The behaviour law of these interfaces is based on a double criterion:
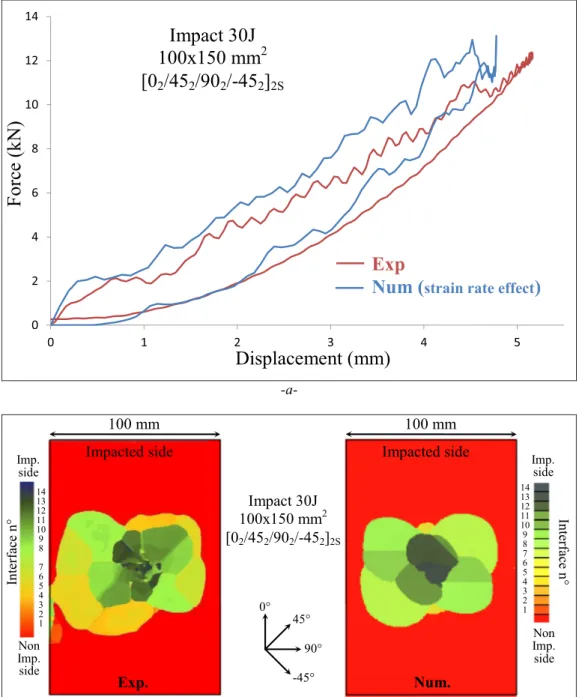
• A Hashin’s criterion in neighbouring volume elements; when this criterion is reached, the interface element is immediately broken,
Fig.12. Experimental and numerical comparison of impact test of the 45° plate: force-displacement curve (a) and delaminated interfaces (b). (For interpretation of the references to colour in this figure, the reader is referred to the web version of this article.)
• An energy dissipation in the interface element, driven by the fracture toughness, a linear coupling between the modes I and II/III and a linear decrease of the stress versus the displacement. In this interface element, due to the absence of relevant data on the FT, the values measured in the interlaminar interface are used ( Table1) and the strain rate effect is not used.
Extra interface elements are used to simulate the interlaminar dam- age. These interface elements are of course, the ones mentioned in Sec- tion II, concerning the ENF test. The strain rate effect is used and its effect will be detailed.
Fibre damage is also taken into account by using continuum damage mechanics in the volume elements with a damage criterion based on
a simple longitudinal strain criterion onset and an energy dissipation based on the FT of fibre failure [33].
3.2. Impactmodel
Impact tests were performed on the carbon/PEEK laminate men- tioned above, with four different stacking sequences of 32 plies and a total thickness of 4.51 mm:
• [45 2, − 45 2, 0 2, 90 2] 2S: referred to as the 45° stacking sequence,
• [0 2, 45 2, 90 2, − 45 2] 2S: referred to as the 0° stacking sequence,
Fig.13. Experimental and numerical comparison of impact test of the 0° plate: force-displacement curve (a) and delaminated interfaces (b). (For interpretation of the references to colour in this figure, the reader is referred to the web version of this article.)
• [90 2, − 45 2, 0 2, 45 2] 2S: referred to as the 90° stacking sequence (0° stacking sequence with a 90° rotation).
The impact set-up was standardized according to the AITM 1–0010 ( Fig.11). An impactor of 2.03 kg was used and the initial velocity was set so as to obtain impact energies of 10, 20 and 30 J. This article mainly focuses on the results obtained with the 30 J impact.
The force-displacement curves obtained experimentally and numer- ically are plotted in Figs.12a, 13a, 14a and 15a for the 45°, 0°, 30° and 90° plates, respectively. For the 45° plate, the curves obtained with- out strain rate effect and with the high speed and low speed FT of 1 and 2.7 N/mm ( Fig.12a), are also plotted. For all cases, the corre- lation between the experimental impact and the corresponding model is good. However, the numerical results exhibit a higher stiffness than the associated experimental curves. This may be due either to the non- linearity of the elastic stiffness which is not taken into account, or to
an underestimation of the damage in the thickness of the plate since, with the DPM, the damage in the out-of-plane direction is not consid- ered because it is classically very weak compared to the in-plane dam- age. However, this damage could add an additional displacement. The higher stiffness of the model also generates a lower maximum displace- ment. The test is driven by impact energy. Therefore, if the force is over- estimated, the displacement is underestimated. In the same way, the energy dissipated, corresponding to the area of the force-displacement curve, is overestimated by the model (about 9 J for the experiments and 11.5 J for the model). The higher stiffness of the model should partly ex- plain this discrepancy. Globally, model predictions are considered good enough for further study of the strain rate effect of the interlaminar FT in mode II.
The delaminated surfaces from the experiment (obtained by C-scan) and from the FE model are displayed in Figs.12b, 13b, 14b and 15b. The C-scan is classically shown with a thickness indicator making it possible
Fig.14. Experimental and numerical comparison of impact test of the 30° plate: force-displacement curve (a) and delaminated interfaces (b). (For interpretation of the references to colour in this figure, the reader is referred to the web version of this article.)
to evaluate the positions of the delaminated interfaces. The interface number may not be perfectly accurate because it was sometimes dif- ficult to separate two close interfaces and the ultrasonic investigation involved some uncertainty. One can distinguish the double-ply at mid- thickness. To compare the model with the experiment, the delaminated interfaces were coloured with the same colours as the C-scan. The red colour corresponds to pristine areas. Due the uncertainty of the C-scan procedure, there may be some misinterpretation in the colour of the delaminated interface obtained numerically. On average, this approach provides a rapid way to compare the delaminated interfaces. Compar- isons between C-scan and DPM are satisfactory overall but discrepancies can be found. For the 45° plate ( Fig.12b), the three delaminated inter- faces at the left of the picture are well reproduced by the model but the delaminated interface obtained numerically at the right, is clearly overestimated. Several delaminated interfaces near the non-impacted side e.g. the interfaces 2, 3 and 4 for the 0° and 90° plates, seem to be underestimated by the model. This discrepancy could be due to under-
estimation of the fibre failure. When there is a small amount of fibre failure, the delaminated interfaces are mostly the mid-thickness ones, due the high shear in this zone. However, when the fibre failure devel- ops further, the interfaces located near the non-impacted side tend to delaminate. To give a better idea of the extent of the predicted fibre damage, the top left part of Fig.16shows the fibre damage obtained after impact on the 45° plate. The blue colour means no fibre damage and the red means total fibre damage (at the top right, the fibre damage corresponds to the impact model without the strain rate effect and, at the bottom, to an impact on a carbon/epoxy plate). It is clear that there is a very small amount of fibre damage and the delaminated interfaces at mid-thickness are clearly visible.
Another important feature is the unsymmetrical shape of the delam- inated surface. From a global point of view, this asymmetry is repro- duced numerically even if the model is perfectly symmetrical. The FE models are indeed totally symmetrical (central symmetry), which is, of course, not the case for the experiments. During the experiments, even
Fig.15. Experimental and numerical comparison of impact test of the 90° plate: force-displacement curve (a) and delaminated interfaces (b). (For interpretation of the references to colour in this figure, the reader is referred to the web version of this article.)
though the plate was positioned with great care and the impactor well guided, the margin of error in position of the impactor point is estimated at ± 1 mm. For numerical results, the problem is perfectly symmetrical and the positioning of the unsymmetrical area was chosen in order to be consistent with the experiments, and thus to make comparisons eas- ier. Other results in the literature show an asymmetry of the damage
[49, 50]. It seems that the asymmetry is mainly observed when the de- lamination is situated near the mid-thickness. In the present study, the asymmetry is often, but not always, observed for 30 J impact. Fig.17
presents three C-scans of 30 J impact tests on 30° plate as an example. The three tests are exactly the same, except for the uncertainties re- lated to the manufacturing process and to the experiment. Among the three tests, two are unsymmetrical and are similar, and one is symmet- rical. This distribution is fairly representative of some campaign tests performed on similar plates. In order to compare this particular fea- ture with the FE model, the impact point was shifted 1 mm left, right,
down or up for a few impact models. For most of the models, this led to no significant difference with the perfectly centred model but, in a few configurations, differences were found. For example, Fig.18shows the result of the impact model on the 0° plate with a 1 mm offset (to the left). There is a significant difference with the centred impact model ( Fig.13b). This feature is representative of what is observed experimen- tally and should be explained by the instability of the propagation of the delaminations at mid-thickness. Unlike the delaminations propagating near the non-impacted side, which are almost symmetric and seem sta- ble, the propagation at mid-thickness seems less stable. This point could also be related to the high strain rate effect observed with this type of impact. If the delaminations at mid-thickness are unstable, then the crack growth velocity could be higher than the classical delamination near the non-impacted side and would highlight the strain rate effect. This is, however, put forward only as a possible explanation and will have to be examined through extra research.
Fig.16. Fibre failure obtained numerically for the carbon/PEEK 45° plate with the strain rate effect, with the high speed FT, and for carbon/epoxy plate. (For interpretation of the references to colour in this figure, the reader is referred to the web version of this article.)
Fig.17. Experimental tests on the 30° plate: delaminated interfaces.
Fig.19. Effect of the FT on the delaminated interfaces of the 45° plate impact.
Fig.21. Numerical comparison of carbon/PEEK and carbon/epoxy laminate plate in impact test of the 45° plate: force-displacement curve (a) and delaminated interfaces (b). (For interpretation of the references to colour in this figure, the reader is referred to the web version of this article.)
3.3. Effectoffracturetoughness
On average, the strain rate effect seems to be able to account for the large delaminated surface area observed during impact. To confirm this, impact models were run with the strain rate mentioned above (left of
Fig.19) and without any strain rate effect, with FTs of 1 and 2.7 N/mm (right of Fig.19). On the one hand, it is clear that the damage simulated with the FT measured at low speed (2.7 N/mm) strongly underestimated the delaminated area. It has to be noted that this value of 2.7 N/mm is the standard value (determined using industrial norms). This configura- tion also exhibits too much fibre damage on the two first plies situated near the impacted side.
This fibre failure is visible due the delamination of the interfaces 13 and 14 ( Fig.19). This greater fibre damage is confirmed by comparing the fibre damage variable with the strain rate effect (top left of Fig.16) and for the higher value of the FT (top right of Fig.16). The fibre damage
with the low value of FT is not represented because it is similar to the one observed with the strain rate effect.
On the other hand, the global shape of the delaminated interfaces obtained with 1 N/mm of fracture is relatively similar to that obtained with the strain rate effect. This is logical because, once the crack growth starts, the FT decreases quickly to this value due to the strain rate ( Fig.6). Only the delamination of the interfaces near the impacted side (interfaces 12, 13 and 14) is modified between the low value of FT and the strain rate effect.
In order to enrich the comparison between the experiment and the DPM, impact tests at 10 J and 20 J were performed and numerically simulated on the 45° plate ( Fig.20). Globally, the increase of the delami- nated surface with the impact energy level is taken into account more or less well by the model using the strain rate effect. Again, the fibre failure of the first ply located on the impacted side seems underestimated. Its failure is clearly observed in the 20 J impact by the clear delamination
Table2
Mechanical properties of carbon/epoxy UD ply used as parameters of the DPM. Tensile Young’s modulus in fibre direction, E lt 130 GPa Compressive Young’s modulus in fibre direction, E lc 100 GPa Young’s modulus in transverse direction, E t 7.7 GPa
In-plane shear modulus, G lt 4.75 GPa
Poisson’s ratio, ϑlt 0.3
Tensile failure strain in fibre direction, 𝜀 lt 0.018 Compressive failure strain in fibre direction, 𝜀 lc − 0.0125 Tensile failure stress in transverse direction, 𝜎tt 60 MPa Compressive failure stress in transverse direction, 𝜎tc − 250 MPa In-plane shear failure stress, 𝜏ltr 110 MPa Interlaminar fracture toughness in mode I , G Ic 0.5 N/mm Interlaminar fracture toughness in mode II , G IIc 1.6 N/mm Tensile fracture toughness in fibre direction, G If,t 100 N/mm Compressive fracture toughness in fibre direction, G If,c 30 N/mm
Density, 𝜌 1600 kg.m −3
of interface 14 ( Fig.20b). It can be noted that the delaminated surface area measured during the 20 J impact is symmetrical with the central point of the plate, unlike the delaminated surface observed in the 30 J impact ( Fig.12b). From experimental and numerical observations, the asymmetry of the delaminated surface seems to appear between 20 and 30 J. Nevertheless, the asymmetry is sometimes not obtained with the experiment, even at 30 J.
3.4. Comparisonwiththermosetcomposite
In order to compare the thermoplastic resin with a thermoset resin, a configuration with a carbon/epoxy plate was modelled for the 45° plate impact. Only the simulation was run, and the material parameters were taken from previous studies ( Table2). Several experiments have already been performed with these material parameters [42, 43, 45, 50]
and the authors have relatively high confidence in the associated result. No strain rate effect was used for this simulation because the FT in mode II does not seem to vary significantly for epoxy resin. More exactly, the results found in the literature [51, 52]and in our experiments do not evidence a strain rate effect for Mode II, unlike in the work of Friedrich et al. [13], who measured a strain rate effect for epoxy resin similar to that for PEEK resin. The behaviour difference may come from the different types of epoxy polymer resins used, but this question remains open at this stage.
The carbon/epoxy plate exhibits a slightly smaller size of delami- nation than the carbon/PEEK plate in Fig.21b. This lower size of de- lamination for epoxy resin is due to the higher value of FT in mode II, 1.6 N/mm, compared to the high speed value of FT for PEEK resin, 1 N/mm. An asymmetry of the delaminated interfaces of the car- bon/epoxy plate can also be observed (right of Fig.21b), especially in the ones situated in the lower part of the thickness (interfaces 3–5).
The force-displacement curve of the carbon/epoxy plate is similar to that of the carbon/PEEK ( Fig.21a). The fibre failure pattern is also relatively close to the carbon/PEEK one ( Fig.16). The damage is actu- ally larger than the one simulated with the strain rate effect and slightly smaller than the one simulated with the high value of FT. It should be noted ( Fig.21b) that the pattern shown was recorded at the end of the impact test, when the load has returned to zero. Therefore, the pattern is representative of the deformation of the plate obtained straight after impact. The residual indentation is slightly reduced by a relaxation phe- nomenon not yet taken into account in the DPM. Ultimately, the impact behaviour of the carbon/epoxy plate is relatively similar to the impact behaviour of the carbon/PEEK, despite the higher static value of FT for PEEK resin.
To conclude, even though the FT in mode II (or more exactly the low speed value of the FT) is higher for PEEK resin than for epoxy resin, the delaminated surface is larger for PEEK resin. This is due to the strain rate effect, which considerably reduces the FT. This decrease is clearly a problem for PEEK composite laminates because it limits the interest of
these materials for impact damage tolerance. Nevertheless, this feature needs to be confirmed by other studies and with other thermoplastic resins. In particular, other stacking sequences could lead to different conclusions as the stacking sequences used in this study always con- tained two consecutive plies in the same direction, which is known to increase the development of the delaminated area.
4. Conclusion
A model taking the strain rate effect of the FT in mode II of inter- laminar interfaces into account has been developed. The first part of this research was to identify the correct parameters using an ENF test espe- cially set-up to generate unstable crack growth. Processing the results made it possible to experimentally measure the value of FT in mode II for high speed propagation and to identify the strain rate behaviour to be implemented in the model.
The second part consisted of simulating impact tests with different stacking sequences and different impact energy levels with the help of the DPM taking the strain rate effect into account. The DPM exhib- ited relatively good correlations with experiment. It made it possible to identify some asymmetry of the delaminated interfaces and to ob- serve the common propagation of groups of interfaces situated near the mid-thickness of the laminated plates.
Finally, the impact damage in the carbon/PEEK of this study was compared with that of classical carbon/epoxy plates with the help of numerical simulations (DPM). It showed that, when the lower value of FT in mode II of PEEK resin was used for high speed propagation, larger delaminated areas were generated; contrary to the result expected when considering the higher FT of PEEK for low speed crack growth.
This result confirmed the conclusions drawn in our previous study focused on the measurement of FT in mode II using the ENF test and IRT technique [33]. It also questions the interest of carbon/PEEK laminate composites compared to carbon/epoxy laminate composites in terms of impact damage tolerance properties. It would be interesting in the future to confront the results of this research with other studies on different fibre/matrix combinations and stacking sequences and to pursue the research on the numerical modelling on the compression after impact behaviour.
DeclarationofCompetingInterest
The authors declare that they have no known competing financial interests or personal relationships that could have appeared to influence the work reported in this paper.
Acknowledgement
The authors gratefully acknowledge CALMIP (CALcul en Midi- Pyrénées, ( https://www.calmip.univ-toulouse.fr) for access to the HPC resources under allocation p1026.
Supplementarymaterials
Supplementary material associated with this article can be found, in the online version, at doi: 10.1016/j.jcomc.2020.100031.
References
[1] J. Morton , E.W. Godwin , Impact response of tough carbon fibre composites, Compos. Struct. 13 (1989) 19 .
[2] D.C. Prevorsek , H.B. Chin , A. Bhatnagar , Damage tolerance: design for structural integrity and penetration, Compos. Struct. 23 (1993) 12 .
[3] D. Garcia-Gonzalez, M. Rodriguez-Millan, A. Rusinek, A. Arias, Low temperature effect on impact energy absorption capability of PEEK composites, Compos. Struct. 134 (2015) 440–449, doi: 10.1016/j.compstruct.2015.08.090 .
[4] D. Garcia-Gonzalez, A. Rusinek, T. Jankowiak, A. Arias, Mechanical impact be- havior of polyether–ether–ketone (PEEK), Compos. Struct. 124 (2015) 88–99, doi: 10.1016/j.compstruct.2014.12.061 .
[5] K. Srinivasan, W.C. Jackson, B.T. Smith, J.A. Hinkley, Characterization of damage modes in impacted thermoset and thermoplastic composites, J. Reinf. Plast. Compos. 11 (10) (1992) 1111–1126, doi: 10.1177/073168449201101004 .
[6] P. Bajurko, Comparison of damage resistance of thermoplastic and thermoset carbon fibre-reinforced composites, J. Thermoplast. Compos. Mater. (2019), doi: 10.1177/0892705719844550 .
[7] I. De Baere, S. Jacques, W. Van Paepegem, J. Degrieck, Study of the mode I and mode II interlaminar behaviour of a carbon fabric reinforced thermoplastic, Polym. Test. 31 (2) (2012) 322–332, doi: 10.1016/j.polymertesting.2011.12.009 . [8] P. Davies , M.L. Benzeggagh , The delamination behavior of carbon fiber reinforced
PPS, in: Proceedings of the 32nd International SAMPE Symposium, 1987 . [9] F. Lachaud, B. Lorrain, L. Michel, R. Barriol, Experimental and numeri-
cal study of delamination caused by local buckling of thermoplastic and thermoset composites, Compos. Sci. Technol. 58 (5) (1998) 727–733, doi: 10.1016/S0266-3538(97)00153-X .
[10] T. O’Brien , Composite interlaminar shear fracture toughness, GIIc: shear measure- ment or sheer myth?, in: R. Bucinell (Ed.) Composite Materials: Fatigue and Fracture:
7th Volume , ASTM International, West Conshohocken, PA, 1998, pp. 3–18 . [11] B. Vieille, V.M. Casado, C. Bouvet, About the impact behavior of woven-ply carbon
fiber-reinforced thermoplastic- and thermosetting-composites: a comparative study, Compos. Struct. 101 (2013) 9–21, doi: 10.1016/j.compstruct.2013.01.025 . [12] B. Vieille, V.M. Casado, C. Bouvet, Influence of matrix toughness and ductil-
ity on the compression-after-impact behavior of woven-ply thermoplastic- and thermosetting-composites: a comparative study, Compos. Struct. 110 (2014) 207– 218, doi: 10.1016/j.compstruct.2013.12.008 .
[13] K. Friedrich, R. Walter, L.A. Carlsson, A.J. Smiley, J.W. Gillespie, Mechanisms for rate effects on interlaminar fracture toughness of carbon/epoxy and carbon/PEEK composites, J. Mater. Sci. 24 (9) (1989) 3387–3398, doi: 10.1007/BF01139070 . [14] L.C.M. Barbosa, D.B. Bortoluzzi, A.C. Ancelotti, Analysis of fracture tough-
ness in mode II and fractographic study of composites based on Elium ○R
150 thermoplastic matrix, Compos. Part B Eng. 175 (2019) 107082, doi: 10.1016/j.compositesb.2019.107082 .
[15] ‘Airbus Industrie Test Method. Fiber Reinforced Plastics Determination of Compres- sion Strength After Impact. AITM-1.0010 ′ . 1994.
[16] Z. Major , R.W. Lang , Rate dependent fracture toughness of plastics, in: European Structural Integrity Society, 32, Elsevier, 2003, pp. 187–198 .
[17] C.R. Siviour, J.L. Jordan, High strain rate mechanics of polymers: a review, J. Dyn. Behav. Mater. 2 (1) (2016) 15–32, doi: 10.1007/s40870-016-0052-8 .
[18] D. Lee, H. Tippur, P. Bogert, Quasi-static and dynamic fracture of graphite/epoxy composites: an optical study of loading-rate effects, Compos. Part B Eng. 41 (6) (Sep. 2010) 462–474, doi: 10.1016/j.compositesb.2010.05.007 .
[19] C.A. Weeksa , C.T. Sud , Modeling non-linear rate-dependant behavior in fiber èrein- forced composites, Compos. Sci. Technol. 58 (1998) 603–611 .
[20] M. Ploeckl , Effect of Strain Rate On the Tensile, Compressive, and Shear Re- sponse of Carbon-Fiber-Reinforced Thermoplastic Composites, Technische Univer- sität München, 2018 .
[21] L. Cadieu, J.B. Kopp, J. Jumel, J. Bega, C. Froustey, Strain rate ef- fect on the mechanical properties of a glass fibre reinforced acrylic ma- trix laminate. An experimental approach, Compos. Struct. 223 (2019) 110952, doi: 10.1016/j.compstruct.2019.110952 .
[22] H. Wafai, et al., In situ micro-scale high-speed imaging for evaluation of fracture propagation and fracture toughness of thermoplastic laminates subjected to impact, Compos. Struct. 210 (2019) 747–754, doi: 10.1016/j.compstruct.2018.11.092 . [23] V.L. Reis et al., ‘High Strain-Rate Behavior of Fiber-Reinforced
Thermoplastic Composites Under Compressive Loadings’, 2017, doi: 10.26678/ABCM.COBEM2017.COB17-1122 .
[24] S. Hashemi , A.J. Kinloch , J.G. Williams , The effects of geometry, rate and tempera- ture on the mode I, mode II and mixed-mode I/II interlaminar fracture of carbon-fi- bre/poly(ether-ether ketone) composites, J. Compos. Mater. 24 (1990) 39 . [25] M. Blyton , The Interlaminar Fracture of Composite Materials, University of Liver-
pool, 1999 .
[26] P. Compston , The e €ect of matrix toughness and loading rate on the mode-II inter- laminar fracture toughness of glass- ○Rbre/vinyl-ester composites, Compos. Sci. Tech-
nol. (2001) 13 .
[27] B.L.K. Blackman, ‘The failure of fibre composites and adhesively bonded fibre com- posites under high rates of test’, J. Mater. Sci., p. 16.
[28] W.J. Cantwell, M. Blyton, Influence of loading rate on the interlaminar fracture prop- erties of high performance composites - a review, Appl. Mech. Rev. 52 (6) (Jun. 1999) 199–212, doi: 10.1115/1.3098934 .
[29] A.J. Smiley , R.B. Pipes , Rate sensitivity of mode II interlaminar fracture toughness in graphite/epoxy and graphite/PEEK composite materials, Compos. Sci. Technol. 29 (1987) 15 .
[30] S. Hamdan, G.M. Swallowe, Crystallinity in PEEK and PEK after mechani- cal testing and its dependence on strain rate and temperature, J. Polym. Sci. Part B Polym. Phys. 34 (4) (1996) 699–705 AID-POLB10>3.0.CO;2-C, doi: 10.1002/(SICI)1099-0488(199603)34:4 < 699 .
[31] Z. El-Qoubaa, R. Othman, Tensile behavior of polyetheretherketone over a wide range of strain rates, Int. J. Polym. Sci. 2015 (2015) 1–9, doi: 10.1155/2015/275937 . [32] S. Mall, G.E. Law, M. Katouzian, Loading rate effect on interlaminar fracture tough- ness of a thermoplastic composite, J. Compos. Mater. 21 (6) (Jun. 1987) 569–579, doi: 10.1177/002199838702100607 .
[33] P. Garcia Perez, C. Bouvet, A. Chettah, F. Dau, L. Ballere, P. Pérès, Ef- fect of unstable crack growth on mode II interlaminar fracture toughness of a thermoplastic PEEK composite, Eng. Fract. Mech. 205 (2019) 486–497, doi: 10.1016/j.engfracmech.2018.11.022 .
[34] C.C. Chamis, P.L.N. Murthy, L. Minnetyan, Progressive fracture of polymer matrix composite structures, Theor. Appl. Fract. Mech. 25 (1) (1996) 1–15, doi: 10.1016/0167-8442(96)00002-X .
[35] T. Lisle, C. Bouvet, M.L. Pastor, P. Margueres, R. Prieto Corral, Damage analysis and fracture toughness evaluation in a thin woven composite laminate under static tension using infrared thermography, Compos. Part A Appl. Sci. Manuf. 53 (2013) 75–87, doi: 10.1016/j.compositesa.2013.06.004 .
[36] T. Lisle, C. Bouvet, N. Hongkarnjanakul, M.-.L. Pastor, S. Rivallant, P. Margueres, Measure of fracture toughness of compressive fiber failure in composite struc- tures using infrared thermography, Compos. Sci. Technol. 112 (2015) 22–33, doi: 10.1016/j.compscitech.2015.03.005 .
[37] T. Lisle, C. Bouvet, M.L. Pastor, T. Rouault, P. Marguerès, Damage of woven com- posite under tensile and shear stress using infrared thermography and micrographic cuts, J. Mater. Sci. 50 (18) (2015) 6154–6170, doi: 10.1007/s10853-015-9173-z . [38] O. Allix, P. Ladevéze, A. Corigliano, Damage analysis of interlaminar fracture spec-
imens, Compos. Struct. 31 (1) (1995) 61–74, doi: 10.1016/0263-8223(95)00002-X . [39] P. Davies , Protocols for interlaminar fracture testing of composites, ESIS-Polymers
and Composites Task Group Presented at the, IFREMER, Centre de Brest, 1993 . [40] A.B. Pereira, A.B. de Morais, A.T. Marques, P.T. de Castro, Mode II interlaminar
fracture of carbon/epoxy multidirectional laminates, Compos. Sci. Technol. 64 (10– 11) (2004) 1653–1659, doi: 10.1016/j.compscitech.2003.12.001 .
[41] J.W.S.B. Rayleigh, ‘The Theory of Sound, vol 2.’, 1896.
[42] C. Bouvet, B. Castanié, M. Bizeul, J.-.J. Barrau, Low velocity impact modelling in laminate composite panels with discrete interface elements, Int. J. Solids Struct. 46 (14–15) (2009) 2809–2821, doi: 10.1016/j.ijsolstr.2009.03.010 .
[43] C. Bouvet, S. Rivallant, J.J. Barrau, Low velocity impact modeling in composite lami- nates capturing permanent indentation, Compos. Sci. Technol. 72 (16) (2012) 1977– 1988, doi: 10.1016/j.compscitech.2012.08.019 .
[44] S. Rivallant, C. Bouvet, N. Hongkarnjanakul, Failure analysis of CFRP lam- inates subjected to compression after impact: FE simulation using discrete interface elements, Compos. Part A Appl. Sci. Manuf. 55 (2013) 83–93, doi: 10.1016/j.compositesa.2013.08.003 .
[45] J. Serra, C. Bouvet, B. Castanié, C. Petiot, Scaling effect in notched compos- ites: the Discrete Ply Model approach, Compos. Struct. 148 (2016) 127–143, doi: 10.1016/j.compstruct.2016.03.062 .
[46] HEXCEL, ‘HexTow Carbon Fiber Datasheet’. 2014. [47] GOODFELLOW, ‘GoodFellow Peek Resin Datasheet’. 2014.
[48] F. Lemarchand , Étude De L’apparition Des Contraintes Résiduelles Dans Le Procédé D’empilement Par Soudage Et Consolidation En Continu De Composites Thermoplas- tiques, Arts et Métiers ParisTech, 2008 .
[49] F. Léonard, J. Stein, C. Soutis, P.J. Withers, The quantification of impact damage dis- tribution in composite laminates by analysis of X-ray computed tomograms, Compos. Sci. Technol. 152 (2017) 139–148, doi: 10.1016/j.compscitech.2017.08.034 . [50] N. Hongkarnjanakul, C. Bouvet, S. Rivallant, Validation of low velocity impact mod-
elling on different stacking sequences of CFRP laminates and influence of fibre fail- ure, Compos. Struct. 106 (2013) 549–559, doi: 10.1016/j.compstruct.2013.07.008 . [51] J.W. Gillespie, L.A. Carlsson, A.J. Smiley, Rate-dependent mode I interlaminar crack
growth mechanisms in graphite/epoxy and graphite/PEEK, Compos. Sci. Technol. 28 (1) (1987) 1–15, doi: 10.1016/0266-3538(87)90058-3 .
[52] I. Maillet and L. Michel, ‘Effet De La Vitesse De Chargement Sur Le Taux De Resti- tution D’énergie D’un CFRP En Mode I et II’, p. 9, 2017.
![Fig. 1. Effect of the crack growth speed on modes I and II FT for carbon/epoxy and carbon/peek composites (a) [13] , and ductile (b) and brittle behaviour (c) of delamination of PEEK resin [29] .](https://thumb-eu.123doks.com/thumbv2/123doknet/11637932.306796/4.892.168.729.84.586/effect-growth-carbon-composites-ductile-brittle-behaviour-delamination.webp)
![Fig. 2. FT in mode II versus crack growth evolution of the ENF tests [33] . (For interpretation of the references to colour in this figure, the reader is referred to the web version of this article.)](https://thumb-eu.123doks.com/thumbv2/123doknet/11637932.306796/5.892.138.758.86.393/versus-evolution-interpretation-references-figure-referred-version-article.webp)