HAL Id: hal-01367543
https://hal.archives-ouvertes.fr/hal-01367543
Submitted on 20 Sep 2016
HAL is a multi-disciplinary open access
archive for the deposit and dissemination of
sci-entific research documents, whether they are
pub-lished or not. The documents may come from
teaching and research institutions in France or
abroad, or from public or private research centers.
L’archive ouverte pluridisciplinaire HAL, est
destinée au dépôt et à la diffusion de documents
scientifiques de niveau recherche, publiés ou non,
émanant des établissements d’enseignement et de
recherche français ou étrangers, des laboratoires
publics ou privés.
A semantic approach to IoT data aggregation and
interpretation applied to home automation
Fano Ramparany, Quyet H. Cao
To cite this version:
Fano Ramparany, Quyet H. Cao. A semantic approach to IoT data aggregation and interpretation
applied to home automation. 2016 International Conference on Internet of Things and Applications
(IOTA), Jan 2016, Prune, India. �10.1109/IOTA.2016.7562689�. �hal-01367543�
A Semantic Approach to IoT Data Aggregation and
Interpretation applied to Home Automation
Fano Ramparany, Quyet H. Cao
Orange Labs28 chemin du Vieux Chene 38243 Meylan, France
E-mail: {fano.ramparany, quyet.caohuu}@orange.com
Abstract— One salient feature of data produced by the IoT is
its heterogeneity. Despite this heterogeneity, future IoT applications including Smart Home, Smart City, Smart Energy services, will require that all data be easily compared, correlated and merged and that interpretation of this resulting aggregate into higher level context, which better matches people needs and requirements, bringing the user experience to the next level. In this paper we propose a framework based on semantic technologies to aggregate IoT data. Our approach has been assessed in the domain of the Smart Home with real data provided by Orange Homelive solution. We show that our approach enables simple reasoning mechanisms to be conducted on the aggregated data so that contexts such as the presence, activities of people as well as abnormal situations requiring corrective actions, be inferred.
Keywords: semantic, interpretation, reasoning, aggregation
I. INTRODUCTION
An IDC study [1] predicts that the number of connected objects is approaching 200 billion today with 7% (14 billion) already connected to and communicating over the internet. Most of these objects automatically record, report and receive data. Although the volume of these IoT data currently repre- sents only 2% of the world’s data, the same study report by 2020 it will increase up to 10%.
This data has been characterized by IBM data scientists along four dimensions [2]: volume, variety, velocity and ve- racity.
In this paper we mainly address the Variety issue, which further refer to incompatible data formats, non-aligned data structures and inconsistent data semantics.
IoT data is heterogeneous both semantically (the temper- ature in my bedroom doesn’t have much to do with the positioning of my fridge in the kitchen) and syntactically (a temperature is a floating point number expressed in celsius grade, whereas a position is a coordinates pair expressed in meters with respect to some defined reference origin). De- spite this heteogenity, future IoT applications including Smart Home, Smart City and Smart Energy services, will require that all data be easily compared, correlated and merged, and that interpretation of the resulting aggregate into higher level context better matches people needs and requirements. In this paper we propose a framework based on semantic technologies
to aggregate IoT data. Our approach has been assessed in the domain of the Smart Home with real data provided by Orange Homelive solution, which we introduce in section III. We show that our approach enables reasoning mechanisms to be conducted on the aggregated data so that contexts such as the presence, activities of people as well as abnormal situations requiring corrective actions, could be easily recognized.
In the next section we state the problems and draw the related state of the art. We then introduce the experimental platform that we used to experiment and assess our solution approach. This will enable us to illustrate the technical and scientific challenges that we face with a real Smart Home setting. We then develop our semantic modeling approach and elaborate on the benefit of this approach in terms of reasoning and high level interpretation that this model allows. We finally discuss our approach with its short terms perspectives and unveil a first repertoire of use-cases exploiting our approach that will improve the experience of Smart Home occupants.
II. PROBLEMSTATEMENTANDSTATEOFTHE ART
Some work has been conducted in analyzing the benefit of semantic modeling in the domain of pervasive computing ([3], [4]), but to our knowledge none have pushed to the point of implementing and evaluating it on real life data.
The value of semantic technologies has been recognized for sometimes now for integrating database schema, data modeling and processing.
A. Semantic data integration
Data integration research has been focused in database schema integration approaches and the use of ontologies and related semantic technologies to provide data consistency among heterogeneous database schemas. The theoretical foun- dations of this Ontology-Based Data Access (OBDA) [5] have been thoroughly investigated.
The Web since its origins has been a vehicle of data interchange. However, automatic discovery and integration of Web data has been impractical until the availability of the RDF framework and RDF data sources. The flagship initiative on this area, LinkedData [6] has fostered both the size of the structured Web data and its exploitation [7]. One of the pillars of this idea is the possibility of retrieve specific data in the web
of data; this task is performed by SPARQL [8], a SQL-like language that enables querying a RDF store.
B. Semantic data modeling
One major benefit of expressing data representation with semantic language relates to its ability to provide high level and expressive abstractions. For instance, in the IoT, data abstraction is concerned with the ways that the physical world is perceived and managed. In this domain, a Semantic Sensor Network ontology [9] has been developed and proposed at the W3C for standardization. To enable semantic interoperability for smart appliances in the smart home domain TNO1 therefore developed SAREF, the Smart Appliance REFerence ontology. It covers popular sensor and actuators and can be aligned with other ontologies. There are other examples related to semantic data modeling in context of smart home for en- ergy efficiency, such as ThinkHome [10], S-SESAME [11]. Recently, LOV4IoT [12] has introduced a new ontology in the smart home among the 45 other ontologies. This vision of introducing abstraction based on a semantic approach, i.e. on ontologies shared by the IoT community is being pushed forward within several Standard Defining Organizations. For instance ETSI M2M focuses on semantic support for M2M data, OneM2M focuses on Abstraction and Semantics, and W3C on the Web of Things. One motivation of semantic abstraction resides in interacting with higher level entities rather than with sensors and actuators and thus making it possible to understand data without prior knowledge about their source (device, web service,...).
C. Semantic data processing
Semantic web technologies allow logical reasoning so that new information or knowledge can be inferred from existing assertions and rules. IoT applications will require reasoning for various purposes such as resource discovery, data ab- straction and knowledge extraction. To this purpose, specific algorithms are usually implemented within dedicated reasoners (e.g. Pellet, FACT++ and Jena) so developers do not need to be concerned with the complexities of the reasoning process itself. Examples of IoT resource discovery in the linked data can be found in [13].
We aim at applying this approach to integrating IoT Data and to experiment this approach in a real operationnal setting.
III. EXPERIMENTALSETTING
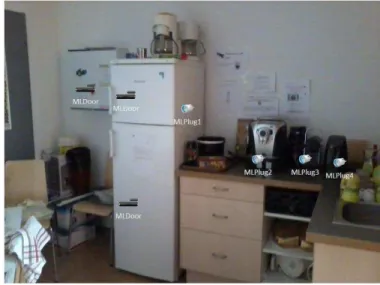
As we have set high the ambition of assessing our ap- proach in today’s home, we have based our experimental platform on an off the shelf home automation solution called Homelive [14]. Homelive allows people to manage their home appliances remotely. The Homelive pack offers a range of intelligent sensors and connected devices, brought by Orange’s partners: weather monitors, thermostats, light switches, sound and movement detectors, water leak and smoke detectors, to name but a few. We have thus instrumented a space in our building with Homelive connected devices. It is worth noting that this space was already used by people for lunch around
1 http://ontology.tno.nl/saref/
noon, coffee breaks in the morning, tea breaks in the afternoon, and for short breaks throughout the day during which people could engage informal discussions or simply get some rest. Deploying Homelive in this space didn’t have any impact on the way it was used already.
Each device is assigned a name which makes explicit its type. Thus smart plugs have been named MLPlug1, MLPlug2, MLPlug3, MLPlug4 and MLPlug5.
The pictures displayed in Fig. 1 detail where each device has been placed.
Fig. 1. Devices deployment
All these devices are wirelessly connected through the wireless communication technology Z-Wave [15]. A Home Automation Box (HAB) is a dedicated gateway which makes it possible to access these devices from the IP world as depicted in Fig. 2, and make them part of the HAN (Home Area Network). In order to further extend their reachability from the HAN to the WAN (Wide Area Network), this HAB has to be connected to another gateway, such as the white box at the bottom of the figure. In our case it was an Orange Livebox.
Fig. 2. Experimental setup
In our experimental setup, the HAB collects all devices events and forwards them to a local server which will handle the aggregation and interpretation task.
Such device events are formatted in json, following a fixed “key-value” schema. An example of such an event issued by smartplug MLPlug1 is as shown in Fig. 3
From this comprehensive event description, which consists of 10 key-value pairs, we will mainly keep the following four:
timestamp is the date the event was received by the HAB.
It is expressed as the number of seconds elapsed since jan. 1 rst , 1970 at 1:00AM.
name is the name of the device. As mentioned earlier we
made is so that the type of the sensor could be identified from its name. For instance, we know from the name MLPlug1 that the event has been issued by a smartplug.
variable is the physical parameter that the event is
about. In the event sample above, this parameter is the current electrical power consumed by the appliance it supplies. {"deviceId": "22", "deviceType": "BinaryLight", "homelive": "47122383", "id": "3", "name": "MLPlug1", "room": "A118", "service": "EnergyMetering1", "timestamp": "1428595051", "variable": "Watts", "value": "45"}
Fig. 3. Event Description in JSON
As you can notice, the above definitions of the keys are nec- essary for the reader to understand what the values associated to these keys mean, although the name of the keys have been chosen in a way that the reader would have figured out these definitions easily by himself. For an information processing system to correctly interpret an event, the meaning should be made explicit and even be embedded in the representation itself. In the section V we explain how we make this possible. But before that, in the following section we elaborate on why remaining at the basic event description is too low a level to expect any interesting interpretation of the information it conveys.
IV. TOWARDSAMORERESPONSIVEAND
INTELLIGIBLEHOME
IoT sensors are usually very talkative and versatile. For instance, in our Homelive platform, the smartplugs regularly delivers dense streams of power measurements that amount to sometimes more than 10 measures per minutes, although these smartplugs have been configured in such a way that a new measurement is issued only if the current power consummed differs from the previous measure sent by more than 10Watts. More generally Homelive devices send an event whenever a significant change in the data it measures occurs.
Such an abundance of information is superfluous to the inhabitants as well as to most smart home applications. These cumbersome data could be synthesized by applying one or more of the following policies:
• compute a mean value over a time slice of say 10mn • compute a general trend from which strong increases
and decrease could be easily detected
• or check compliancy to predetermined thresholds. such abstraction of raw data will uplift the level of information and will place it closer to the home occupants’concerns.
The main idea is that we want to bridge the gap between low level raw data and high level information, so that the step that remains to be done to make a decision or to engage an action becomes straightforward. One positive side effect not to be underrated is that through this abstraction process, we reduce the size of the information and thus reduce the traffic. The gain in traffic size is particularly high if this abstraction process is carried out close to the source of the information, i.e. close to the sensor. Having this process handled by the HAB or at least in the HAN is technically a reasonable solution. In order for a computer system to be able to process this low level data, it is necessary to reformat this data into a representation that incorporates the semantics of the data as well as the data itself. Applied to the data produced by our homelive devices, this will result into a semantic model the SmartHome data. In the next section we explain this reformatting process.
V. MANAGINGTHESMARTHOMEDATAATA
SEMANTICLEVEL
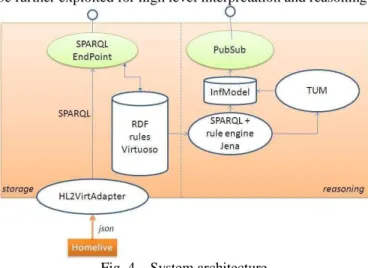
We first introduce the architecture of our system so that we get an overall perspective on where the raw data comes from, where the target semantic model will be stored and how it will be further exploited for high level interpretation and reasoning.
Fig. 4. System architecture
This architecture is depicted on Fig. 4 Input low level data is provided in a push/asynchronous mode by the Homelive HAB, which we have represented as a rectangular box on the lower left part of the diagram. As explained in section III, this data consists of a flow of independent events emitted by each Homelive device. The HAB acts as a pass-through proxy which collects events from each device and forwards them right away to the local server, which has subscribed to receive such events as mentioned earlier. Events are described in json as shown in Fig. 3 Because we use the semantic web framework and its associated modeling languages RDF/OWL, our first goal is to
interpret the data conveyed in the event description in terms of elements of these languages. An event is a piece of information that is produced by an IoT device. Thus we create a concept representing this piece of information and one representing this device. As this event is possibly not the first one produced by this device, the concept representing this device might already exists. In which case, we don’t create it but will refer to the existing one instead, as will be shown later. Each key-value pair in this description has to be properly annotated. Although those pairs are syntactically similar to each other, each of them express quite different things. For instance:
"variable": "Watts"
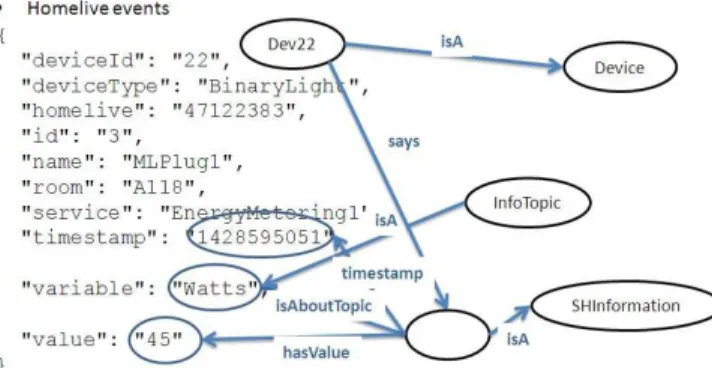
means that the event reports about a physical phe-nomenon which is related to the rate at with electrical energy is consumed. This phenomenon is not specific to the event nor to the device that has produced this event. Thus we need to relate the information conveyed by this event to a concept that models this phenomenon. So, if this concept already exists we link the concept representing this information to the concept representing the phenomenon. If it doesn’t exist we will simply create it. We call such concepts topics and create them as instances of a class called InformationTopic. The name of the link between Information instances and Informa-tionTopic instances is called isAboutTopic The rate of electrical energy consumption is a quantitative characteristic of this phenomenon, which in the OWL modeling language we model as a datatype property link.
"value": "45"
means that the target of this datatype property link should equate to the litteral value 45.
The process of semantically annotating the event description is illustrated in Fig. 5. As you see, some key-value pairs correspond to links between existing concepts, some refer
Fig. 5. Homelive data semantic annotation
to concepts that already exist or eventually that have to be created, some refer to litteral values to be assigned to concepts through links that already exist or eventually that have to be created. Such analysis can be only conducted by one or a team domain experts which collectively know the domain ontology, i.e. the catalog of concepts classes necessary to describe the application domain, the potential links between instances of these classes, and axioms that constrain the use of these links.
An example of such an axiom is that the arity of the relation hasValue is 1, which means that a piece of information can only has one value and not more. Such axioms are necessary for the system to decide on the policy to adopt upon reception of new events from a device, which has already sent events about the same topic in the past. Note that this is generally the case, because once a device has been freshly provisionned and sent its first event to report about a physical phenomenon, its job is to update this report by sending other events. If the involved relations, such as hasValue is of arity 1 (or “is a functional relation” in the OWL terminology), the current target node in the model should be removed and replaced by the new node created by the event abstraction process. The result of annotating one event description is a graph fragment consisting of a set of concepts which are classes of the ontology or instances of these classes, interrelated by relations of the ontologies. Some of these concepts are common to different events. This means that assembling these fragments together will result into a larger graph which will aggregate and relate the information conveyed by the different event to each other. This graph gives an overall account of the state of the physical environment as seen by the pool of devices collectively. We call this state the situation. Then this graph constitutes a semantic model of the situation. A user-friendly way to visualize this aggregated graph and more generally any RDF model, and to navigate along its edges is to use the Prot´eg´ editor [16]. Using this editor, the semantic model of our SmartHome data can be displayed as shown in Fig. 6. The concepts classes of the ontology are displayed as a hierarchical
Fig. 6. Navigating in the model using Protégé editor tree on the left part of the screen. On the right part, concepts, links are displayed as a graph. Instances are displayed on the right. Hovering the mouse over nodes will popup datatype properties revealing the name of the datatype link and its litteral value. Hovering the mouse over links will reveal the name of the link.
In the following section we show how this situation se-mantic model can be easily exploited to infer higher level information, which can be directly processed to improve the home occupants’ experience.
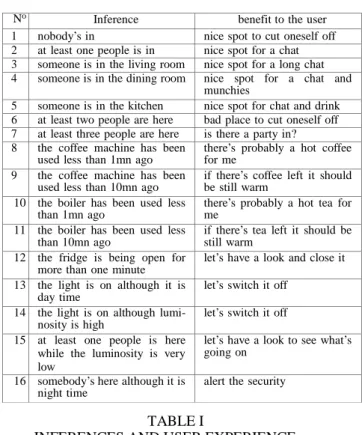
VI. HIGHLEVELINTERPRETATIONOFIOTDATA In the following table we list the inferences that can possibly be made, and for each of them, we mention the gain it
No Inference benefit to the user 1 nobody’s in nice spot to cut oneself off 2 at least one people is in nice spot for a chat 3 someone is in the living room nice spot for a long chat 4 someone is in the dining room nice spot for a chat and
munchies
5 someone is in the kitchen nice spot for chat and drink 6 at least two people are here bad place to cut oneself off 7 at least three people are here is there a party in? 8 the coffee machine has been
used less than 1mn ago
there’s probably a hot coffee for me
9 the coffee machine has been
used less than 10mn ago if there’s coffee left it should be still warm 10 the boiler has been used less
than 1mn ago
there’s probably a hot tea for me
11 the boiler has been used less than 10mn ago
if there’s tea left it should be still warm
12 the fridge is being open for more than one minute
let’s have a look and close it 13 the light is on although it is
day time
let’s switch it off 14 the light is on although lumi-
nosity is high
let’s switch it off 15 at least one people is here
while the luminosity is very low
let’s have a look to see what’s going on
16 somebody’s here although it is night time
alert the security
brings out in terms of user experience. Let’s now elaborate on how the inferences on the left of the table can be drawn.
TABLE I
INFERENCES AND USER EXPERIENCE
It would take too much space to detail the mechanism for all the inferences, so lets take the inference No14 and elaborate this particular case. Here is the basic reasoning: As shown in Fig. 1 a move detector MLMove3 has been placed behind the door, and the door itself is equipped with a door opening detector MLDoor1. If a move has been detected by MLMove3 after MLDoor1 has detected that the door has been opened, for sure somebody has entered. In order to check if the statement S:“MLMove3 has detected a move after MLDoor1 has been opened”, we have to search the situation model for some fragment which describes this statement. Searching in a RDF model amounts to query it using SPARQL query language. A sparql query is a graph pattern, i.e. a subgraph defined using the same ontology elements (concepts and relations) than the complete graph but where some of the nodes, resp. some of the links, may be defined as variables, i.e. can match any node, resp. any link, in the graph. Before elaborating the SPARQL query, lets first define the graph pattern that describe statement S. Whenever MLMove3 detects a move it sends an event which as we have seen in section V updates a piece of information which captures information about movement within MLMove3 perimeter. Information about mouvement is an instance of the class TrippedInformationTopic. We then have to search for a node which is an instance of TrippedInformationTopic and which is linked to the node that models MLMove3 device with the relation says, as according to our ontology this relation says links Information to its InformationSource. From this node we should search its value along the relation hasValue and its timestamp along the relation timestamp. This pre-liminary graph fragment, that describes this part of the search corresponds to the 6 nodes and
corresponding links on the upper part of the Fig. 7. Nodes which are searched are named with a prefix “?”. For instance, the node representing the move information has been named ?info1. This is also the case for ?move3ts which represent the timestamp of the ?info1 information. We have to do the same for searching the status of the door informed by MLDoor1 detector. This additional part of our search corresponds to the 6 nodes and corresponding links on the lower part of the figure. Now that we’ve introduced the two timestamps ?move3ts and ?door1ts, our final question is “is ?move3ts greater than ?door1ts. If the answer is yes, then we can conclude that statement S is true. To complete our graph fragment, and thus add this last question to our SPARQL query, we will use a specific mechanism that the SPARQL language provides, for combining several variables and for defining “virtual” nodes, i.e. nodes which are defined in terms of other nodes of the graph fragment. In our particular case, we introduce the “virtual” node ?nbSecFromM3ToD1 which is computed by subtracting ?door1ts’ from ?move3ts. Now that we’ve
Fig. 7. Has somebody moved in since the door has been closed?
visualized the graph pattern that represents our query it is straightforward to format it using the SPARQL language. Fig. 8 shows how the query looks like. Basically, each line in the WHERE section corresponds to an edge in the graph representation of the query as displayed in Fig. 7. Each line represents an edge as a triplet. For instance the line:
?dev1 hl:says ?info1 .
represents an edge where the source of the link has the identifier?dev1, the link has the identifier hl:says and the target of the link has the identifier ?info1. This work is ongoing.
PREFIX hl:<http://www.orange.com/ontologies/shd#> WITH GRAPH <http://fiwarelod.orange-labs.fr> SELECT ?move3value ?move3ts ?door1value ?door1ts ?nbSecFromM3toD1 WHERE {
?dev1 hl:says ?info1 . ?dev1 hl:name "MLMove3" . ?info1 hl:isAboutTopic hl:TrippedInformationTopic . ?info1 hl:hasValue ?move3value .
?info1 hl:timestamp ?move3ts . ?dev2 hl:says ?info2 . ?dev2 hl:name "MLDoor1" .
?info2 hl:isAboutTopic hl:TrippedInformationTopic . ?info2 hl:hasValue ?door1value .
?info2 hl:timestamp ?door1ts .
BIND((?door1ts - ?move3ts) AS ?nbSecFromM3toD1) }
Fig. 8. SPARQL query
We have obtained good results on few experiments which show that inferences that we make with our approach are sound. However we plan to conduct an extensive testing campain that confirm the robustness of our system.
A wider perspective and discussion on these first results are developed in the next section.
VII.DISCUSSIONANDCONCLUSION
Adopting semantic modeling technologies opens up an avenue of user experience improvements. For instance, one use case we have briefly evoked in our paper [17] but haven’t tested with real data yet is to take into account information about devices location, such as rooms where the devices are located and devices functionality, such as the nature of data the device measures and reports in case it is a sensor. Aggregating devices information into the picture makes it possible for occupants to converse with their home with questions such as “what is the temperature in the kitchen?”. This query would be decomposed into looking up all devices located in the kitchen (device location), then identifying which of those devices is a thermometer (device function) and finally retrieving the current temperature measured by this device. The answer to these 3 sub-queries can be found in the aggregated RDF graph. Widening the range of information sources beyond the IoT domain would even make possible fancier use cases. For example, if we don’t limit ourselves to the restricted scope of smart home data, as we did in the work reported here, but aggregate data from the Open Data world, we could for example find out which IKEA cupboard would fit best in kitchen, in the space between the oven and the wall. For this, we simply need the dimensions of our kitchen and its appliances (our Smart Home data) and the dimensions of IKEA products. The laters could be found on the IKEA online catalog if this catalog is available as open data. Once aggregated on the common semantic model, the respective
dimensions could be compared.
To this view, of having IoT system access open data sources, there’s of course the dual view point, of inserting the IoT in the realm of the semantic web and consider our home, our car, the city as new contributors to the semantic web by having them publish real-time information about themselves, their states, their moods, etc... By the end of the day, the philosophy would be the same: an aggregation of data
originating from the IoT and the one side and from the public Web on the other side, to form a consolidated model, and reason upon this consolidated model. The main difference is about where the aggregation takes place and who performs the reasoning, an IoT application or a Web service? Who cares? The technology to implement these processes would probably be the same and as attested by our experiments this technology is there and mature enough to be applied.
REFERENCES
[1] http://www.computerweekly.com/news/2240217788/Data-set-to-grow-10-fold-by-2020-as-internet-of-things-takes-off, 2015.
[2] IBM, “The four v’s of big data.” [Online]. Available: http://www.ibmbigdatahub.com/infographic/four-vs-big-data
[3] F. Ramparany, R. Poortinga, M. Stikic, J. Schmalenstro¨ er, and T. Prante, “An open Context Information Management Infrastructure - the IST- Amigo Project,” in Proceedings of the 3rd IET International
Conference on Intelligent Environments (IE’07), I. I. of Engineering and
Technology, Eds. Germany: University of Ulm, september 24-25 2007, pp. 398–403.
[4] A. Sorici, G. Picard, O. Boissier, A. Zimmerman, and A. M. Florea, “CONSERT: Applying semantic web technologies to context modeling in ambient intelligence,” in Computers & Electrical Engineering, April 2015, no. 44.
[5] M. Lenzerini, “Ontology-based data management,” in Proc. of CIKM 2011, 2011, pp. 5–6.
[6] T. Berners-Lee, “”linked data”,” in International Journal on Semantic
Web and Information Systems. W3C, 2006, vol. 4, no. 2.
[7] C. Bizer, H. T., and T. Berners-Lee, “”linked data - the story so far”,” in
International Journal on Semantic Web and Information Systems, 2009,
vol. 5, no. 3.
[8] O. Hartig, C. Bizer, and J. C. Freytag, “Executing sparql queries over the web of linked data,” in The Semantic Web-ISWC, Springer Berlin Heidelberg. W3C Working Group, 2009, pp. 293–309, http://www.w3.org/2009/sparql/wiki/Main Page.
[9] M. Compton, P. Barnaghi, L. Bermudez, R. Garc´ıA-Castro, O. Corcho, S. Cox, J. Graybeal, M. Hauswirth, C. Henson, A. Herzog et al., “The ssn ontology of the w3c semantic sensor network incubator group,” Web
Semantics: Science, Services and Agents on the World Wide Web, vol.
17, pp. 25–32, 2012.
[10] C. Reinisch, M. J. Kofler, F. Iglesias, and W. Kastner, “Thinkhome energy efficiency in future smart homes,” EURASIP J. Embedded
Syst., vol. 2011, pp. 1:1–1:18, Jan. 2011. [Online]. Available:
http://dx.doi.org/10.1155/2011/104617
[11] A. Fensel, S. Tomic, V. Kumar, M. Stefanovic, S. V. Aleshin, and D. O. Novikov, “Sesame-s: Semantic smart home system for energy efficiency,” Informatik-Spektrum, vol. 36, no. 1, pp. 46–57, 2013. [Online]. Available: http://dx.doi.org/10.1007/s00287-012-0665-9 [12] [Online]. Available:
http://www.sensormeasurement.appspot.com/?p=ontologies
[13] J. Pschorr, C. Henson, H. Patni, and A. Sheth, “Sensor discovery on linked data,” Proceedings of the 7th Extended Semantic Web
Conference, ESWC2010, Heraklion, Greece, vol. 30, 2010.
[14] “Homelive: Confort et domotique, maison connecte´e,” http://homelive.orange.fr.
[15] “Z-Wave: Home control,” http://www.z-wave.com.
[16] “Prote´ge´: A free, open-source ontology editor and framework for build- ing intelligent systems,” http://protege.stanford.edu/.
[17] F. Ramparany, F. G. Marquez, J. Soriano, and T. Elsaleh, “Handling smart environment devices, data and services at the semantic level with the fi-ware core platform,” in Proceeding of the 1st Workshop on
Semantics for Big Data on the Internet of Things (SemBIoT 2014). IEEE