HAL Id: hal-00665990
https://hal.archives-ouvertes.fr/hal-00665990
Submitted on 12 Feb 2013HAL is a multi-disciplinary open access archive for the deposit and dissemination of sci-entific research documents, whether they are pub-lished or not. The documents may come from teaching and research institutions in France or abroad, or from public or private research centers.
L’archive ouverte pluridisciplinaire HAL, est destinée au dépôt et à la diffusion de documents scientifiques de niveau recherche, publiés ou non, émanant des établissements d’enseignement et de recherche français ou étrangers, des laboratoires publics ou privés.
Quality of experience model for 3DTV
Wei Chen, Jérôme Fournier, Marcus Barkowsky, Patrick Le Callet
To cite this version:
Wei Chen, Jérôme Fournier, Marcus Barkowsky, Patrick Le Callet. Quality of experience model for 3DTV. SPIE Stereoscopic Displays and Applications XXIII, Jan 2012, San franscisco, United States. pp.1-6. �hal-00665990�
Quality of experience model for 3DTV
Wei Chen
1, 2, Jérôme Fournier
1, Marcus Barkowsky
2, Patrick Le Callet
21
Orange labs, France télécom R&D, 4 rue du Clos Courtel, 35512 Cesson-Sevigne, France
2LUNAM Université, Université de Nantes, IRCCyN UMR CNRS 6597, rue Christian Pauc, 44306
Nantes, France
ABSTRACT
Modern stereoscopic 3DTV brings new QoE (quality of experience) to viewers, which not only enhances the 3D sensation due to the added binocular depth, but may also induce new problems such as visual discomfort. Subjective quality assessment is the conventional method to assess the QoE. However, the conventional perceived image quality concept is not enough to reveal the advantages and the drawbacks of stereoscopic images in 3DTV. Higher-level concepts such as visual experience were proposed to represent the overall visual QoE for stereoscopic images. In this paper, both the higher-level concept quality indicator, i.e. visual experience and the basic level concepts quality indicators including image quality, depth quantity, and visual comfort are defined. We aim to explore 3D QoE by constructing the visual experience as a weight sum of image quality, depth quantity and visual comfort. Two experiments in which depth quantity and image quality are varied respectively are designed to validate this model. In the first experiment, the stimuli consist of three natural scenes and for each scene, there are four levels of perceived depth variation in terms of depth of focus: 0, 0.1, 0.2 and 0.3 diopters. In the second experiment, five levels of JPEG 2000 compression ratio, 0, 50, 100, 175 and 250 are used to represent the image quality variation. Subjective quality assessments based on the SAMVIQ method are used in both experiments to evaluate the subject’s opinion in basic level quality indicators as well as the higher-level indicator. Statistical analysis of result reveals how the perceived depth and image quality variation affect different perceptual scales as well as the relationship between different quality aspects.
Keywords: Quality of experience, 3DTV, depth of focus, image compression, subjective quality assessment.
1. INTRODUCTION
Modern 3D stereoscopic television can delivery left and right images to viewer’s left and right eye, respectively. Human vision system can take advantage of this additional information to form enhanced 3D sensation. This advance is not only a quality enhancement of the perceived image, but a fundamental change in the quality of experience – QoE of the image[1]. However, because of the limit of current stereoscopic capture, broadcast, and display technologies, there are also additional problems induced by the current 3DTV imaging technologies, e.g. the decoupling of accommodation and convergence in stereoscopic display could cause eye strain resulting in visual fatigue[2, 3].
Subjective quality assessment is the conventional method to evaluate the advantages and the problems of 3DTV. However, conventional 2D quality assessment concept – the “perceived image quality” is insufficient to reveal the benefits and the drawbacks of 3DTV. Seuntiëns et al. [4] showed that JPEG distortion has negative effects on image quality, sharpness, and eye strain, but had no effect on perceived depth. Moreover, their results showed that camera-base distance had no significant effect on perceived image quality. In [5], the same author proposed to use higher level concept – viewing experience and naturalness to assess 3D images since the added value of depth is better demonstrated when evaluating the viewing experience and naturalness. Lambooij et al. [6] advanced their work by constructing a 3D quality model in which such higher level concepts are expressed as a weight sum of image quality and depth. However, the most important negative element of 3D QoE – visual discomfort is not considered. In our previous work[7], we had proved that visual comfort is the dominant factor to decide the visual experience when visual discomfort happens. In this paper, we aim to explore the quality of experience for 3DTV by hypothesizing that the visual experience can represent the overall visual QoE of 3DTV and it can be constructed as a weight sum of image quality, depth quantity and visual comfort. The paper is organized as follows: Section 2 defines the different perceptual scales representing the basic level evaluation concepts (image quality, depth quantity and visual comfort) and the higher-level concept (visual experience) as well as proposing that the higher level concept, i.e. visual experience can be expressed as a linear function
_________________________________________
of the basic level concepts. Two experiments are designed to validate this model in the following sections. Section 3 presents the first experiment that focuses on how the perceived depth variation affects different perceptual scales of the 3D QoE. Section 4 presents the second experiment in which JPEG 2000 compression is used to create image quality distortion in order to evaluate how it affect the 3D QoEs. Conclusion and discussion are provided in Section 5.
2. QUALITY OF EXPERIENCE MODEL FOR 3DTV
As explained in [4], an appropriate 3D visual experience model should cover both positive and negative factors, allowing for a weighting of the attributes based on perceptual importance. Lambooij in [6] proposed a 3D QoE model as which higher level evaluation concept such as viewing experience, naturalness can be expressed as a weighted sum of image quality and perceived depth. By experiments, the same author validated this model and demonstrated that naturalness is determined for approximately 75% by image quality and 25% by the added value of stereoscopic depth as well as viewing experience is approximately 82% by image quality and 18% by depth so that naturalness is the more appropriate concept to evaluate 3D image. Their model can be denoted as below.
· · ⑴
with , and are representing the higher level evaluation concept, Image quality and perceived depth respectively, , are the weights of image quality and perceived depth respectively.
Although this model was proven to be able to highlight the added value of depth for stereoscopic viewing, the negative effect visual comfort problem is not considered and cannot be revealed. For example, increasing of perceived depth may cause decoupling of accommodation and convergence if perceived depth is larger than human vision system’s threshold, e.g. 0.2 or 0.3 diopter in terms of DOF(Depth of focus)[8]. In such a case, the perceptual benefit from the increased perceived depth can be nullified by the increased visual discomfort. In our previous work[9], we evaluated the depth rendering, visual comfort and visual experience in the variation of perceived depth and proved that when the quality of visual comfort is good, depth rendering is the dominant factor to visual experience. However, when the quality of visual comfort is below good, visual comfort is the dominant factor to visual experience. Kooi et al. [8] showed that imperfections such as vertical disparity could cause serious viewing discomfort resulting on the degradation on the overall QoE, but not affect the image quality and perceived depth. Above all since the visual comfort can be evaluate independently as image quality and perceived depth, it can be added into equation 1 and the equation 1 can be rewritten as below:
· · · ⑵
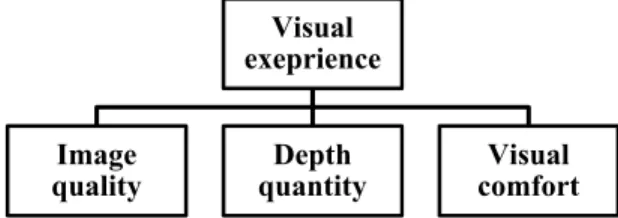
with is representing the visual comfort and is representing its weight. The 3D QoE model is also visualized in Figure 1.
Figure 1. 3D quality model as constructing the visual experience as a function of image quality, depth and visual comfort
The rationale behind the equation 2 is that the viewers are able to evaluate the change in perceived image quality, perceived depth and visual comfort independently and generate the overall 3D QoE as the higher-level concept. In this paper, we focus on the relation between the higher-level concept – visual experience that is defined to represent the overall visual QoE for 3DTV and the basic level quality factors including image quality, depth quantity and the visual
Visual exeprience Image
comfort, which are more directly related to physical parameters. All the quality indicators used in this paper are defined as below:
Visual experience: is defined as the overall quality of experience of the images in terms of immersion and the overall
perceived quality.
Image quality: is related to the quality of rendering of texture, the level of visibility of visual artifacts and rendering
details.
Depth quantity: the amount of the perceived depth using the combination of monocular and binocular depth cues. Visual comfort: visual discomfort is related to multi-symptoms, e.g. eye strain, dry eyes, double vision. Variation of
visual comfort can be perceived as the sensation of visual impairment as well as the sense of vision difficulties when moving the fixation point from one area of the image to another area (due to the decoupling of accommodation and convergence).
The next step is to validate this model and determine the weights , , . Two experiments were designed to achieve this goal. The first experiment considers the variation of perceived depth in terms of DoF around the visual comfort threshold (0.2 diopter). The second experiment is aim to explore how variation of image compression affect the 3D QoE.
3. EXPERIMENT 1
In the first experiment, we aimed to explore how binocular depth variations affect the QoE of 3D images. The natural scenes captured by two professional 2D cameras and 3D rigs (mirror rig and side-by-side rig) were used as the stimuli. In some previous research [4, 10-13], the perceived depth variation is corresponding to the camera baseline, but not aligned to the final perceived depth. In this paper, for each scene, four levels perceived depth variation in terms of DoF, 0, 0.1,0.2 and 0.3 diopter are produced by controlling the shooting parameters in accordance with the scene contents [7].
3.1 Methodologies
1) Test sessions: the test consisted of four sessions corresponding to the four 3D QoE indicators defined in Section 2. In
order to avoid interaction between the QoE indicators and in order to avoid accumulating visual discomfort, the whole test was separated into two parts that were conducted on two different days. The first part was composed of two sessions: image quality and visual comfort. The second part also consisted of two sessions: visual experiences and depth quantity. For each session, there were 4 × 3 (DoF × scene) images presented to viewers for rating. The 12 stimuli were individually randomized for each perceptual scale.
2) Equipment: the subjective assessment was conducted in a test room, which is compliant with the recommendations for subjective evaluation of visual data issued by ITU-R BT.500 [14]. A 46 inches line-interleaved stereoscopic television (Hyundai model S465D) with a native resolution of 1920x1080 pixels was used as the final visualization terminal. The viewing distance was fixed to 2.6 meter referred to 4.5 times of display height. The depth rendering ability of this display had been analyzed in [9] which showed an overall good depth rendering ability. A digital video system (DVS) which can output 1920x1080 HD signals was used to play the 3D content in a line interleaved mode.
3) Observers: 28 observers were recruited to participate in this test. All of them were non-experts in the audiovisual and
video domain. A vision test was performed on all testers to determine their visual performance and the potential impact on results. The test includes monocular visual acuity test, hyperopic trend, astigmatic trend, binocular distant vision acuity, dysphasia, fusion, stereoacuity and color vision. All observers had a normal or corrected to normal visual acuity(better than 1 min of arc) and normal stereoacuity above(better than 2 min of arc ) .
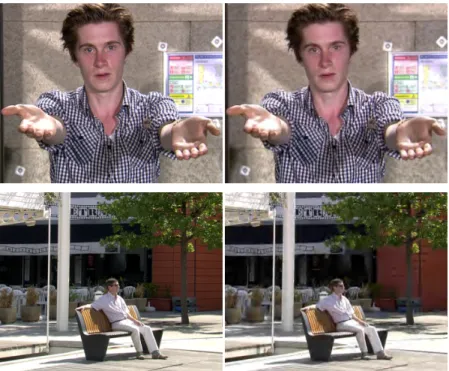
4) Stimuli: the image materials used in this experiment consisted of three natural scenes as shown in Figure 2. For each scene, there were four still images representing the final perceived depth as DoF 0, 0.1, 0.2 and 0.3 diopters respectively as described. The left view of the stereoscopic image representing 0.1 diopter DoF was used as a 2D image, also referred to as 0 diopter image. 4 × 3 (DoF × scene) images were presented in each test session.
Figure 2. three natural scenes used in experiment 1: (left) interview (mid) Basket (right) Bench
5) Procedure: written instructions detailing the task what the observer had to perform and the attributes they were asked to rate were given to the subjects before the start of the test. The experimenter reiterated these instructions to ensure the observer understood the task. Subjective assessment methodology for Video Quality (SAMVIQ) [15] was used to evaluate each test condition on each perceptual scales. For each test session, the subjects evaluated three scenes, which have four stimuli in each scene. For each scene, the subject could see all four stimuli and rate their perceptual opinions. These stimuli were shown as buttons (A, B, C and D) and subjects could examine them respectively. The buttons were randomly reassigned to stimuli so that the subjects could not identify them. Each stimulus was shown with a fixed duration of 7s and subjects were asked to rate the evaluation criteria on a continuous scale labeled with the adjective terms [bad]-[poor]-[fair]-[good]-[excellent] according to the ITU-R BT.500. Specifically for the evaluation of depth quantity, a numerical scale from 0 to 100 was used. In this case, the subject was required to identify the stimulus that had the largest depth sensation as 100 and then rated the other stimuli proportionally compared to this stimulus. Subjects were able to modify freely their scores within the four presented stimuli before continuing to the next scene.
3.2 Result analysis
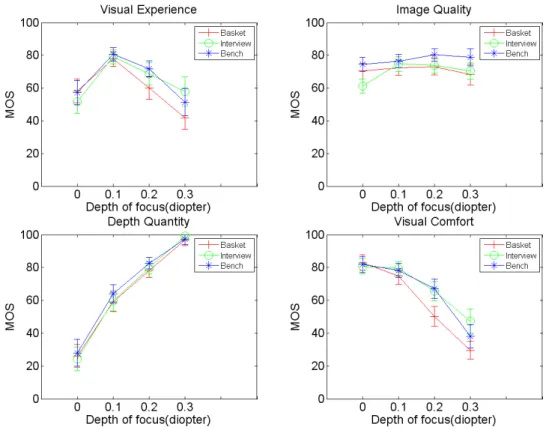
Figure 3. MOS (with their 95% confidence intervals) vs variation of DoF for different scenes(Basket, Inteview and Bench are
representing with different color line and different marker as show in the top right legend in each sub-figure.)
Figure 2 depicts the MOS (mean opinion score) with their 95% confidence intervals per quality indicator as a function of DoF (increasing along the x-axis) for each scene. One-way ANOVA analysis was performed with DoF as independent
variable and MOS per quality indicator as dependent variable as well as two-way interaction were included. The statistical analysis results show that image quality (F = 1.16, p < 0.386) is not affected by the variation of binocular depth. The result of depth quantity (F = 663.95, p < 0.001) indicated that the subject can easily distinguish different perceived depth range. In addition, with the increase of perceived depth, visual comfort (F = 26.70, p < 0.001), decreases significantly. Visual experience (F = 16.825, p < 0.002) are also significantly affected by the binocular depth variation, but not linearly. When increasing the perceived depth, in the beginning 3D shows advantages over 2D image, e.g. DoF 0 (as 2D) is rated as “fair” in visual experience while in DoF 0.1 condition it is scored between “good” and “excellent”. However, when the perceived depth is higher than DoF 0.1, these advantages seem to be nullified as viewing experience score is decreasing with the increase of DoF. The result and discussion with the viewers confirmed that visual comfort should be the main concern that reduced the advantage of added depth.
3.3 Qualification of the 3D model
Table I. standardized weighted coefficient
IQ D VC R square
Visual experience Standardized Coefficients 0.074(a) 1.307 1,691 0.89
Normalized(b) 0.43 0.57
(a) Insignificant ; (b)normalized to a sum of one.
Figure 4. Regession predicted value vs Observed value in experiment 1
A standardized linear regression analysis was applied to 3D QoE model that was depicted in Figure 1 and mathematically represented as Equation 2 by the data shown in Figure 4. It is important to clarify the main objective of this paper is less relevant to define an objective quality assessment metric by modelling precisely how each physical parameter affect different perceptual scales. We are more interested in revealing that visual experience as well as the overall 3D visual QoE can be constructed by three basic level perceptual aspects including image quality, depth quantity and visual comfort. The standardized weighted coefficients extracted from the linear regression are presented in Table I as well as the observed values versus regression predicted values for visual experience are visualized in Figure 4. The linear solution was good enough (R square >0.89) to model the relationship between visual experience and the basic level quality indicators. The weighted coefficient of image quality is close to 0 and it is insignificant (p<0.646) in this model which confirmed the result that image quality is not affected by the variance of perceived depth. The normalized
weight coefficient showed that for depth variation in terms of DOF, visual experience could be modeled as a sum by 43% of depth quantity and 57% of visual comfort.
4. EXPERIMENT 2
The second experiment aimed to investigate how the 2D image distortion variation affects the 3D QoE. The images of the Interview and Bench scenes, which were rated as “excellent” visual experience in experiment 1, are used in experiment 2. The 2D image distortions are stimulated by JPEG2000 compression in different compression ratio.
4.1 Methodologies
1) Test session: the test design is similar to the experiment 1. The test was consisted of four sessions corresponding to four perceptual scales including visual experience, visual comfort, image quality and depth quantity. For each session, there are 5 × 2 × 2 (Compression level × [2D, 3D] ×scene) images presented to viewer to rate. For each scene, 2D and 3D stimuli are mixed and randomized. The undistorted 3D image is used as the empirical reference in order to ease the viewer’s evaluation.
2) Equipment: the test environment and the test equipment is the same as the experiment 1.
3) Observers: 30 observers were recruited to participate in this test. All of them were non-experts in the audiovisual and
video domain. The same vision test as experiment 1 were implemented before the experiment to guarantee that the viewers had a normal visual acuity and normal stereoacuity.
4) Stimuli: the image materials used in this experiment consisted of Interview and Bench scene as shown in Figure 1. For each scene, the DoF 0.1 images that were rated as “excellent” visual experience in experiment 1 were used as the undistorted 3D images. Moreover, the left view of DoF 0.1 images was used as the undistorted 2D images. The undistorted images were then compressed in five different JPEG2000 compression ratios as 0, 50, 100, 175 and 250 by JasPer JPEG2000 compression software[16]. Figure 5 depicts the images in panels that were used in experiment 2. , thus 20 (Compression level × 2 ×scene) still pictures were presented in each test session.
Figure 5. Still pictures used in experiment 2, Interview and Bench are shown in panels: (top) interview original versus compressed
(buttom) Bench original versus compressed
4.2 Result analysis
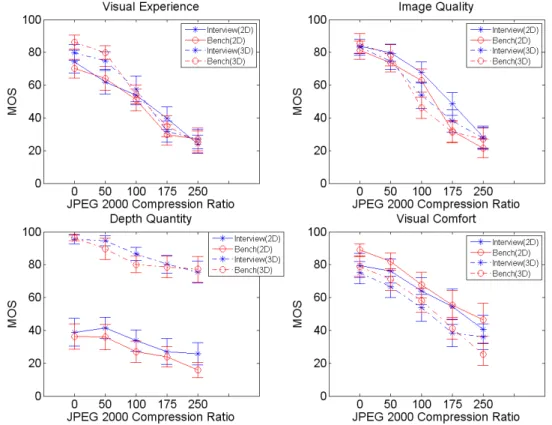
Figure 6 depicts the MOS with their 95% confidence intervals per quality indicator as a function of JPEG 2000 Compression Ratio (increasing along the x-axis) for each scene. One-way ANOVA analysis was performed with JPEG 2000 compression ratio as independent variable and MOS per quality indicator as dependent variable. The statistical results show that variation of 2D image quality by compression is significant for the change of visual experience (F=66.50, p<0.001), visual comfort (F=23.50, p<0.001) and image quality (F=68.03, p<0.001), however, insignificant for depth quantity (F=0.25, p<0.91). Furthermore, if comparing the 2D and 3D conditions, there is no doubt that 3D provide better depth than 2D although with the increase of compression distortion, the MOS score decreases slightly. It could be explained by that in the television viewing distance (< 5 meters), people are more sensitive to the binocular depth cue[17] as well as binocular depth cue will not be destroyed by the JPEG 2000 compression. Even in 250 compression ratio case, 3D is still rated as 80 better than the 2D in undistorted condition that is rated as 40. For image quality, with the increase of compression ratio the MOS of 3D drops faster than the 2D. It may be due to the added 3D artifacts in depth, which reduce the sharpness and could be counted into the distortion of image quality. The similar trend is observed in visual comfort scale. It could be explained by that blur and 3D artifacts produced by compression may cause depth cue contradiction resulting on more visual annoyance. For visual experience, when the compression ratio is smaller than 100, 3D show advantages than 2D. However, when the compression rate is higher than 100, 3D drops even worse than 2D as shown in Figure 6. Concerning that the 175 compression ratio, 2D images are rated between fair and poor while 3D ones are rated directly as poor.
Figure 6. MOS (with their 95% confidence intervals) vs variation of JPEG 2000 compression ratio for different scenes and different
conditions (2D is solid line and 3D is in dashed line; Interview scene is in “star” marker and Bench scene is in “circle” marker)
4.3 Qualification of the 3D model
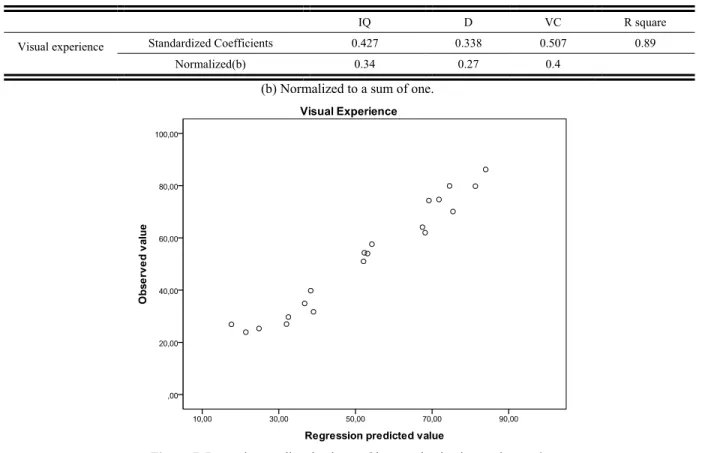
The linear regression result applied to the data depicted in Figure 6 is outlined in Table II. Figure 7 depicts the observed visual experience vs. regression predicted visual experience. In case of image quality variation by JPEG 2000 compression as well as two level of depth variation(2D vs. DoF 0.1), the entire basic quality indicators are significant
(p<0.006) to model the higher level concept as visual experience can be determined by 34% of image quality, 27% of depth rendering and 40% of visual comfort.
Table II standardized weight coefficient
IQ D VC R square
Visual experience Standardized Coefficients 0.427 0.338 0.507 0.89
Normalized(b) 0.34 0.27 0.4
(b) Normalized to a sum of one.
Figure 7. Regession predicted value vs Obeserved value in expeirment 2 5. CONCLUSION AND DISCUSSION
In this paper, we aim to explore the quality of experience model for 3DTV as preliminarily hypothesizing that the overall visual QoE for 3DTV as defined as visual experience can be expressed as a weight sum of image quality, depth quantity and visual comfort. This hypothesis was validated by means of two experiments in which perceived depth in terms of DoF and image quality in terms of JPEG 2000 compression are varied. The results confirmed firstly that visual comfort is an important factor which cannot be ignored for modeling the QoE for 3DTV since in two experiments, the visual comfort are both the dominant factor of visual experience (57% in experiment 1 and 40% in experiment 2) compared to the other factors. Secondly, in case of perceived depth variation, the coefficient of linear fitting showed that visual experience was determined by 43% from depth quantity and 57% from visual comfort whereas for the experiment of image quality variation, which also combines 2 levels of depth variation (2D and DoF 0.1), visual experience can be predicted by 34% from image quality, 27% from depth rendering and 40% from visual comfort.
The further research proposal is to combine the results from experiment 1 and experiment 2 to evaluate more level of image variation on different level of perceived depth in order to predict a more general model for the 3D QoE.
ACKNOWLEDGEMENTS
The authors would like to thank French National project -3Dlive [18] for the support of the experiment content (natural scene) acquisition and post-production.
REFERENCE
[2] S. Yano, S. Ide, T. Mitsuhashi, and H. Thwaites, "A study of visual fatigue and visual comfort for 3D HDTV/HDTV images," Displays, vol. 23, pp. 191-201, 2002.
[3] S. Yano, M. Emoto, and T. Mitsuhashi, "Two factors in visual fatigue caused by stereoscopic HDTV images,"
Displays, vol. 25, pp. 141-150, 2004.
[4] P. Seuntiëns, L. Meesters, and W. Ijsselsteijn, "Perceived quality of compressed stereoscopic images: Effects of symmetric and asymmetric JPEG coding and camera separation," ACM Trans. Appl. Percept., vol. 3, pp. 95-109, April 2006.
[5] P. J. Seuntiëns, I. E. Heynderickx, W. A. Ijsselsteijn, P. M. J. van den Avoort, J. Berentsen, I. J. Dalm, M. T. Lambooij, and W. Oosting, "Viewing experience and naturalness of 3D images," in Three-Dimensional TV, Video, and
Display IV, Boston, MA, USA, 2005, pp. 601605-7.
[6] M. Lambooij, W. Ijsselsteijn, D. G. Bouwhuis, and I. Heynderickx, "Evaluation of Stereoscopic Images: Beyond 2D Quality," Broadcasting, IEEE Transactions on, vol. 57, pp. 432-444, 2011.
[7] W. Chen, J. Fournier, M. Barkowsky, and P. L. Callet, "New stereoscopic video shooting rule based on stereoscopic distortion parameters and comfortable viewing zone," in Stereoscopic Displays and Applications XXII, San francisco, 2011.
[8] F. L. Kooi and A. Toet, "Visual comfort of binocular and 3D displays," Displays, vol. 25, pp. 99-108, 2004.
[9] W. Chen, J. Fournier, M. Barkowsky, and P. L. Callet, "New requirements of subjective video quality assessment methodlogies for 3DTV," in Fifth International Workshop on Video Processing and Quality Metrics for Consumer
Electronics - VPQM 2010, Scottsdale, Arizona, U.S.A., 2010.
[10] W. A. IJsselsteijn, H. de Ridder, and J. Vliegen, "Subjective evaluation of stereoscopic images: effects of camera parameters and display duration," Circuits and Systems for Video Technology, IEEE Transactions on, vol. 10, pp. 225-233, 2000.
[11] P. J. H. Seuntiëns, L. M. J. Meesters, and W. A. Ijsselsteijn, "Perceptual attributes of crosstalk in 3D images,"
Displays, vol. 26, pp. 177-183, 2005.
[12] L. Goldmann, F. De Simone, and T. Ebrahimi, "A comprehensive database and subjective evaluation methodology for quality of experience in stereoscopic video," San Jose, California, USA, 2010, pp. 75260S-11.
[13] L. Goldmann, F. D. Simone, and T. Ebrahimi, "Impact of acquisition distortions on the quality of stereoscopic images," in Fifth International Workshop on Video Processing and Quality Metrics for Consumer Electronics - VPQM
2010, Scottsdale, Arizona, U.S.A., 2010.
[14] ITU, "Methodology for the subjective assessment of the quality of television pictures," in Recommendation BT
500-11, ed: International Telecommunication Union., 2002.
[15] J. L. Blin, "New quality evaluation method suited to multimedia context SAMVIQ," in The Second International
Workshop on Video Processing and Quality Metrics for Consumer Electronic, Phoenix,Arizona, 2006.
[16] M. D. Adams. JasPer Project. Available online: http://www.ece.uvic.ca/~frodo/jasper/
[17] J. E.Cutting and P. M.Vishton, "Perceiving layout and knowing distances: The integration, relative potency, and contextual use of different information about detph," in Handbook of perception and cognition. vol. 5, E. W. and R. S., Eds., ed San Diego: Academic Press, 1995.