HAL Id: hal-02902341
https://hal.archives-ouvertes.fr/hal-02902341
Submitted on 6 Nov 2020HAL is a multi-disciplinary open access archive for the deposit and dissemination of sci-entific research documents, whether they are pub-lished or not. The documents may come from teaching and research institutions in France or
L’archive ouverte pluridisciplinaire HAL, est destinée au dépôt et à la diffusion de documents scientifiques de niveau recherche, publiés ou non, émanant des établissements d’enseignement et de recherche français ou étrangers, des laboratoires
FeWO 4 Electrode Material by Operando X-Ray
Absorption Spectroscopy
Nicolas Goubard-bretesché, Olivier Crosnier, Camille Douard, Antonella
Iadecola, Richard Retoux, Christophe Payen, Marie-Liesse Doublet, Kazuaki
Kisu, Etsuro Iwama, Katsuhiko Naoi, et al.
To cite this version:
Nicolas Goubard-bretesché, Olivier Crosnier, Camille Douard, Antonella Iadecola, Richard Re-toux, et al.. Unveiling Pseudocapacitive Charge Storage Behavior in FeWO 4 Electrode Material by Operando X-Ray Absorption Spectroscopy. Small, Wiley-VCH Verlag, 2020, 13, pp.2002855. �10.1002/smll.202002855�. �hal-02902341�
Unveiling Pseudocapacitive Charge Storage Behavior in FeWO4 Electrode Material by
Operando X-ray Absorption Spectroscopy
Nicolas Goubard-Bretesché, Olivier Crosnier, Camille Douard, Antonella Iadecola, Richard Retoux, Christophe Payen, Marie-Liesse Doublet, Kazuaki Kisu, Etsuro Iwama, Katsuhiko Naoi, Frédéric Favier,and Thierry Brousse*
Dr. N. Goubard-Bretesché, Dr. O. Crosnier, C. Douard, Prof. C. Payen, Prof. T. Brousse Institut des Matériaux Jean Rouxel (IMN), CNRS UMR 6502 – Université de Nantes, Nantes, France
E-mail: [email protected] Dr. M.-L. Doublet, Dr. F. Favier
Institut Charles Gerhardt, Univ. Montpellier, CNRS, ENSCM, Montpellier, France
Dr. N. Goubard-Bretesché, Dr. O. Crosnier, C. Douard, Dr. A. Iadecola, Dr. M.-L. Doublet, Dr. F. Favier, Prof. T. Brousse
Réseau sur le Stockage Electrochimique de l’Energie, CNRS FR 3459, 80039 Amiens Cedex, France
Dr. R. Retoux
CRISMAT-CNRS/UMR 6508, ENSICAEN, Université de Caen Basse-Normandie, France Dr. K. Kisu, Dr. E. Iwama, Prof. K. Naoi
Advanced Capacitor Research Center, Tokyo University of Agriculture & Technology, 2-24-16 Naka-cho, Koganei, Tokyo 184-8588, Japan
Dr. K. Kisu, Dr. E. Iwama, Prof. K. Naoi, Prof. T. Brousse
Global Innovation Research Organization, Tokyo University of Agriculture & Technology, 2-24-16 Naka-cho, Koganei, Tokyo 184-8588, Japan
Keywords: FeWO4, Operando, X-ray absorption spectroscopy, electrochemical capacitors,
In nano-sized FeWO4 electrode material, both Fe and W metal cations are suspected to be
involved in the fast and reversible Faradaic surface reactions giving rise to its pseudocapacitive signature. As for any other pseudocapacitive materials, to fully understand the charge storage mechanism, a deeper insight into the involvement of the electroactive cations still has to be provided. The present paper illustrates how operando X-ray absorption spectroscopy (XAS) has been successfully used to collect data of unprecedented quality allowing to elucidate the complex electrochemical behavior of this multicationic pseudocapacitive material. Moreover, these in-depth experiments were obtained in real time upon cycling the electrode, which allowed investigating the reactions occurring in the material within a realistic timescale, which is compatible with electrochemical capacitors practical operation. Both Fe K-edge and W L3-edge measurements point out the involvement of the
Fe3+/Fe2+ redox couple in the charge storage while W6+ acts as a spectator cation. The result of this study enables to unambiguously discriminate between the Faradaic and capacitive behavior of FeWO4. Beside these valuable insights toward the full description of the charge
storage mechanism in FeWO4, this paper demonstrates the potential of operando X-ray
absorption spectroscopy to enable a better material engineering for new high capacitance pseudocapacitive electrode materials.
1. Introduction
Electrochemical capacitors (ECs) have been introduced in the wide family of electrochemical energy storage devices 60 years ago, since the patent granted to Becker in 1957. [1] Unlike their battery counterpart, they can store or deliver energy within short periods of time, typically ranging from few milliseconds up to hundreds of seconds. Subsequently, they complement batteries when a short time scale is required for a specific use such as
powering the emergency opening of airplane doors, or supplying electricity in uninterrupted power supply systems. [2] Almost all commercial ECs are manufactured using activated carbon as the active electrode material. The charge storage in such a device occurs through an accumulation of ions at the interface of both electrodes with the electrolyte. [3] The intriguing dynamics of ions in the carbon meso or microporosity as well as at the carbon surface have been widely investigated by the use of in situ or operando techniques such as infrared spectroscopy, [4] electrochemical quartz crystal microbalance,[5] or X-ray absorption spectroscopy (XAS),[6] among others.
On the other hand, pseudocapacitive materials, i.e. compounds whose peculiar charge storage mechanism involves surface and/or subsurface fast and reversible redox reactions,areof great interest in the field, as they allow reaching greater capacitance values than carbon materials, especially from a volumetric point of view.[7] However, the origin of the electrochemical behavior of pseudocapacitive compounds [8] is still under debate since only few experiments have confirmed its Faradaic origin. Even fewer studies aimed at investigating such a behavior while the cell is operated at a realistic cycling rate, i.e. within few seconds or few tens of seconds. While a better knowledge of the electrochemical phenomena occurring at/in pseudocapacitive electrodes will provide fundamental insights, it should also help to design new compounds for high capacitance devices.
Nowadays, tremendous efforts are being made to improve the energy density of ECs based on pseudocapacitive materials without compromising either their power density or cycling ability. As such, new materials are regularly emerging and, most recently, multicationic oxides were proposed as high volumetric capacitance electrode materials for ECs operated in aqueous electrolytes. [9] The combination of an electroactive element with high density species can lead to attractive volumetric capacitance values without being detrimental to both cycling rate and stability. Iron tungstate (FeWO4) has demonstrated a capacitive-like
electrochemical signature over long-term cycling operation,[10] but the involvement of W and Fe cations in the charge/discharge mechanism has not been established yet.
As a matter of fact, early in situ ruthenium K-edge XAS was used to evidence the change in the ruthenium oxidation state upon polarizing a RuO2 electrode at various potentials.[11] The
same technique shed light on the role of Mn cations in the charge storage mechanism in MnO2
thin films,[12] involving a continuous and reversible change in Mn oxidation state and supporting the results previously obtained by ex situ XPS analyses on these materials. [13] More recently, similar conclusions were obtained with in situ XAS experiments at the titanium K-edge in the pseudocapacitive behavior of Ti3C2 MXene material in sulfuric acid. [14]
In all these materials, the role of structural cations was pointed out. However, there are still ambiguous concerns to be solved, namely (i) the evidence of changes in the cation oxidation state while operating the cell in a realistic timeframe and (ii) the role of each cation when multicationic oxides are considered such as in FeWO4. Indeed, despite the importance
of such findings obtained by in situ XAS, each data set was recorded after at least 15-20 minutes polarization of the electrode at a given potential. Unfortunately, the in situ approach does not allow to depict the dynamics of an electrode upon cycling and its (electro)chemical response to a realistic electrochemical solicitation. To the best of our knowledge, operando Raman spectroscopy [15] is currently the only analytical technique that has been used on a pseudocapacitive material (MnO2) and that reasonably fits with EC electrode cycling rates,
but without giving access to the change in manganese oxidation state, unfortunately.
For the above-mentioned reasons, quick-XAS experiments performed under operando conditions (i.e. when the cell is in a realistic operation mode) is the best approach to investigate the fast processes occurring in pseudocapacitive EC electrode materials. To get a chance to evidence the studied phenomenon, it seems reasonable to assess the data collection
operando XAS measurements on battery electrodes, data acquisition times of a few minutes per spectrum for a charge or discharge at a C/10 rate (i.e. 1 mole of ion exchanged in 10 hours) have been used. [17] When translated to the fast cycling rate of EC electrodes, the time scale is reduced to only a few seconds per spectrum and compatible only with the fast data acquisition capabilities achieved with the quick-XAS setup.
In the present work, we fully describe the electrochemical charge storage mechanism in FeWO4, thanks to the analysis of high quality XAS data gained using operando quick-XAS
measurements at both Fe and W K and L3 –edges, respectively. Beside the elucidation of the
respective roles of Fe and W metal cation centers in its electrochemical behavior, this study sets FeWO4 as an example of how the contribution of cations can be unveiled during the
cycling of the electrode by using this advanced spectroscopic operando technique.
2. Results and discussion
Nanosized FeWO4 was synthesized using a microwave-assisted coprecipitation route with
water as the solvent. A poorly crystallized material is obtained, as it can be seen from the XRD diagram (Figure 1A) and from the TEM observations (Figure 1B and 1C) with 10-15 nm particle size and a specific surface area of 73 m².g-1 (Table S1). After mixing the FeWO4
powder with conductive carbon black and PTFE binder (60:30:10 weight ratios), thick self-supported electrodes (FeWO4 mass loading = 10.0±0.3 mg.cm-2) were manufactured.
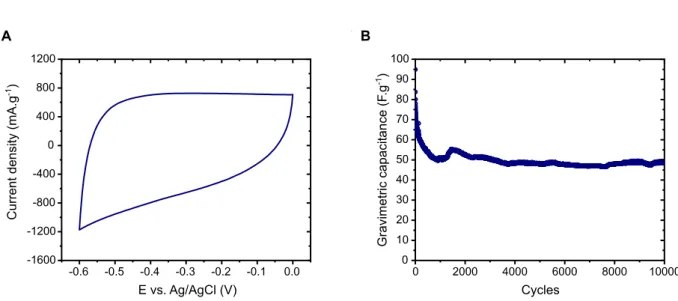
Preliminary electrochemical investigations have demonstrated the capacitive-like signature of such an electrode (Figure S1A) as well as an impressive cycling ability (Figure S1B), thus confirming the choice of FeWO4 nanopowder-based electrode as a typical potential
pseudocapacitive compound.
Before running operando XAS measurements, these electrodes were placed in a specially designed in situ cell (Figure S2) and soaked in the electrolyte for several minutes at
open-circuit potential (OCP) (reference electrode Ag/AgCl (3M NaCl); counter electrode: platinum wire). Under such in situ conditions, X-ray absorption spectra were acquired at both Fe K-edge and W L3-edge to determine the valence of iron and tungsten, respectively, in the
pristine material at the OCP. The corresponding spectra are presented in Supporting Information (Figure S3A and S4). Since the oxidation state of an absorbing element varies linearly with the energy of its absorption edge, it is therefore possible to monitor the evolution of the oxidation state during cycling by following the edge energy shift. For a higher oxidation state of the studied element, a corresponding edge shift at higher energy values is expected, and vice versa for the lower oxidation state. At OCP, the edge position of the Fe K-edge X-ray absorption near K-edge structure (XANES) spectrum of as-prepared FeWO4
overlaps with that of hematite (Fe3+), which is consistent with the Fe oxidation state determined by Mössbauer spectroscopy (Fe3+, see Figure S3B). One can see that Fe2O3
spectrum displays a shoulder (between ca. 7122 and 7125 eV) after which both FeWO4 and
Fe2O3 spectra are superimposed. This feature is common for iron-containing materials and can
be attributed to spurious electronic effect related to the different local geometries (typically 1s 4s transitions). [18]
Moreover, the presence of the pre-peak features at about 7114 eV in the pristine sample confirms the distorted FeO6 octahedral environment typical of Fe3+ oxidation
state. To evaluate the W oxidation state at OCP, a WO3 powder was used as a reference, and
the maximum of the derivative of its W L3-edge overlaps with that of the pristine sample,
confirming that tungsten is at a +6 oxidation state. This observation is consistent with previous XAS and XPS studies performed on nanosized iron tungstates, [19] and suggests that cationic (Fe or W) vacancies should occur in the material to compensate the anionic charge. First-principles DFT+U calculations performed on the stoichiometric FeWO4 phase clearly
point iron rather than tungsten as the deficient metal in this structure (see Figure S5). The Density of States computed for FeWO4 displays a very narrow band at the Fermi level which
corresponds to highly localized Fe(d)-states and suggests that polarons can easily form in this system. This result is fully consistent with a thorough study recently reported on the electronic structure of FeWO4 in which the pseudocapacitive behavior of FeWO4 was predicted to be
linked to the formation of hole polarons at the Fe-sites together with dominant native point defects on the iron sites. [20] From now on, the non-stoichiometric Fe1-xWO4 will then be
written as ⊡𝑦𝐹𝑒(1−3𝑦)𝐼𝐼 𝐹𝑒2𝑦𝐼𝐼𝐼𝑊𝑂4, ⊡𝑦 being the content of Fe-vacancies in the material. A
simple electron count shows that y varies from 0 to 1/3 when going from the pure FeII phase (FeIIWO4) to the pure FeIII phase ⊡1 3⁄ 𝐹𝑒2 3𝐼𝐼𝐼⁄ 𝑊𝑂4, all intermediate corresponding to mixed
FeII/FeIII valence. Combining these results with Mössbauer and XANES data (100% Fe3+ in our sample), the iron tungstate material presented herein would display the formula ⊡1 3⁄ 𝐹𝑒2 3𝐼𝐼𝐼⁄ 𝑊𝑂4. To experimentally confirm this theoretical statement, an elemental analysis
of the material was carried out using ICP-OES spectroscopy (see Table S2) and confirmed a Fe/W molar ratio of 0.68, close to expected for a 100% Fe3+-containing iron tungstate.
Figure 1: (a) XRD pattern of FeWO4 synthesized via micro-wave assisted coprecipitation
route. The main peak reflections are indexed; (b) TEM and (c) HRTEM images of FeWO4
particles.
The electrodes were then electrochemically tested by cyclic voltammetry in a 5M LiNO3
aqueous electrolyte (pH = 6.5) at a scan rate of 10 mV.s-1, from -0.6 to 0 V vs. Ag/AgCl. [10a] Interestingly, the electrode material exhibits a capacitance of 100 F.g-1 for the first cycle. This capacitance decreases upon the first 1000 cycles and stabilizes at 50 F.g-1 which isca. 1.5 times larger than previously reported by us for ⊡𝑦𝐹𝑒(1−3𝑦)𝐼𝐼 𝐹𝑒2𝑦𝐼𝐼𝐼𝑊𝑂4 electrode prepared with
a polyol-mediated synthesis [10a] which may be due to a larger amount of structural defects as depicted from XRD analysis. As demonstrated later on, the pseudocapacitance experimentally measured is directly related to the concentration of native point defects in the ⊡𝑦𝐹𝑒(1−3𝑦)𝐼𝐼 𝐹𝑒
2𝑦𝐼𝐼𝐼𝑊𝑂4 (FWO) system which explains the discrepancies in the capacitance
values displayed by iron tungstate depending on its synthesis route. During this potentiodynamic cycling, XAS spectra were continuously collected at both tungsten L3-edge
and iron K-edge. To increase the signal-to-noise ratio of the XAS spectra, only an "average" spectrum calculated by averaging 20 consecutive spectra is considered. This translates into one average spectrum every 100 mV (i.e. every 10 s) when cycling at 10 mV.s-1 as depicted in
Figure 2. Therefore, this procedure allows to accurately tracking changes in both Fe and W
absorption spectra induced in potentiodynamic conditions. Further information concerning the XAS data collection procedure can be found in the experimental section.
Figure 2: Cyclic voltammogram of the iron tungstate electrode cycled at 10 mV.s-1 in 5M LiNO3 aqueous electrolyte (reference electrode Ag/AgCl; counter electrode: platinum wire).
The open dots represent the XAS spectra acquisition rate (1 spectrum every 0.5 s), the full dots corresponding to the average of 20 spectra for clarity purpose (1 averaged spectrum every 10 s).
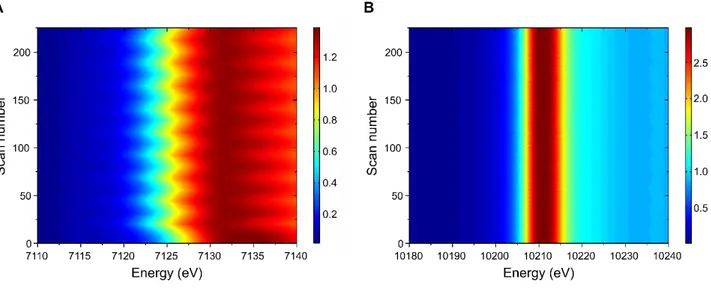
Figure 3A shows the operando XANES spectra obtained at Fe K-edge for the iron tungstate
electrode during the acquisition of a cyclic voltammogram. A closer insight to the edge region reveals a significant shift of the Fe K-edge toward lower energy values upon cathodic scan of the electrode (Figure 3B), and a shift toward higher energy upon anodic scan. Moreover, the pre-peak feature, which is the signature of distorted Fe3+O6 geometry in the pristine material,
progressively disappears upon electrode reduction in favor of a regular of Fe2+O6 coordination
(inset, Figure 3A). As well established for the 3d metals, [18] the energy shift of the edge position is directly related to the Fe oxidation state change, which, in our case, ranges between Fe3+ to Fe2+. Since the electrodes were first cycled toward a cathodic scan, these observations can be summarized as follows: when the potential of iron tungstate electrodes is decreased from 0.0 V vs. Ag/AgCl to lower values, part of the Fe3+ in is reduced to Fe2+ leading to a shift of the Fe K-edge toward lower energy values. Upon subsequent anodic scan,
while going upward from -0.6 V vs. Ag/AgCl to more oxidative potentials, Fe2+ cations are oxidized back to Fe3+. Such a behavior was also observed over several cycles, as depicted in
Figure 4A, where the Fe K-edge XANES spectra are depicted for the first 9 cycles,
confirming the robustness of our finding. A slight irreversibility is observed in the first cycle, probably due to some Li+ or H+ trapped in the material. On the other hand, the W L3-edge
position does not show any significant energy shift under the same operando conditions, as can be seen from Figure 4B.
Figure 3: (a) Operando Fe K-edge XANES spectra for the FWO electrode, compared to
reference samples (NH4)2Fe(SO4)2 (Fe2+, teal), Fe3O4 (Fe2.67+, light blue) and Fe2O3 (Fe3+,
grey). Inset: zoom in the pre-edge region showing the spectra of the FWO electrode in reduction at -0.6 V (dark green) and in oxidation at 0 V vs. Ag/AgCl (yellow). The pristine electrode (dashed dark blue line) is also shown for comparison.
(b) Enlargement of the normalized absorption evidencing the change in Fe K-edge energy while cycling the electrodes between 0 V vs. Ag/AgCl down to -0.6 V vs. Ag/AgCl at 10 mV.s-1. The color code of the spectra is the same as the cyclic voltammogram presented in Figure 2.
Figure 4: Evolution of the operando XANES spectra for the FWO electrode at (a) Fe K-edge
and (b) W L3-edge during 9 cycles between 0 V vs. Ag/AgCl down to -0.6 V vs. Ag/AgCl at
10 mV.s-1.
For a quantitative and comparative analysis, the edge position corresponding to the energy at 0.7 normalized absorption was considered. In this way, the linear relationship between the edge position and the oxidation state can be used, avoiding the spurious electronic effect related to the different local geometries. [18] The edge positions during the cyclic voltammogram are reported for Fe and W in Figure 5A and 5B, respectively. Using Fe2+ ((NH4)2Fe(SO4)2 6H2O), Fe2.67+ (Fe3O4) and Fe3+ (Fe2O3) as references, changes in the Fe
oxidation state could be quantitatively extracted. Thus, for the iron tungstate electrode, a noticeable and linear change in Fe mean oxidation state is evidenced upon potentiodynamic cycling, corresponding to Fe2.55+ oxidized to Fe2.80+ upon anodic scan while a reversible change is measured upon cathodic one (Figure 5A). It can also be noted that, at a given potential, either in reduction or in oxidation, the energy shift of the Fe K-edge is almost the
same, at less than 0.1 eV, corresponding to a change of ± 0.02 in Fe mean oxidation state. This finding supports the pseudocapacitive behavior hypothesized for this multicationic oxide.[10a] At such a high measurement rate, the observed change in the iron mean oxidation state is not related to any long polarization time at a constant potential value, as it could be argued from previous in situ studies. Even at such a fast cycling rate, the role of Fe cation redox centers is thus unambiguously evidenced. Regarding the redox activity of W, the operando W L3-edge XANES spectra do not show any edge shift during cycling, as can be
observed from Figures 4B and 5B, thus emphasizing that W6+ cations act as spectator cations which do not participate in the charge storage mechanism of the electrode.
Figure 5: Evolution of the (a) Fe K-edge energy and mean Fe oxidation state and (b) W L3
-edge as a function of electrode potential when cycled between 0 V vs. Ag/AgCl down to -0.6 V vs. Ag/AgCl at 10 mV.s-1.
To estimate the Faradaic contribution to the capacity, the change in the iron oxidation state upon cycling the FWO electrode between -0.6 V and 0.0 V vs Ag/AgCl was considered to correspond to an electronic transfer of ca. 0.25 electron per iron center (a variation from
Fe2.55+ to Fe2.80+, Figure 5A). This number of exchanged electrons can then be translated into a capacity using equation (1):
𝑄 =𝐹×𝑛𝑀 (1)
where Q is the calculated gravimetric capacity of the sample (C.g-1), F is the Faraday constant (96 485 C.mol-1), n is the number of electrons exchanged, and M is the molar mass of the material (g.mol-1). Considering the formula ⊡1 3⁄ 𝐹𝑒2 3𝐼𝐼𝐼⁄ 𝑊𝑂4 of our sample and the
corresponding values for n and M (𝑛 =23× 0.25 ≈ 0.167 and M = 285 g.mol-1
), a capacity of 56 C.g-1 can then be deduced from the operando XAS experiment, which is consistent with the value obtained from the cyclic voltammetry experiments (QCV = 60 C.g-1).
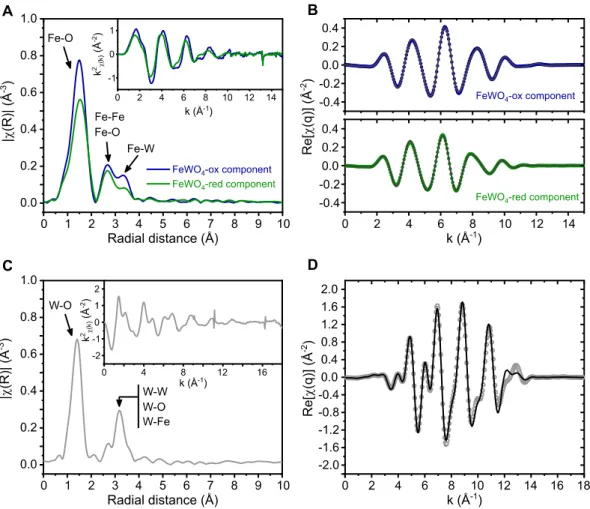
All the results obtained by XANES are also confirmed using the chemometric approach described in detail in the Supporting Information (see Figure S7 and S8). To get further insights about the structural evolution of the iron tungstate under operando conditions, the extended X-ray absorption fine structure (EXAFS) regions at Fe K- and W L3-edges were
analyzed (Figure 6). Figure 6a shows the magnitude of the Fourier transforms |FT(k2χ(k))| of the EXAFS oscillations corresponding to the pristine and the reduced electrode at -0.6 V vs Ag/AgCl. The main peak at ∼1.5 Å is due to Fe-O bond lengths (4 O at 1.96 Å and 2 O at 2.01 Å), while the peak at ∼2.5 A corresponds to the Fe-Fe and Fe-O bond lengths (2 Fe atoms at ∼ 3.04 Å and 4 O at 3.36 Å) and the peak at ∼3.2 Å corresponds to the Fe-W bond length. When the electrode is polarized at -0.6 V vs Ag/AgCl, the FeO6 octahedron gets
regular with 6 oxygen at 2.03 Å, as also shown by the disappearance of the pre-peak. The shortening of Fe-O bondlengths (Table S3) confirms the Fe3+/Fe2+ redox activity. On the other hand, no structural evolution could be detected from EXAFS data at W L3-edge upon
Figure 6: Magnitude of Fourier transforms of k2-weighted EXAFS oscillations for FeWO4’s
first cycle along with fitting results. (a, b) Principal components analysis (PCA) at Fe K-edge showing the two reconstructed principal components, i.e. FeWO4-ox (dark blue, pristine
sample) and FeWO4-red (dark green, reduced electrode at -0.6 V vs. Ag/AgCl); c) W L3-edge
spectrum, along with the fitting result (d). No structural evolution is detected at W L3-edge
during cycling.
It can thus be concluded that the tungsten in the iron tungstate structure acts as a spectator cation and not as an active redox center. Such a spectator cation helps stabilizing the structure even if electrochemical changes affect the other cations of the multicationic oxide. Indeed, the WO6 octahedra backbone of FWO is not affected by the electrochemical cycling while FeO6
calculations performed on the bulk phases confirm that the tungsten atomic charge does not change with and that the DOS projected on Fe and W invariably displays Fe(d)-bands below and above the Fermi level (see Supporting Information for details). This clearly supports that iron should be the main redox center of both the anodic and cathodic scans, as deduced from operando XAS spectra. To definitely assess this statement, Fukui functions were computed for Fe-defective bulk phases. The Fukui function is a pertinent electrochemical descriptor as it measures the response of the system electron density to an electronic charge (electron or hole), including polarization effects. [21] Adding a fraction of electron or hole to the system therefore allows following how the electron density dynamically adapts to a cathodic or anodic scan, respectively. As shown in Supporting Information (Figure S6), the oxidation (resp. reduction) of iron is confirmed for the anodic (resp. cathodic) scan. The results also reveal that in the wolframite structure, the tungsten is likely to participate to the charge storage mechanism, but only if the material is a perfect crystal (no defect). This is therefore not the case for the Fe-deficient material studied herein. However, one should note that even in the case of a natural wolframite crystal, small amounts of Fe3+ (and therefore defects) can be detected, as shown by MacKenzie et al. [22] Therefore, triggering the redox activity of W in iron tungstate seems unfortunately highly unlikely, especially considering the fact that nanosized particles are generally needed to reach high capacitance values in a pseudocapacitive material. The computed Fukui functions also illustrate that, interestingly, the content of which is linearly correlated to the Fe(d) band integration around the Fermi level, is also correlated to the capacity obtained in our different samples. This demonstrates that the pseudocapacitance experimentally measured is directly related to the concentration of native point defects in the ⊡𝑦𝐹𝑒(1−3𝑦)𝐼𝐼 𝐹𝑒2𝑦𝐼𝐼𝐼𝑊𝑂4 system. This finding can therefore explain the
discrepancies in the capacitance values displayed by iron tungstate depending on its synthesis route. [10a]
3. Conclusion
In this study, operando X-ray absorption spectroscopy was used to show how the capacitive-like electrochemical signature of FeWO4–based electrode can be unambiguously assigned to a
pseudocapacitive charge storage. The experiments were performed upon operating the electrode at a realistic timescale (one-minute charge/discharge cycles), thus enabling to monitor the variations of the iron and tungsten oxidation states occurring in the FWO material, unveiling its charge storage behavior upon cycling. Our results lead to the conclusions that i) iron tungstate is a pseudocapacitive material since the charge storage mechanism involves a linear variation of the Fe oxidation state over the applied potential window, ii) the capacity measured with the use of electrochemical characterization fits well with the redox capacity related to Fe3+/Fe2+ redox couple, iii) these findings are in good agreement with the charge storage mechanism recently predicted and presently confirmed either by operando XAS measurements and Fukui function calculations, iv) W6+ acts as a spectator cation, probably helping to maintain the crystallographic structure upon cycling the electrode.
This operando XAS approach can be therefore advantageously used to investigate the electrochemical behavior of other pseudocapacitive multicationic oxides or transition metal nitrides for which the charge storage mechanism is still speculative. This fundamental knowledge is crucial to facilitate the research and the design of new pseudocapacitive materials and architectures with improved performance.
Reagents: All reagents used in this work were purchased commercially from Sigma-Aldrich or Alfa Aesar, were at least 99% purity and were used as received.
Materials synthesis: Iron tungstate (FWO) was synthesized via a microwave-assisted coprecipitation route. First, stoichiometric 2 M aqueous solutions of Fe2+ and W6+ precursors were obtained by separately dissolving iron (II) chloride and sodium tungstate in distilled water. Then, both solutions were slowly mixed together under vigorous stirring before being subjected to microwave heating. The synthesis was carried out at a constant temperature of 100°C with a 200 W power for 1 h in a SAIREM MiniFlow 200SS microwave reactor. The obtained brown powder was centrifugated and resuspended in water and ethanol several times, before being dried overnight at 35°C under primary vacuum.
X-ray powder diffraction: X-ray diffraction patterns of FeWO4 were collected in
Bragg-Brentano configuration with a PANalytical X'Pert Pro diffractometer using Cu Kα radiation, equipped with an X'Celerator detector operating at 40 kV – 40 mA in the range 2Cu K = 10 –
90° with a 2 step size of 0.017°.
Electron microscopy: The size and morphology of the synthesized FWO nanoparticles were characterized using a Hitachi H9000-NAR transmission electron microscope. Prior to examination, the samples were ultrasonically dispersed in ethanol. A drop of the suspension was then deposited on a copper grid previously covered with a thin holey carbon film.
Electrodes preparation: All electrodes were prepared using FWO, carbon black (100% compressed; Alfa Aesar; > 99.9 %) and polytetrafluoroethylene (60 wt % dispersion in H2O,
to the components and the obtained mixture was stirred on a hot plate to slowly and partially evaporate the solvent. The resulting homogeneous paste was cold-laminated into thick films (120-150 µm) that were subsequently dried at 60°C in air. Finally, disk-shaped electrodes (10 mm diameter) were cut out from the films and pressed at 900 MPa onto stainless steel grid current collectors. Rectangle-shaped holes (1x5 mm) were drilled in all current collectors beforehand for XAS measurements (see Figure S2B). All the electrodes used in this study displayed a mass loading of 10.0±0.3 mgFeWO4.cm-2, which is a standard value for real-life
commercial devices.
Electrochemical measurements: The prepared electrodes were electrochemically characterized using a VMP3 galvanostat-potentiostat from Biologic run under EC-Lab software. All the experiments were conducted in a three-electrode configuration using a platinum wire and an Ag/AgCl (3M NaCl) assembly as the counter and reference electrode, respectively. FWO composite electrodes were tested in cyclic voltammetry between -0.6 and 0 V vs. Ag/AgCl in an aqueous 5 M LiNO3 electrolyte at room temperature.
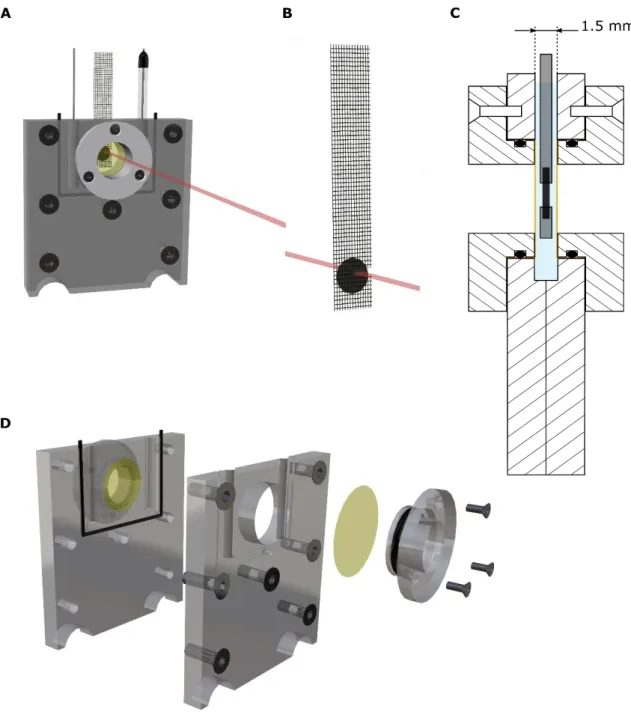
Electrochemical cell for operando X-ray Absorption Spectroscopy: The operando measurements were performed in a three-electrode cell assembly that has been specifically designed and manufactured in our lab for this study. The FWO working electrode was placed in the electrolyte between two thin (10 µm) Kapton® windows. Both reference and counter electrodes were placed on the sides of these windows so that the thickness of electrolyte is limited to 1.5 mm, which enables quick data acquisitions at the investigated energy ranges. More detailed information on the electrochemical cell assembly can be found in Figure S2.
X-ray Absorption Spectroscopy (XAS): The X-ray absorption spectroscopy experiments were performed at the ROCK beamline of SOLEIL synchrotron radiation facility (France). [24] The energy of the synchrotron radiation emitted by a bending magnet source was selected using a Si(111) channel-cut quick-XAS monochromator. The spectra were collected first at Fe K-edge (7112 eV) and then at W L3-1-edges (from 10200 to 12200 eV) using a quick-XAS
monochromator oscillating with a frequency of 2 Hz with an amplitude of 2.4°.
In 0.5 second, two spectra were acquired (for example at Fe K-edge), one with increasing Bragg angles followed by one with decreasing Bragg angles. We have then considered only the upward Bragg angles and we have averaged out the XAS spectra over periods of 10 seconds. It is important to mention that we acquire a full XAS spectrum, i.e. the near edge and the extended fine structure regions. The XAS acquisitions were carried out in transmission mode using three ionization chambers mounted in series for simultaneous measurements on the electrode and a reference. The in situ electrochemical cell was placed between the first and the second ionization chambers. The energy calibration was established with simultaneous absorption measurements on a Fe or a W metal foil placed between the second and the third ionization chamber. Standard procedure was used to calibrate the energy and normalize the spectra using the Demeter package [25] and a Python routine developed for PCA analysis. [26] Commercial powders of (NH4)2Fe(SO4)2 6H2O, Fe3O4 and Fe2O3 were used as
Fe2+, Fe2.67+ and Fe3+ references, respectively.
Before running operando XAS measurements, the electrodes were placed in the in situ cell and soaked in the electrolyte for several minutes at open-circuit potential (OCP) (reference electrode Ag/AgCl; counter electrode: platinum wire). In such conditions, XAS measurements were performed at both Fe K-edge and W L3-edge in order to determine the valence of both
iron and tungsten in the pristine material. The corresponding spectra are presented in Figure
The XAS data related to the first 10 cycles at the Fe K- and W L1,3-edges were analyzed using
a chemometric approach based on a combination of Principal Component Analysis (PCA) and Multivariate Curve Resolution Alternating Least-Squares (MCR-ALS).[27] Principal Component Analysis (PCA) was applied in order to evaluate the number of orthogonal components needed to describe the whole evolution of the XAS spectra for each edge. We found that only the Fe K-edge XAS spectra were affected by the applied potential. Then, Multivariate Curve Resolution alternating Least-Squares (MCR-ALS) was used to reconstruct the 2 principal components (PCs) at Fe K-edge. The extended X-ray absorption fine structure (EXAFS) oscillations extracted at Fe K-edge for the PCS and at W L3-edge on the pristine
material were modeled using the Artemis software. [25] As input model to refine the EXAFS oscillation, we have used the structure reported by Almeida and coworkers. [28] The details about the EXAFS analysis are provided in the SI.
Supporting information
Supporting Information is available from the Wiley Online Library or from the author.
Acknowledgements
This work was supported by a public grant overseen by ANR IVEDS (ANR-15-CE05-0011-01), the Université de Nantes and the French “Réseau sur le stockage électrochimique de l'énergie” (RS2E) through the project ANR-10-LABX-76-01. This study was also supported by the Global Innovation Re-search Organization in TUAT. The authors would like to thank P. Léone (IMN) and M. Sougrati (ICGM) for running the Mössbauer spectroscopy experiments and F. Guillou (IMN) for his valuable help with the design and the fabrication of the electrochemical cell. We also thank S. Belin for her help during the experiment 20151183 on the ROCK beamline (financed by the French National Research Agency (ANR) as a part
of the "Investissements d'Avenir" program, reference: ANR-10-EQPX-45) of SOLEIL synchrotron.
References
[1] H. I. Becker (General Electric), U.S. Patent 2 800 616, 1957.
[2] J. R. Miller, in Supercapacitors: Materials, Systems and Applications (Eds.: F. Béguin, E. Frąckowiak), Wiley-VCH Verlag GmbH & Co. KGaA, Weinheim, Germany, 2013, pp. 509-526.
[3] B. E. Conway, Electrochemical Supercapacitors: Scientific Fundamentals and Technological Applications, Kluwer Academic/Plenum Publishers, New York, 1999. [4] F. W. Richey, C. Tran, V. Kalra, Y. A. Elabd, J. Phys. Chem. C 2014, 118, 21846. [5] M. D. Levi, N. Levy, S. Sigalov, G. Salitra, D. Aurbach, J. Maier, J. Am. Chem. Soc.
2010, 132, 13220.
[6] H. Liu, P. K. Allan, O. J. Borkiewicz, C. Kurtz, C. P. Grey, K. W. Chapman, P. J. Chupas, J. Appl. Cryst. 2016, 49, 1665.
[7] N. Goubard-Bretesché, O. Crosnier, F. Favier, T. Brousse, Electrochim. Acta 2016, 206, 458.
[8] a) V. Augustyn, P. Simon, B. Dunn, Energy Environ. Sci. 2014, 7, 1597; b) P. Simon, Y. Gogotsi, B. Dunn, Science 2014, 343, 1210; c) T. Brousse, D. Bélanger, J. W. Long, J. Electrochem. Soc. 2015, 162, A5185; d) C. Costentin, T. R. Porter, J.-M. Savéant, ACS Appl. Mater. Inter. 2017, 9, 8649.
[9] O. Crosnier, N. Goubard-Bretesché, G. Buvat, L. Athouël, C. Douard, P. Lannelongue, F. Favier, T. Brousse, Curr. Opin. Electrochem. 2018, 9.
[10] a) N. Goubard-Bretesché, O. Crosnier, C. Payen, F. Favier, T. Brousse, Electrochem. Commun. 2015, 57, 61; b) N. Goubard-Bretesché, O. Crosnier, G. Buvat, F. Favier, T. Brousse, J. Power Sources 2016, 326.
[11] Y. Mo, M. R. Antonio, D. A. Scherson, J. Phys. Chem. B 2000, 104, 9777.
[12] a) J.-K. Chang, M.-T. Lee, W.-T. Tsai, J. Power Sources 2007, 166, 590; b) K.-W. Nam, M. G. Kim, K.-B. Kim, J. Phys. Chem. C 2007, 111, 749; c) M.-T. Lee, J.-K. Chang, W.-T. Tsai, C.-K. Lin, J. Power Sources 2008, 178, 476; d) H.-W. Chang, Y.-R. Lu, J.-L. Chen, C.-L. Chen, J.-F. Lee, J.-M. Chen, Y.-C. Tsai, C.-M. Chang, P.-H. Yeh, W.-C. Chou, Y.-H. Liou, C.-L. Dong, Nanoscale 2015, 7, 1725.
[13] a) M. Toupin, T. Brousse, D. Bélanger, Chem. Mater. 2004, 16, 3184; b) M. Nakayama, A. Tanaka, Y. Sato, T. Tonosaki, K. Ogura, Langmuir 2005, 21, 5907. [14] M. R. Lukatskaya, S.-M. Bak, X. Yu, X.-Q. Yang, M. W. Barsoum, Y. Gogotsi, Adv.
Energy Mater. 2015, 5, 1500589.
[15] a) D. Chen, D. Ding, X. Li, G. H. Waller, X. Xiong, M. A. El-Sayed, M. Liu, Chem. Mater. 2015, 27, 6608; b) L. Yang, S. Cheng, J. Wang, X. Ji, Y. Jiang, M. Yao, P. Wu, M. Wang, J. Zhou, M. Liu, Nano Energy 2016, 30, 293.
[16] G. Ouvrard, M. Zerrouki, P. Soudan, B. Lestriez, C. Masquelier, M. Morcrette, S. Hamelet, S. Belin, A. M. Flank, F. Baudelet, J. Power Sources 2013, 229, 16. [17] a) H. Koga, L. Croguennec, M. Ménétrier, P. Mannessiez, F. Weill, C. Delmas, S.
Belin, J. Phys. Chem. C 2014, 118, 5700; b) C. Marino, B. Fraisse, M. Womes, C. Villevieille, L. Monconduit, L. Stievano, J. Phys. Chem. C 2014, 118, 27772; c) Y. Gorlin, M. U. M. Patel, A. Freiberg, Q. He, M. Piana, M. Tromp, H. A. Gasteiger, J. Electrochem. Soc. 2016, 163, A930; d) J. Sottmann, F. L. M. Bernal, K. V. Yusenko, M. Herrmann, H. Emerich, D. S. Wragg, S. Margadonna, Electrochim. Acta 2016, 200, 305.
[18] a) G. A. Waychunas, M. J. Apted, G. E. Brown, Phys. Chem. Miner. 1983, 10, 1; b) A. J. Berry, H. S. C. O’Neill, K. D. Jayasuriya, S. J. Campbell, G. J. Foran, Am. Mineral.
2003, 88, 967.
[19] S. Rajagopal, D. Nataraj, O. Y. Khyzhun, Y. Djaoued, J. Robichaud, D. Mangalaraj, J. Alloy. Compd. 2010, 493, 340.
[20] K. Hoang, Physical Review Materials 2017, 1.
[21] J. S. Filhol, M. L. Doublet, J. Phys. Chem. C 2014, 118, 19023.
[22] K. J. D. MacKenzie, J. Temuujin, C. McCammon, M. Senna, J. Eur. Ceram. Soc.
2006, 26, 2581.
[23] T. Brousse, P.-L. Taberna, O. Crosnier, R. Dugas, P. Guillemet, Y. Scudeller, Y. Zhou, F. Favier, D. Bélanger, P. Simon, J. Power Sources 2007, 173, 633.
[24] a) V. Briois, C. Cartier Dit Moulin, M. Verdaguer, Actual. Chim. 2000, 3; b) V. Briois, C. La Fontaine, S. Belin, L. Barthe, T. Moreno, V. Pinty, A. Carcy, R. Girardot, E. Fonda, J. Phys.: Conf. Ser. 2016, 712, 012149.
[25] a) D. C. Koningsberger, R. Prins, X-ray absorption : principles, applications,
techniques of EXAFS, SEXAFS, and XANES, Wiley, New York, 1988; b) B. Ravel, M. Newville, J. Synchrotron Rad. 2005, 12, 537.
[26] C. Lesage, E. Devers, C. Legens, G. Fernandes, O. Roudenko, V. Briois, Catal. Today
2019, 336, 63.
[27] a) A. Iadecola, A. Perea, L. Aldon, G. Aquilanti, L. Stievano, J. Phys. D: Appl. Phys.
2017, 50, 144004; b) M. Fehse, A. Iadecola, M. T. Sougrati, P. Conti, M. Giorgetti, L.
Stievano, Energy Storage Mater. 2019, 18, 328.
[28] M. A. P. Almeida, L. S. Cavalcante, C. Morilla-Santos, C. J. Dalmaschio, S. Rajagopal, M. S. Li, E. Longo, CrystEngComm 2012, 14, 7127.
Unveiling Pseudocapacitive Charge Storage Behavior in FeWO4 Electrode Material by
Operando X-ray Absorption Spectroscopy
N. Goubard-Bretesché, O. Crosnier, C. Douard, A. Iadecola, R. Retoux, C. Payen, M.-L. Doublet, K. Kisu, E. Iwama, K. Naoi, F. Favier,and T. Brousse*
TOC :
Operando X-ray Absorption Spectroscopy (XAS) has been used to elucidate the charge storage mechanism of FeWO4 when used as a negative electrode material in an aqueous
electrochemical capacitor. Both Fe K-edge and W L3-edge measurements point out the
involvement of the Fe3+/Fe2+ redox couple, while W6+ acts as a spectator cation,
Copyright WILEY-VCH Verlag GmbH & Co. KGaA, 69469 Weinheim, Germany, 2018.
Supporting Information
Unveiling Pseudocapacitive Charge Storage Behavior in FeWO4 Electrode Material by
Operando X-ray Absorption Spectroscopy
Nicolas Goubard-Bretesché, Olivier Crosnier, Camille Douard, Antonella Iadecola, Richard Retoux, Christophe Payen, Marie-Liesse Doublet, Kazuaki Kisu, Etsuro Iwama, Katsuhiko Naoi, Frédéric Favier,and Thierry Brousse*
Supporting figures
Figure S1: A) Typical voltammogram and B) Long term cycling behavior of the FeWO4
material over 10 000 cycles. Electrolyte: 5M LiNO3; Scan rate: 20 mV.s-1. The decay
observed on the first 1000 cycles maybe due to a rearrangement at the surface of the particles during cycling.
Figure S2: 3D Representation of the electrochemical cell used for the operando experiments.
The FeWO4 working electrodes were immersed in a 5M LiNO3 aqueous electrolyte confined
between two polyimide (Kapton®) 10µm-thick films (represented in yellow), separated by a distance of 1.5 mm from each other. The reference and counter electrodes were put on both sides of the Kapton films to avoid increasing the thickness of electrolyte. A) General overview with the platinum counter electrode, the working electrode and the Ag/AgCl reference electrode; B) Typical FeWO4 electrode, with a rectangle-shaped hole of 5 mm x 1
mm cut in the current collector (stainless steel grid) to avoid any absorption of the incident beam (represented in red); C) Cross-sectional schematic view of the inside of the in situ cell;
Figure S3: A) XANES spectra of FeWO4 (dark blue), and the iron-containing references used
in the study. Inset: zoom in the pre-edge region; B) Mössbauer spectrum of the FeWO4
sample, along with its calculated Fe2+ and Fe3+ contents. The pristine material only contains Fe3+.
Figure S4: A) W L3-edge XANES spectra of the FeWO4 electrode (dark blue), compared to
the WO3 reference sample (W6+, brown); B) Corresponding derivative spectra showing the
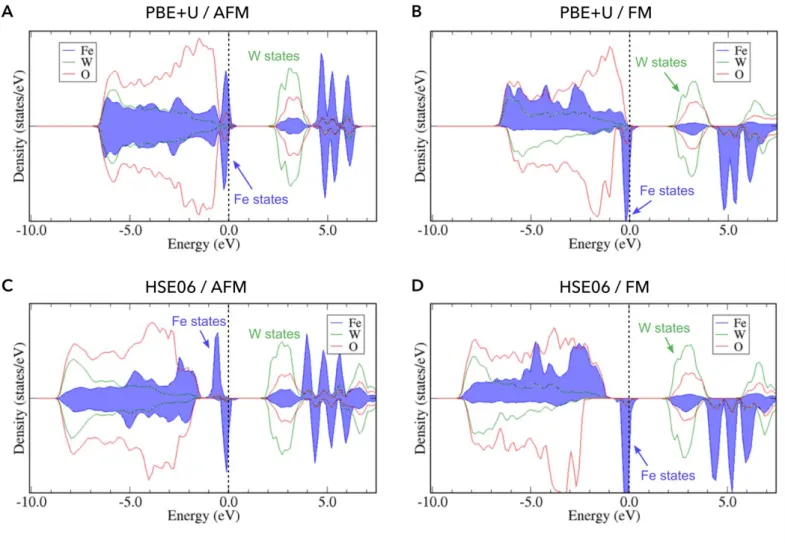
Figure S5: Atom-projected Density of states for the stoichiometric FeWO4 material,
computed within the DFT framework using various XC functionals: PBE+U (A, B) and HSE06 (C, D), and different spin configurations: Antiferromagnetic AFM (A, C) and Ferromagnetic FM (B, D). All calculations invariably show a narrow Fe-band below the Fermi level consistent with the polaronic effect already reported for this system and a wider W-band above the Fermi level. Note that a small fraction of holes is already visible in the stoichiometric FeWO4 material, in full agreement with the occurrence of polarons and
Figure S6: Atom-projected Density of states for A) stoichiometric FeWO4 and B)
Fe-defective ⊡𝑦 𝐹𝑒(1−3𝑦)𝐼𝐼 𝐹𝑒2𝑦𝐼𝐼𝐼𝑊𝑂4 bulk, as well as Fukui functions 𝑓+ and 𝑓− for C) stoichiometric FeWO4 and D) Fe-defective ⊡𝑦 𝐹𝑒(1−3𝑦)𝐼𝐼 𝐹𝑒2𝑦𝐼𝐼𝐼𝑊𝑂4 bulk, as computed from
first-principles DFT calculations in the AFM spin configuration. Iron, tungsten and oxygen are represented in blue, green and red, respectively both in the pDOS plots and in the crystal structures. The Fermi level is indicated by the vertical dotted line in the pDOS. The yellow and blue volumes of the Fukui functions represent the accumulation and depletion of charge around each atom. For the stoichiometric FeWO4, the pDOS shows a narrow Fe-band below
the Fermi level and a wider W-band above the Fermi level. Accordingly, the Fukui functions 𝑓− (hole addition) and 𝑓+ (electron addition) show that Fe and W are the main centers of the
oxidation (anodic scan) and reduction (cathodic scan), respectively. When Fe-vacancies are introduced in the FeWO4 supercell (16 formula units), the spliting of the Fe-states around the
Fermi level leads to a different electrochemical response of the system with Fe being the redox center of both the anodic and cathodic scans, even at very low y-content (here 1/16).
Note that the increase of y is directly correlated to the increase of the Fe-band DOS above the Fermi level and therefore with the increase of the capacitance of the cathodic scan.
Figure S7: Variance plot in logarithmic scale on the XAS dataset at Fe K- and W L1,3-edges
related to the first 10 cycles. It is clear that 2 principal components are needed to describe the whole evolution of the XAS data at Fe K-edge while no evolution is found for the W L-edges XAS data.
Figure S8: Fe K-edge XANES spectra of the reconstructed components (PC1 and PC2) along
with the corresponding operando scan (#1 and #24); the relative concentration of the PC1 and PC2 species during the first 10 cycles, confirming the robustness of the charge storage mechanism in FeWO4. PC1 corresponds to the reconstructed component of the pristine
sample (FeWO4-ox, in Figure 6 of the manuscript) and PC2 to the reduced state (at -0.6 V vs.
Figure S9: HRTEM images of uncycled (pristine) and cycled (10000 charge/discharge
cycles) of iron tungstate particles. Electron diffraction only shows a slight amorphization of the particle surface after 10000 cycles.
Pristine
10 Cycled
Supporting Tables
Table S1: Summary of the characteristics of the FeWO4 sample used as the electrode material
Particle size (TEM Images) ~ 8x15 nm
Specific surface area SBET (BET method, N2 adsorption) 73 m2.g-1
Mean diameter from SBET (Based on spherical particles) 11 nm
Measured density (He pycnometry) 5.12(3) g.cm-3
Fe mean oxidation state (Mössbauer spectroscopy) 3.00
Table S2: ICP-OES analysis of Fe and W in the iron tungstate sample solution.
Fe Concentration (average): 30.85 ppm W Concentration (average): 148.86 ppm
Calculated molar ratio Fe/W in the sample: 0.68
Element Emission
wavelength Replicate 1 Replicate 2 Replicate 3
(nm) (ppm) (ppm) (ppm) Fe 234.350 31.10 31.08 31.06 Fe 238.204 30.82 30.80 30.79 Fe 259.940 30.73 30.62 30.69 W 207.912 148.03 147.53 147.71 W 209.475 148.53 148.83 148.78 W 220.449 149.75 150.01 150.61
Table S3: Summary of the EXAFS analysis parameters. The variation of the Fe-O and Fe-Fe
bondlengths between the pristine sample and the reduced electrode confirms the Fe3+/Fe2+ redox activity, while no bondlength modification is detected at W L3-edge.
Supporting Experimental Section
Specific Surface Area measurements: Specific surface areas were obtained by Brunauer−Emmett−Teller (BET) analyses performed with a Quantachrome Nova 4200e operated with nitrogen gas.
Density measurements: Density measurements were carried out by pycnometry under He pressure using an AccuPyc 1330 system from Micromeritics Instrument Corporation.
Mössbauer Spectroscopy: The 57Fe Mössbauer spectrum was collected at ambient temperature in transmission geometry on a constant acceleration spectrometer using a 57Co(Rh) -ray source. Velocity and isomer shift calibrations were performed using -Fe as a standard.
Pristine (PC1) Fe K-edge Reduced (PC2) Fe K-edge Pristine W L3-edge
4 x O at 1.96 Å 2 x O at 2.01 Å 2 x Fe at 3.04 Å 4 x O at 3.34 Å 6 x O at 2.03 Å 2 x Fe at 3.07 Å 4 x O at 3.37 Å 4 x O at 1.80 Å 2 x O at 2.10 Å 2 x W at 3.21 Å 8 x O at 3.30 Å 8 x Fe at 3.56 Å 2 (Fe-O) = 0.009 Å2 2 (Fe-Fe) = 0.014 Å2 2 (Fe-O) = 0.013 Å2 2 (Fe-Fe) = 0.016 Å2 2 (W-O) = 0.007 Å2 2 (W-W) = 0.007 Å2 2 (W-Fe) = 0.016 Å2 S02 = 0.8 S02 = 0.8 S02 = 1 E0 = -4.0 eV E0 = -2.3 eV E0 = 2.5 eV
Quadrupole splitting data were analyzed as discrete 0.1 mm.s-1 step distributions in the 0 to 6 mm.s-1 range and fitted with Gaussian distribution curves.
DFT Calculations: Spin-polarized density functional theory (DFT) calculations were performed using the plane-wave density functional theory VASP (Vienna ab initio simulation package) code[S1] within the generalized gradient approximation of Perdew−Burke−Ernzerhof (PBE)[S2] or the range-separated (HSE06)[S3] hybrid functionals for exchange and correlation potentials. The rotationally invariant Dudarev method (DFT + U)[S4] was used to correct the self-interaction error of conventional DFT for correlated d-electrons with U = 5.3 eV and 2 eV for the Fe and W, respectively.
Fukui functions are used as a probe of the highest-occupied and lowest-unoccupied states of a system. It represents the variation of the electron density of a given system when a fraction of electron or hole is added to the system. It is a typical electrochemical descriptor as it allows identifying the redox center of the cathodic and anodic reactions.[S5]
EXAFS Analysis: The k2-weighted EXAFS oscillation were extracted at Fe K-edge and at W L3-edge using a Gaussian window in the k range [2.4, 12] Å-1 and [3.6,13.4] Å-1, respectively.
The Back-Fourier trasnforms were performed in the R range [1, 3] Å at Fe K-edge and [1.05, 3.8] Å at W L3-edge using the Hanning window. The phase shifts and structural parameters
were obtained by Demeter package, using the crystallographic structure reported by Almeida and coworkers as starting model.[S6] The coordination number, the reduction factor S20 and E0 were kept fixed during the fitting procedure at both edges. Only the radial distances Ri
and the mean square related displacements (MSRD) 2i were allowed to vary. The uncertainty
Elemental analysis (ICP): The composition of the synthesized FeWO4 sample was determined
by Inductively Coupled Plasma Spectroscopy (ICP) analysis, using an Agilent 5100 ICP-OES spectrometer. The sample solution was prepared by dissolving a few mg of the iron tungstate powder in concentrated hydrochloric acid (35%). The obtained yellow solution was then diluted by adding nanopure water, so that the final HCl and FeWO4 sample concentrations
were 5% and ca. 200 ppm. As tungsten has a tendency to reprecipitate with time in such a medium (by hydrolysis, as WO3), the ICP analysis was performed immediately after the
preparation of the solution. Each measurement consisted in the analysis of three different wavelengths per element (Fe and W) and the measurements were replicated three times. The obtained concentration values are presented in Table S3.
Supporting References
[S1] a) G. Kresse, J. Furthmüller, Comput. Mater. Sci. 1996, 6, 15; b) G. Kresse, J. Hafner, Phys. Rev. B 1993, 47, 558.
[S2] J. P. Perdew, K. Burke, M. Ernzerhof, Phys. Rev. Lett. 1996, 77, 3865. [S3] J. Heyd, G. E. Scuseria, M. Ernzerhof, J. Chem. Phys. 2003, 118, 8207.
[S4] S. L. Dudarev, G. A. Botton, S. Y. Savrasov, C. J. Humphreys, A. P. Sutton, Phys. Rev. B 1998 57, 1505.
[S5] R. G. Parr, W. Yang, J. Am. Chem. Soc. 1984, 106, 4049.
[S6] M. A. P. Almeida, L. S. Cavalcante, C. Morilla-Santos, C. J. Dalmaschio, S. Rajagopal, M. S. Li, E. Longo, CrystEngComm 2012, 14, 7127.